The Cambridge Associates LLC Developed Markets ex US Private Equity and Venture Capital (PE/VC) Index returned -1.5% in first half 2020 in USD terms after suffering significant losses (-10.8%) from the onset of COVID-19 in first quarter. The Cambridge Associates LLC Emerging Markets Private Equity and Venture Capital Index earned 4.7% due to a strong second quarter recovery of 11.4% and a modest pandemic-driven downturn earlier in the year. Because returns are measured in US dollars, the currency’s strength in relation to the euro impacts performance of the developed markets index. The dollar strengthened and then weakened marginally in the first and second quarters, respectively, but was virtually unchanged over the full first six months of 2020. As a result, the six-month performance measured in both currencies is almost identical (Figure 1). The developed and emerging markets PE/VC indexes have outperformed their public market counterparts across time (based on modified public market equivalent [mPME] returns).
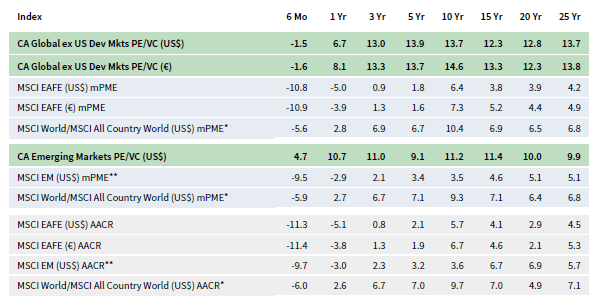
FIGURE 1 GLOBAL EX US PRIVATE EQUITY AND VENTURE CAPITAL INDEX RETURNS
Periods Ended June 30, 2020 • Percent (%)
* MSCI All Country World Constructed Index: Data from 1/1/1986 to 12/31/1987 represented by MSCI World Index gross total return. Data from 1/1/1988 to present
represented by MSCI ACWI gross total return.
** MSCI EM Constructed Index: Data from 1/1/1986 to 12/31/1987 represented by GFD Emerging Markets price return. Data from 1/1/1988 to present represented by MSCI Emerging Markets total return gross.
Sources: Cambridge Associates LLC, Global Financial Data, Inc., MSCI Inc., and Thomson Reuters Datastream. MSCI data provided “as is” without any express or implied warranties.
First Half 2020 Highlights
- The pandemic’s negative impact transcended strategies and regions, with public companies suffering historical sell-offs in the first quarter, helping the developed ex US and emerging markets PE/VC indexes to continue their outperformance over comparable public equity indexes (MSCI EAFE and MSCI EM) across all time periods (Figure 1). The emerging markets PE/VC index was the only one to post a positive return for first half 2020.
- Based on market values at June 30, 2020, public companies accounted for about 5% of the developed markets PE/VC index and about 18% of the emerging markets PE/VC index.
Developed ex US Markets Private Equity and Venture Capital Performance Insights
Vintage Years
During the first six months of 2020, only two of the six meaningfully sized vintage years (those that represented at least 5% of the index’s value) posted positive returns; 2015 (8.3%) and 2017 (2.8%). Performance for the other four key vintage years ranged from -5.3% for 2014 to -1.3% for 2016, pulling down the overall return to an average of -0.4% for the largest six vintages that, combined, accounted for 75% of the index (Figure 2). Write-ups and significant exposure to IT companies helped generate strong performance for the 2015 and 2017 vintage years. Another positive contributor to funds formed in 2015 was strong returns in its largest sector, healthcare. The four worst-performing meaningfully weighted vintage years (2012–14, 2016) suffered significant losses from consumer discretionary and industrials companies, two sectors that were hit especially hard during the beginning of the pandemic.
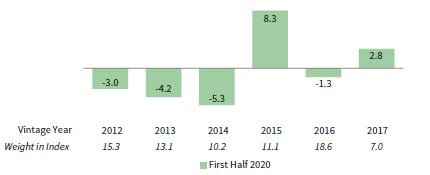
FIGURE 2 DEVELOPED MARKETS EX US PE/VC INDEX VINTAGE YEAR RETURNS: NET FUND–LEVEL PERFORMANCE
As of June 30, 2020 • USD Terms • Percent (%)
Source: Cambridge Associates LLC.
Limited partner (LP) cash flows were down substantially from the previous six months as the pandemic slowed investment activity in March and April. Distributions decreased more than 37% from levels generated during second half 2019, and contributions dropped more than 27%. Developed markets PE/VC funds returned $16.1 billion to investors during the first two quarters, the lowest amount in any six-month period since 2012. Despite being a slower period than the prior six months, LPs contributed $20.1 billion, a relatively active cycle compared to the long term. Distributions outpaced contributions in 13 of the last 15 six-month periods since the beginning of 2013, however the two exceptions occurred in the most recent year.
Almost 75% ($14.9 billion) of the capital called during the first half of the year came from funds formed in 2016–18. Each called greater than $4 billion, more than double the next highest vintage, 2019, and over five times as much as nearly every other vintage year. Distributions were limited and widespread across vintages, except for 2012 which paid out $5.6 billion, or roughly 35% of the total amount for the two quarters.
Sectors
Figure 3 shows the Global Industry Classification Standard (GICS®) sector breakdown of the Developed Markets ex US Private Equity and Venture Capital Index and a public market counterpart, the MSCI EAFE Index. The chart illustrates differences in sector exposures which helps explain performance for each index, especially since the pandemic’s impact on industries varied significantly during the first six months of the year. Notably, the PE/VC index is overweight in healthcare, IT, and consumer discretionary, and underweight in financials, consumer staples, and smaller sectors in the “other categories” (energy, utilities, and real estate).
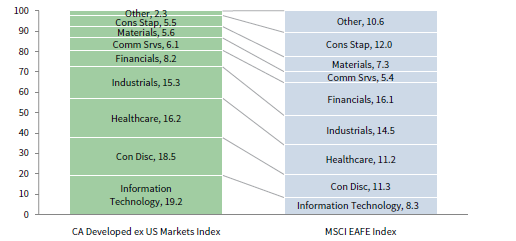
FIGURE 3 CA DEVELOPED MARKETS EX US PE/VC VS MSCI EAFE
As of June 30, 2020 • GICS® Sector Comparisons • Percent (%)
Sources: Cambridge Associates LLC, FactSet Research Systems, and MSCI Inc. MSCI data provided “as is” without any express or implied warranties.
Only two of the eight meaningfully sized sectors (IT and healthcare) earned positive returns in both USD and euros during the first two quarters (Figure 4). Performance for the other six sectors ranged from -8.6% for consumer discretionary to -0.9% for consumer staples in USD, with comparable returns in euros. The best-performing sector, IT, returned 10.8%, driven by vintages 2011–13 and 2015–17, all of which had significant IT exposures and earned positive returns over the first half of the year. For the worst-performing sector, consumer discretionary, write-downs were significant and widespread across most meaningfully weighted vintage years within the sector; the 2010 vintage was the only one with write-ups in its consumer discretionary investments. The four largest sectors—healthcare, IT, consumer discretionary, and industrials (in rank order)—represented 72% of the index’s value and returned -0.3% compared to -4.4% for all other sectors on a pooled basis in USD terms.
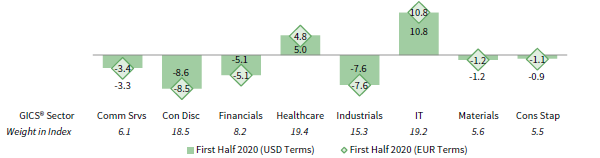
FIGURE 4 DEVELOPED MARKETS EX US PE/VC INDEX SECTOR RETURNS:
GROSS COMPANY–LEVEL PERFORMANCE
As of June 30, 2020 • Percent (%)
Source: Cambridge Associates LLC.
Four sectors: healthcare, IT, consumer discretionary, and industrials (in rank order) accounted for more than 77% of the capital invested during first half 2020. Historically, these sectors have attracted about 67% of invested capital. Allocation to healthcare companies was more than double long term trends during the period, which, with increased exposure to IT as well, accounts for much of the difference.
Countries
Among the seven meaningfully sized countries in the index, six earned small positive returns, in USD terms, ranging from 0.2% for Italy to 5.0% for the United States (Figure 5). The United Kingdom was by far the worst-performing country over first half 2020 with a -10.3% return. Combined, the seven largest countries accounted for 72% of the PE/VC index. Performance by vintage year was mixed for US companies, but especially high returns for funds formed in 2011 helped push the country to the top of the list. On the bottom, UK companies struggled across five vintage years (2012–16), averaging -9.4% and suffering more than $2.5 billion in write-downs. At the start of the year, consumer discretionary accounted for 26% of the UK sample within the developed markets index and these companies struggled as government restrictions on businesses shut down the consumer industry.
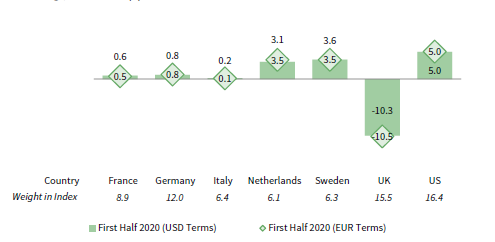
FIGURE 5 DEVELOPED MARKETS EX US PE/VC INDEX COUNTRY RETURNS: GROSS COMPANY–LEVEL PERFORMANCE
As of June 30, 2020 • Percent (%)
Source: Cambridge Associates LLC.
Companies in developed European countries garnered 73% of the capital invested during the first six months of the year, about 5% below its historical trend. US businesses attracted 19% of the invested capital, which is 6% higher than its long-term allocation.
Emerging Markets Private Equity and Venture Capital Performance Insights
Vintage Years
During the first six months of 2020, there were nine vintage years (2007, 2010–17) that accounted for at least 5% of the emerging markets benchmark; combined, the nine represented 85% of the index’s value (Figure 6). Remarkably, all nine vintages were either roughly flat or up amid a turbulent time, with three posting double-digit returns for the six-month period. Performance among the large vintages ranged from -0.4% (vintage year 2011) to 12.7% (vintage year 2014).
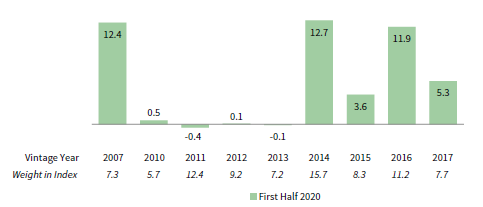
FIGURE 6 EMERGING MARKETS PE/VC INDEX VINTAGE YEAR RETURNS: NET FUND–LEVEL PERFORMANCE
As of June 30, 2020 • USD Terms • Percent (%)
Source: Cambridge Associates LLC.
Three vintages—2007, 2014, and 2016—posted returns that were head and shoulders above the rest, with each gaining 11.9% or higher. While all three benefited from strong performance in their IT portfolios, consumer staples contributed to the 2007 group’s return, consumer discretionary was the primary driver of the 2014 vintage’s performance, and healthcare was instrumental in the 2016 vintage’s strong showing. For vintage year 2011, the largest and worst-performing of the four that essentially broke even (vintages 2010–13), write-downs in consumer discretionary and staples, financials, and real estate were nearly offset by write-ups in IT and healthcare.
Unlike their developed markets counterparts, even with a slower pace of cash flows, the emerging markets PE/VC funds distributed more capital than they called ($11.8 billion and $10.9 billion, respectively). Distributions trailed the prior six-month period by 13% but capital calls dropped only 2% from second half 2019. Since the inception of the emerging markets index, distributions have outpaced contributions in slightly more than 20% of the semi-annual periods; in the last ten years, they have outpaced contributions in 50% of the semi-annual periods.
Managers of funds that were raised in 2014–18 called the most capital in first half 2020, totaling $9.0 billion and 82% of all capital called year-to-date. Each of these five vintages are actively investing and called more than $1.1 billion, with the 2018 vintage calling the most, $3.2 billion. On the distributions front, funds raised in six years (2007–08, 2010–11, 2014, and 2016) returned at least $1.1 billion to LPs, for a combined total of $8.7 billion, or 74% of the period’s total. The “oldest” vintages of the six (2007–08) returned the highest amounts, totaling $3.5 billion between them.
Sectors
Figure 7 shows the GICS® sector breakdown of the Emerging Markets PE/VC Index and a public market counterpart, the MSCI Emerging Markets Index. The breakdown provides context when comparing the performance of the two indexes. The chart highlights the differences in sector exposures between the indexes, most notably the PE/VC index’s overweight in healthcare and its similarly sized underweight in financials.
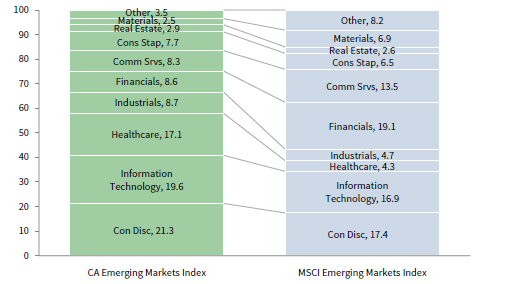
FIGURE 7 CA EMERGING MARKETS PE/VC VS MSCI EMERGING MARKETS
As of June 30, 2020 • GICS® Sector Comparisons • Percent (%)
Sources: Cambridge Associates LLC, FactSet Research Systems, and MSCI Inc. MSCI data provided “as is” without any express or implied warranties.
Five of the seven meaningfully sized sectors posted flat or positive first half returns (Figure 8). IT was the strongest performer, at 15.8% for the period, trailed by healthcare, communication services, and consumer staples, all of which earned at least 9.6%. Financials was by far the worst-performing sector. In first half 2020, four vintages (2007, 2011, 2014–15) accounted for nearly 75% of the write-ups in IT companies. The financial sector’s poor performance was the result of widespread write-downs. On a gross, dollar-weighted basis, the three largest sectors by market value—consumer discretionary, IT, and healthcare—returned 9.1% during the first half, outperforming the return for all other sectors (-1.7%) by nearly 1,100 basis points.
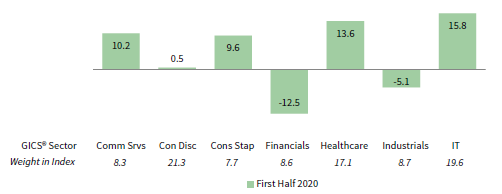
FIGURE 8 EMERGING MARKETS PE/VC INDEX SECTOR RETURNS:
GROSS COMPANY–LEVEL PERFORMANCE
As of June 30, 2020 • USD Terms • Percent (%)
Source: Cambridge Associates LLC.
Compared with the previous six months, the investment pace in this period was slower (by more than 20%). Companies across five sectors (in rank order: healthcare, consumer discretionary, IT, consumer staples, and financials) garnered 73% of the capital invested in the first six months of 2020, with consumer discretionary, healthcare, and IT attracting about 56% of all capital. Over the long term, these three sectors attracted roughly 45% of the capital invested by managers in the emerging markets index; healthcare accounted for the biggest difference between the current six months (30%) and the long-term norm (12%).
Countries
Highlighting the index’s geographic concentration, China remains, by far, the largest country component of the index (Figure 9). India and the United States[1]Funds in the emerging markets PE/VC benchmark occasionally invest in companies in developed markets regions,
as well as the emerging markets regions. round out the meaningfully sized group. South Korea fell just shy of the 5% threshold during the period and Japan was the only other country that represented more than 4% of the index’s value.
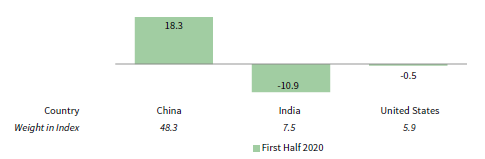
FIGURE 9 EMERGING MARKETS PE/VC INDEX COUNTRY RETURNS:
GROSS COMPANY–LEVEL PERFORMANCE
As of June 30, 2020 • USD Terms • Percent (%)
Source: Cambridge Associates LLC.
China-based companies again received more capital than any other country, at 35% of invested capital. Combined, the next four countries, South Korea, Singapore, India, and Israel attracted almost 37% of the managers’ invested capital. Over the long term, managers in the emerging markets index have allocated nearly a third of their invested capital to Chinese companies; India is the only other country that even comes close to 10%.
On a gross dollar-weighted basis, when combined, companies based in China, India, and the United States returned 12.0%, while all other countries combined for a -6.2% return in first half 2020.
Caryn Slotsky, Senior Investment Director
Wyatt Yasinski, Investment Associate
Drew Carneal, Investment Analyst
Figure Notes
Private equity includes only buyout and growth equity funds.
Global ex US Private Equity and Venture Capital Index Returns
The PE/VC indexes are pooled horizon internal rates of return and are based on limited partners’ fund-level performance; the returns are net of fees, expenses, and carried interest. Because the indexes are capitalization weighted, performance is mainly driven by the largest vintage years.
Public index returns are shown as both time-weighted returns (average annual compound returns) and dollar-weighted returns (modified public market equivalent). Returns are annualized, with the exception of returns less than one year, which are cumulative. The CA mPME replicates private investment performance under public market conditions. The public index’s shares are purchased and sold according to the private fund cash flow schedule, with distributions calculated in the same proportion as the private fund, and mPME net asset value is a function of mPME cash flows and public index returns.
Vintage Year Returns
Vintage year fund-level returns are net of fees, expenses, and carried interest.
Sector and Country Returns
Industry-specific gross company-level returns are before fees, expenses, and carried interest.
GICS® Sector Comparisons
The Global Industry Classification Standard (GICS®) was developed by and is the exclusive property and a service mark of MSCI Inc. and S&P Global Market Intelligence LLC and is licensed for use by Cambridge Associates. Other includes sectors that make up less than 3% of the CA benchmark.
About the Cambridge Associates LLC Indexes
Cambridge Associates derives its Global ex US Developed Markets Private Equity and Venture Capital Index from the financial information contained in its proprietary database of global ex US private equity and venture capital funds. As of June 30, 2020, the database comprised 897 global ex US developed markets buyouts, growth equity, and venture capital funds formed from 1986 to 2020 with a value of about $291 billion. Ten years ago, as of June 30, 2010, the benchmark index included 559 global ex US developed markets funds, whose value was roughly $176 billion. The funds in this index invest primarily in developed markets in Australia, Canada, Israel, Japan, New Zealand, Singapore, and Western Europe.
Cambridge Associates derives its Emerging Markets Private Equity and Venture Capital Index from the financial information contained in its proprietary database of global ex US buyouts, growth equity, and venture capital funds. As of June 30, 2020, the database comprised 708 emerging markets private equity and venture capital funds formed from 1986 to 2020 with a value of about $266 billion. Ten years ago, as of June 30, 2010, the benchmark index included 398 emerging markets funds, whose value was about $68 billion. The funds in this index invest primarily in Africa, emerging Asia, emerging Europe, Latin America & Caribbean, and the Middle East ex Israel.
The pooled returns represent the net periodic rates of return calculated on the aggregate of all cash flows and market values as reported to Cambridge Associates by the funds’ general partners in their quarterly and annual audited financial reports. These returns are net of management fees, expenses, and performance fees that take the form of carried interest.
About the Public Indexes
The MSCI All Country World Index (ACWI) is a free float–adjusted, market capitalization–weighted index designed to measure the equity market performance of developed and emerging markets. As of June 30, 2020, the MSCI ACWI consisted of 49 country indexes comprising 23 developed and 26 emerging markets country indexes. The developed markets country indexes included are: Australia, Austria, Belgium, Canada, Denmark, Finland, France, Germany, Hong Kong, Ireland, Israel, Italy, Japan, the Netherlands, New Zealand, Norway, Portugal, Singapore, Spain, Sweden, Switzerland, the United Kingdom, and the United States. The emerging markets country indexes included are: Argentina, Brazil, Chile, China, Colombia, Czech Republic, Egypt, Greece, Hungary, India, Indonesia, Korea, Malaysia, Mexico, Pakistan, Peru, the Philippines, Poland, Qatar, Russia, Saudi Arabia, South Africa, Taiwan, Thailand, Turkey, and the United Arab Emirates.
The MSCI EAFE Index is a free float–adjusted, market capitalization–weighted index that is designed to measure large- and mid-cap equity performance of developed markets, excluding Canada and the United States. As of June 30, 2020, the MSCI EAFE Index consisted of the following 21 developed markets country indexes: Australia, Austria, Belgium, Denmark, Finland, France, Germany, Hong Kong, Ireland, Israel, Italy, Japan, the Netherlands, New Zealand, Norway, Portugal, Singapore, Spain, Sweden, Switzerland, and the United Kingdom.
The MSCI Emerging Markets Index is a free float–adjusted, market capitalization–weighted index that is designed to measure large- and mid-cap equity performance of emerging markets. As of June 30, 2020, the MSCI Emerging Markets Index included 26 emerging markets country indexes: Argentina, Brazil, Chile, China, Colombia, Czech Republic, Egypt, Greece, Hungary, India, Indonesia, Korea, Malaysia, Mexico, Pakistan, Peru, the Philippines, Poland, Qatar, Russia, Saudi Arabia, South Africa, Taiwan, Thailand, Turkey, and the United Arab Emirates.
The MSCI World Index represents a free float–adjusted, market capitalization–weighted index that is designed to measure the equity market performance of developed markets. As of June 30, 2020, it includes 23 developed markets country indexes: Australia, Austria, Belgium, Canada, Denmark, Finland, France, Germany, Hong Kong, Ireland, Israel, Italy, Japan, the Netherlands, New Zealand, Norway, Portugal, Singapore, Spain, Sweden, Switzerland, the United Kingdom, and the United States.
Footnotes