In the first six months of 2019, in USD terms, the Cambridge Associates LLC Developed Markets ex US Private Equity and Venture Capital (PE/VC) Index returned 9.7%, following strong performance in both the first and second quarters (3.6% and 5.9%, respectively). The Cambridge Associates LLC Emerging Markets Private Equity and Venture Capital Index earned 5.8%, with a much stronger first quarter than second (4.3% and 1.4%, respectively). Because the indexes’ returns are measured in US dollars, the currency’s value vis-à-vis the euro impacts performance. During first quarter 2019, the US dollar strengthened, which hurt the return in USD terms, while the dollar weakened by the end of second quarter, boosting performance measured in USD terms (Figure 1). The developed and emerging markets PE/VC indexes have outperformed their public market counterparts across time (based on modified public market equivalent [mPME] returns).
First Half 2019 Highlights
- Except for first half 2019, the developed ex US and emerging markets PE/VC indexes outperformed the comparable public equity indexes (MSCI EAFE and Emerging Markets Indexes), based on mPME returns, for all time periods ending June 30, 2019, listed in Figure 1. The emerging markets PE/VC index has had slightly less success against the MSCI All Country World Index, equaling or outperforming in all but two time periods (first half 2019 and three years ending June 2019).
- Based on market values at June 30, 2019, public companies accounted for more than 7% of the developed markets PE/VC index and about 18% of the emerging markets PE/VC index.
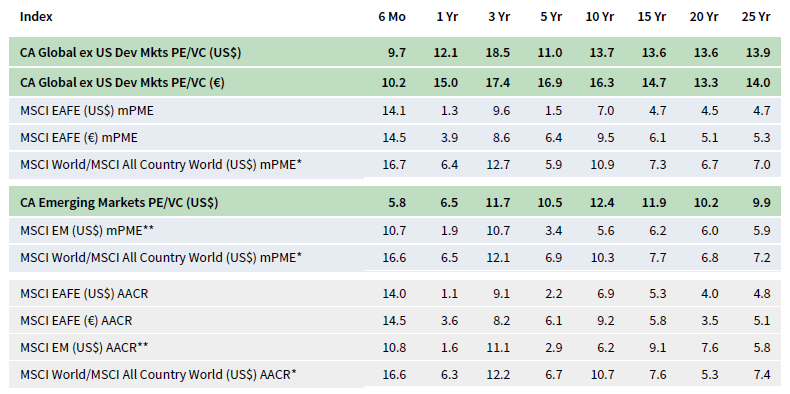
FIGURE 1 GLOBAL EX US PRIVATE EQUITY AND VENTURE CAPITAL INDEX RETURNS
Periods Ended June 30, 2019 • Percent (%)
* MSCI All Country World Constructed Index: Data from 1/1/1986 to 12/31/1987 represented by MSCI World Index gross total return. Data from 1/1/1988 to present represented by MSCI ACWI gross total return.
** MSCI EM Constructed Index: Data from 1/1/1986 to 12/31/1987 represented by GFD Emerging Markets price return. Data from 1/1/1988 to present represented by MSCI Emerging Markets total return gross.
Sources: Cambridge Associates LLC, Global Financial Data, Inc., MSCI Inc., and Thomson Reuters Datastream. MSCI data provided “as is” without any express or implied warranties.
Developed ex US Markets Private Equity and Venture Capital Performance Insights
Vintage Years
During the first six months of 2019, six of the eight meaningfully sized vintage years (those that represented at least 5% of the index’s value) earned positive double-digit returns; the two exceptions were vintages 2006 and 2007. Combined, the eight vintages accounted for more than 84% of the benchmark’s value (Figure 2) and returns ranged from 5.2% (2006) to 15.2% (2010) for the two-quarter period. Write-ups for consumer discretionary companies were by far the largest positive contributor to the 2006 and 2010 vintage years’ performance. The 2010 vintage’s return was dampened by write-downs in healthcare. In the largest vintage, 2012, write-ups were dominated by four of the large sectors, IT, healthcare, industrials, and consumer discretionary (in rank order).
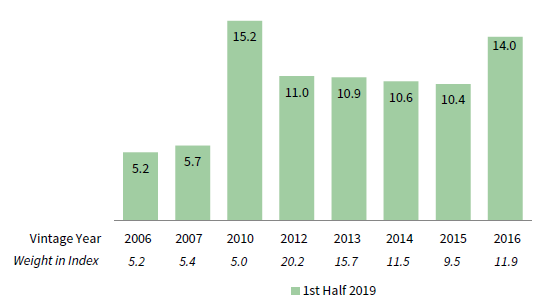
FIGURE 2 DEVELOPED MARKETS EX US PE/VC INDEX VINTAGE YEAR RETURNS:
NET FUND–LEVEL PERFORMANCE
As of June 30, 2019 • USD Terms • Percent (%)
Source: Cambridge Associates LLC.
Compared with the previous six-month period (July 2018 – December 2018), limited partner (LP) contribution and distribution amounts were both lower in first half 2019, more dramatically so for contributions than distributions (the same pattern of cash flows was seen from second half 2017 to first half 2018). Developed markets PE/VC funds called $13.4 billion from investors, a 34% drop, and distributions totaled $24.5 billion, a 16% decline. Distributions outpaced contributions in 31 of the 34 quarters since the beginning of 2011.
Managers of funds raised from 2013 to 2018 called $12.5 billion, or 94% of the total capital called during the first two quarters. Among those vintages, two, 2016 and 2017, called more than $3.0 billion. Six vintages, 2007–08 and 2010–13, each distributed at least $2.0 billion for a combined amount of $20.7 billion (84% of total distributions). The 2007 vintage year led the way, distributing almost $6 billion.
Sectors
Figure 3 shows the GICS sector breakdown of the Developed ex US Markets Private Equity and Venture Capital Index and a public market counterpart, the MSCI EAFE Index. The breakdown provides context when comparing the performance of the two indexes. The chart highlights fairly significant differences between the two indexes, including relative overweights in the PE/VC index in consumer discretionary, IT, healthcare, communication services, and industrials. The underweights include financials, consumer staples, and real assets (energy and real estate, which are part of the “other” category).
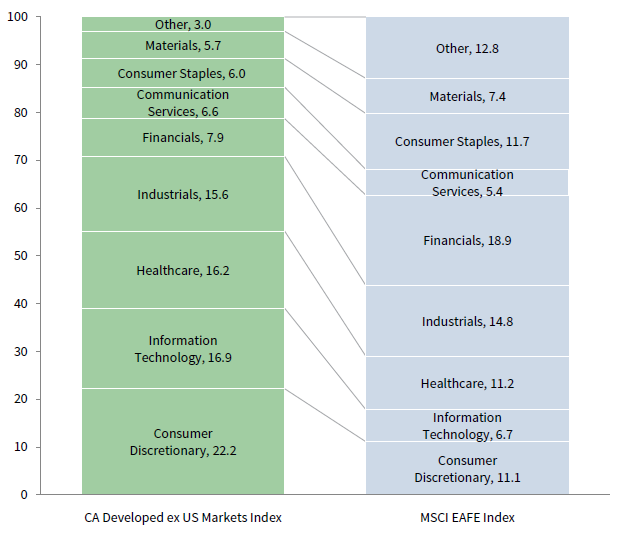
FIGURE 3 GICS SECTOR COMPARISONS: CA DEVELOPED MARKETS EX US PE/VC VS MSCI EAFE
As of June 30, 2019 • Percent (%)
Sources: Cambridge Associates LLC, FactSet Research Systems, and MSCI Inc. MSCI data provided “as is” without any express or implied warranties.
All eight meaningfully sized sectors earned positive returns for first half 2019 in both USD and euro terms, with performance in euros being the marginally stronger of the two (Figure 4). Among the key sectors, IT earned by far the highest return and communication services the lowest. No key vintage year suffered losses in the IT sector; the 2007 and 2012 vintages had the largest increases. The communication services sector return resulted from muted write-ups in most vintages and write-downs in the 2007 and 2010 groups. The four largest sectors—consumer discretionary, IT, healthcare, and industrials (in rank order)—represented 71% of the index’s value and, on a USD-weighted basis, returned 10.0%.
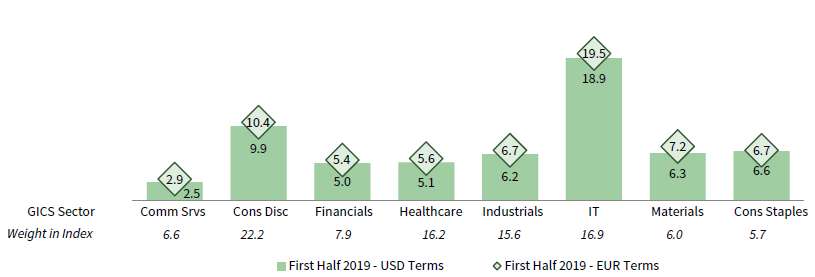
FIGURE 4 DEVELOPED MARKETS EX US PE/VC INDEX SECTOR RETURNS:
GROSS COMPANY–LEVEL PERFORMANCE
As of June 30, 2019 • Percent (%)
Source: Cambridge Associates LLC.
More than 90% of the capital invested by the managers in first half 2019 was allocated to consumer (discretionary and staples combined), IT, industrials, healthcare, and financials companies (in rank order). Over the long term, these sectors have attracted about 80% of invested capital; IT company investments account for nearly all the difference.
Countries
In USD terms, four of the seven meaningfully sized countries in the index (accounting for 72% of its value) posted double-digit positive returns during the first two quarters (Figure 5); as with the sectors, returns in euro terms were slightly higher. Companies based in the Netherlands (a top performer since the middle of 2017) were again the best performing, with three vintages, 2006, 2007, and 2013, contributing the most to returns. For French companies—the worst performers among the large countries—write-ups, highest in the 2007 and 2016 vintages, were partially offset by considerable write-downs in the 2010 vintage. For the six-month period, the gross dollar-weighted return for the three largest countries—the United States, the United Kingdom, and Germany—was 9.7%, about 100 basis points higher than the index’s total gross return.
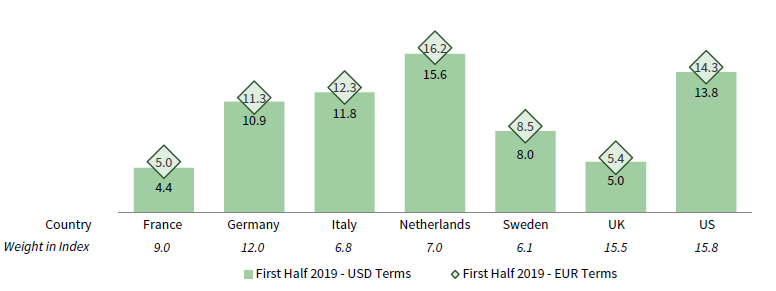
FIGURE 5 DEVELOPED MARKETS EX US PE/VC INDEX COUNTRY RETURNS:
GROSS COMPANY-LEVEL PERFORMANCE
As of June 30, 2019 • Percent (%)
Source: Cambridge Associates LLC.
Companies in developed European countries attracted 78% of the capital invested during the first two quarters, equaling the long-term norm for the region. Businesses in the United States garnered about 15% of the capital invested, which is a few percentage points higher than its long-term allocation.
Emerging Markets Private Equity and Venture Capital Performance Insights
Vintage Years
During the first six months, there were nine vintage years (2007, 2008, 2010–16) that accounted for at least 5% of the emerging markets index’s value; combined, the nine represented 87% of the index’s value (Figure 6). Eight of the nine vintages produced positive returns for first half 2019, contributing to solid year-to-date performance (5.8%). Performance varied among the large vintages, with returns ranging from -3.9% (2008) to 10.8% (2016).
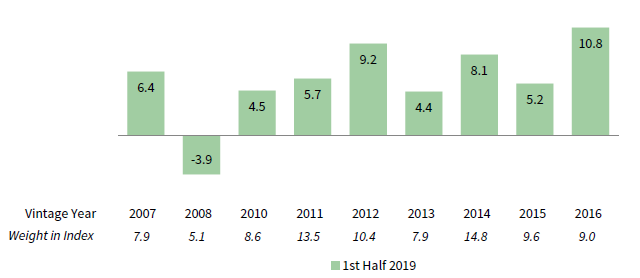
FIGURE 6 EMERGING MARKETS PE/VC INDEX VINTAGE YEAR RETURNS:
NET FUND-LEVEL PERFORMANCE
As of June 30, 2019 • USD Terms • Percent (%)
Source: Cambridge Associates LLC.
Write-ups in IT and materials were the main drivers for the best-performing vintage, 2016. The lowest-returning vintage, 2008, was impacted by write-offs in most sectors, but most notably IT. At the close of first half 2019, the largest vintage year was 2014, representing almost 15% of the index. It posted an 8.1% return, the second highest among the nine major vintages, and write-ups were widespread in first half 2019, most notably in consumer discretionary and IT. In 2018, this vintage also produced the best return, topping 34.6% for the calendar year.
During first half 2019, emerging markets PE/VC funds called $11.3 billion from investors, nearly a 25% decrease from the prior six-month period but slightly above the ten-year semi-annual average of $10.2 billion. Managers distributed just less than $10.5 billion year-to-date, matching the distribution total in the prior six-month period. Distributions were in the top ten of largest sums for any six-month period since the inception of the index in 1986—all ten occurred in the past six years. Since 1986, distributions have outpaced contributions in approximately 14% of the semi-annual periods, and in the past five years they have outpaced contributions in 30% of the semi-annual periods. Yet, in the past four years, distributions have outpaced contributions in only one first or second half-year period.
Managers of funds that were raised in 2015–18 called most of the capital in first half 2019, totaling almost $9.0 billion and about 80% of all capital called year-to-date. These four vintages, in the prime of their investment periods, called more than $1.3 billion each, and the 2016 vintage called the most at $4.1 billion. On the distributions front, managers with funds raised in four vintages (2007 and 2012–14) returned at least $1.0 billion to LPs, for a combined total of $6.4 billion, or 61% of the period’s total. Funds in the 2014 vintage, the largest vintage of those meaningfully sized, returned the most capital, topping $2.1 billion for first half 2019.
Sectors
Figure 7 shows the GICS sector breakdown of the Emerging Markets PE/VC Index and a public market counterpart, the MSCI Emerging Markets Index. The breakdown provides context when comparing the performance of the two indexes. The chart highlights the significant overweights in the PE/VC index, such as healthcare, consumer discretionary, and IT, with a more modest difference in industrials. Underweights are most significant in financials, with smaller underweights in energy and materials.
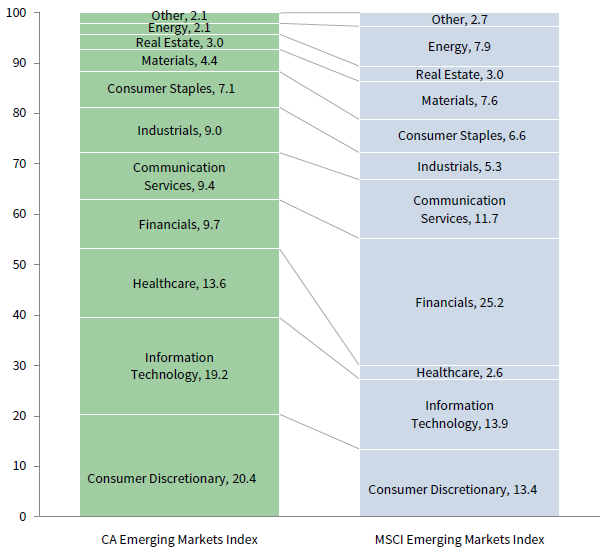
FIGURE 7 GICS SECTOR COMPARISONS: CA EMERGING MARKETS PE/VC VS MSCI
EMERGING MARKETS
As of June 30, 2019 • Percent (%)
Sources: Cambridge Associates LLC, FactSet Research Systems, and MSCI Inc. MSCI data provided “as is” without any express or implied warranties.
All seven of the meaningfully sized sectors posted positive first half returns (Figure 8). Consumer staples returned the best at 14.1% for the period, trailed closely by communication services, which returned 11.8%. In first half 2019, just shy of 70% of the consumer staples write-ups were attributed to investments made by funds formed in 2007 and 2011. The remaining five sectors experienced middling returns ranging from 2.6% (IT) to 6.8% (consumer discretionary). On a gross, dollar-weighted basis, the three largest sectors by market value—consumer discretionary, IT, and healthcare—returned 5.0% during first half 2019, underperforming the return for all companies by more than 180 basis points. The sectors outside of the three largest returned 9.0% during the same period.
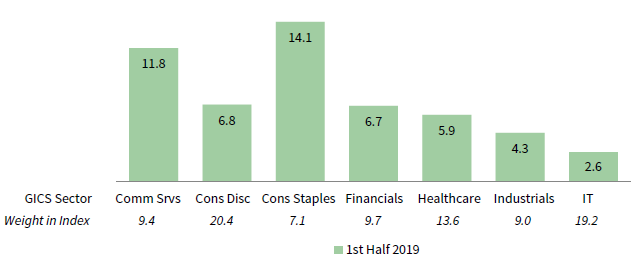
FIGURE 8 EMERGING MARKETS PE/VC INDEX SECTOR RETURNS:
GROSS COMPANY-LEVEL PERFORMANCE
As of June 30, 2019 • USD Terms • Percent (%)
Source: Cambridge Associates LLC.
Compared with second half 2018, the investment pace in this period was slightly slower (a decrease of about 20%). Companies across five sectors (in rank order: consumer discretionary, healthcare, industrials, financials, and consumer staples) garnered 73% of the capital invested in the first six months of 2019, with consumer discretionary, healthcare, and industrials alone attracting more than 53% of all capital. Over the long term, managers in the emerging markets index have allocated 43% of their capital to these three sectors, with consumer discretionary accounting for the biggest difference between the current six months (25%) and the long-term norm (21%). Notably, investment into IT companies was slow in the first six months, with companies attracting only 9% of the total invested capital, compared to the long-term norm of 13%. Since 2016, IT has attracted at or above the long-term average.
Countries
Highlighting the index’s geographic concentration, China remains, by far, the largest country component of the index (Figure 9). India and South Korea continue as constituents in the meaningfully sized group, and the United States is a new and growing addition as of 2018, composing 6.5% of the index. Five other countries—Australia, Brazil, Hong Kong, Japan, and Singapore—represented between 2.1% and 4.0% of the index.

FIGURE 9 EMERGING MARKETS PE/VC INDEX COUNTRY RETURNS:
GROSS COMPANY-LEVEL PERFORMANCE
As of June 30, 2019 • USD Terms • Percent (%)
Source: Cambridge Associates LLC.
China-based companies again received more capital than any other country, 33% of invested capital. India attracted the second-highest amount of capital year-to-date, roughly 11% of all invested capital, with Japan following close behind at 10% of all invested capital. Japan marks the biggest increase in invested capital this period compared to the long-term average of 4%, and China saw a slight decrease over the 36% long-term average.
On a gross dollar-weighted basis, when combined, companies based in China, India, South Korea, and the United States returned 7.4%, beating out the full index by less than 100 basis points in first half 2019.
Caryn Slotsky, Senior Investment Director
Sarah Grifferty, Senior Investment Associate
Wyatt Yasinski, Investment Associate
Figure Notes
Private equity includes only buyout and growth equity funds.
Global ex US Private Equity and Venture Capital Index Returns
The PE/VC indexes are pooled horizon internal rates of return and are based on limited partners’ fund-level performance; the returns are net of fees, expenses, and carried interest. Because the indexes are capitalization weighted, performance is mainly driven by the largest vintage years.
Public index returns are shown as both time-weighted returns (average annual compound returns) and dollar-weighted returns (modified public market equivalent). Returns are annualized, with the exception of returns less than one year, which are cumulative. The CA mPME replicates private investment performance under public market conditions. The public index’s shares are purchased and sold according to the private fund cash flow schedule, with distributions calculated in the same proportion as the private fund, and mPME net asset value is a function of mPME cash flows and public index returns.
Vintage Year Returns
Vintage year fund-level returns are net of fees, expenses, and carried interest.
Sector Returns
Industry-specific gross company-level returns are before fees, expenses, and carried interest.
Country Returns
Industry-specific gross company-level returns are before fees, expenses, and carried interest.
GICS Sector Comparisons
The Global Industry Classification Standard (GICS®) was developed by and is the exclusive property and a service mark of MSCI Inc. and S&P Global Market Intelligence LLC and is licensed for use by Cambridge Associates. Other includes sectors that make up less than 3% of the CA benchmark.
About the Cambridge Associates LLC Indexes
Cambridge Associates derives its Global ex US Developed Markets Private Equity and Venture Capital Index from the financial information contained in its proprietary database of global ex US private equity and venture capital funds. As of June 30, 2019, the database comprised 839 global ex US developed markets buyouts, growth equity, and venture capital funds formed from 1986 to 2019 with a value of about $266 billion. Ten years ago, as of June 30, 2009, the benchmark index included 535 global ex US developed markets funds, whose value was roughly $144 billion. The funds in this index invest primarily in developed markets in Australia, Canada, Israel, Japan, New Zealand, Singapore, and Western Europe.
Cambridge Associates derives its Emerging Markets Private Equity and Venture Capital Index from the financial information contained in its proprietary database of global ex US buyouts, growth equity, and venture capital funds. As of June 30, 2019, the database comprised 674 emerging markets private equity and venture capital funds formed from 1986 to 2019 with a value of about $244 billion. Ten years ago, as of June 30, 2009, the benchmark index included 387 emerging markets funds, whose value was about $50 billion. The funds in this index invest primarily in Africa, emerging Asia, emerging Europe, Latin America & Caribbean, and the Middle East ex Israel.
The pooled returns represent the net periodic rates of return calculated on the aggregate of all cash flows and market values as reported to Cambridge Associates by the funds’ general partners in their quarterly and annual audited financial reports. These returns are net of management fees, expenses, and performance fees that take the form of carried interest.
About the Public Indexes
The MSCI All Country World Index (ACWI) is a free float–adjusted, market capitalization–weighted index designed to measure the equity market performance of developed and emerging markets. As of June 30, 2019, the MSCI ACWI consisted of 49 country indexes comprising 23 developed and 26 emerging markets country indexes. The developed markets country indexes included are: Australia, Austria, Belgium, Canada, Denmark, Finland, France, Germany, Hong Kong, Ireland, Israel, Italy, Japan, the Netherlands, New Zealand, Norway, Portugal, Singapore, Spain, Sweden, Switzerland, the United Kingdom, and the United States. The emerging markets country indexes included are: Argentina, Brazil, Chile, China, Colombia, Czech Republic, Egypt, Greece, Hungary, India, Indonesia, Korea, Malaysia, Mexico, Pakistan, Peru, the Philippines, Poland, Qatar, Russia, Saudi Arabia, South Africa, Taiwan, Thailand, Turkey, and the United Arab Emirates.
The MSCI EAFE Index is a free float–adjusted, market capitalization–weighted index that is designed to measure large- and mid-cap equity performance of developed markets, excluding Canada and the United States. As of June 30, 2019, the MSCI EAFE Index consisted of the following 21 developed markets country indexes: Australia, Austria, Belgium, Denmark, Finland, France, Germany, Hong Kong, Ireland, Israel, Italy, Japan, the Netherlands, New Zealand, Norway, Portugal, Singapore, Spain, Sweden, Switzerland, and the United Kingdom.
The MSCI Emerging Markets Index is a free float–adjusted, market capitalization–weighted index that is designed to measure large- and mid-cap equity performance of emerging markets. As of June 30, 2019, the MSCI Emerging Markets Index included 26 emerging markets country indexes: Argentina, Brazil, Chile, China, Colombia, Czech Republic, Egypt, Greece, Hungary, India, Indonesia, Korea, Malaysia, Mexico, Pakistan, Peru, the Philippines, Poland, Qatar, Russia, Saudi Arabia, South Africa, Taiwan, Thailand, Turkey, and the United Arab Emirates.
The MSCI World Index represents a free float–adjusted, market capitalization–weighted index that is designed to measure the equity market performance of developed markets. As of June 30, 2019, it included 23 developed markets country indexes: Australia, Austria, Belgium, Canada, Denmark, Finland, France, Germany, Hong Kong, Ireland, Israel, Italy, Japan, the Netherlands, New Zealand, Norway, Portugal, Singapore, Spain, Sweden, Switzerland, the United Kingdom, and the United States.