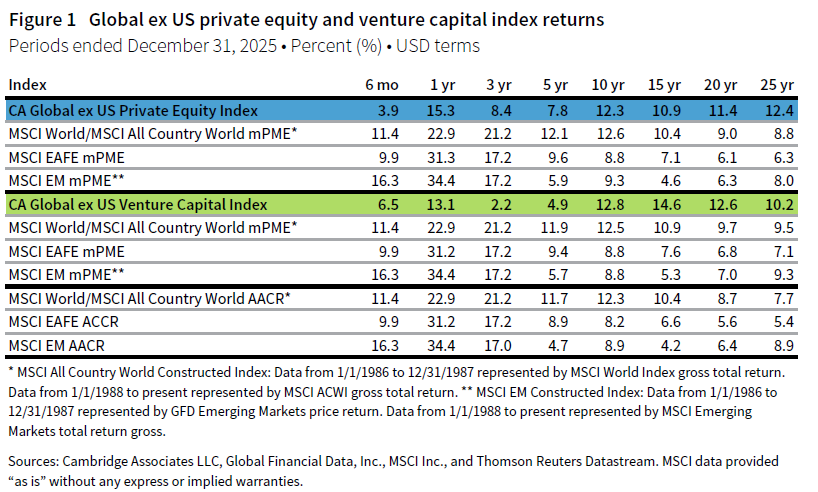
Calendar year 2025 marked a recovery for private equity and venture capital (PE/VC) in global ex US markets after three consecutive years of weak returns. The Cambridge Associates LLC Global ex US Private Equity Index returned 15.3% and the Cambridge Associates Global ex US Venture Capital Index earned 13.1%, both in USD terms. With a significantly weaker US dollar, returns were considerably lower when measured in euros; the PE index earned 1.5% and the VC index fell 0.3%. Public markets continued to outperform during the year, and their sustained strength is, for some, now calling into question the long-term value proposition of PE/VC.
Calendar year 2025 highlights
- The global ex US PE index outpaced its VC counterpart, though both private benchmarks trailed public markets. Younger vintage years generally delivered stronger results than more mature funds, while returns by sector and geography were mixed.
- Historically, the VC index has had a larger exposure to public companies, a trend that held in 2025. Based on market values as of December 31, 2025, public companies accounted for about 12% of the global ex US VC index and about 8% the global ex US PE index.
Global ex US private equity performance insights
For the global ex US PE index, 2025 marked a return to stronger performance after three consecutive weak years, though private equity still fell short of public market returns (Figure 1). The US dollar weakened considerably in 2025 as the new administration favored a softer currency to support domestic exports. As a result, the euro appreciated by more than 10% against the US dollar over the year, making returns meaningfully lower in EUR terms. Returns were positive across all vintage years, with less-mature funds modestly outpacing older ones. Distributions rose to their second-highest level on record yet remained low relative to the overall size of the index. Contributions continued to decline amid a slow fundraising environment and investment pace. Sector returns were all positive, led by financials, IT, and industrials. At the country level, Germany earned the strongest return, driven in part by an outsized exposure to industrials. US-domiciled companies continued to attract the largest share of capital inflows.
According to Pitchbook, 155 global ex US PE-backed companies went public in 2025 with a total valuation of around $177 billion. Buyouts (sponsor to sponsor) totaled 860 transactions, or $213 billion, while mergers & acquisitions (M&As) (sponsor to strategic) totaled 1,273, or $183 billion. When measured by value, exit activity across all three transaction types was slightly higher from the prior year but remained meaningfully below the 2021 peak.
Vintage years
Returns for key vintage years (those that represented at least 5% of the index’s value) in the global ex US PE index varied by fund age, with more recent funds earning slightly better returns than their older counterparts, whose remaining market value has been trapped for a long time (Figure 2). The youngest vintage year (2023) posted the best calendar-year return, but the largest vintage year (2021) was a close second. Currency was a meaningful tailwind for returns when measured in USD terms, as the dollar weakened considerably, particularly in the first half of the year.
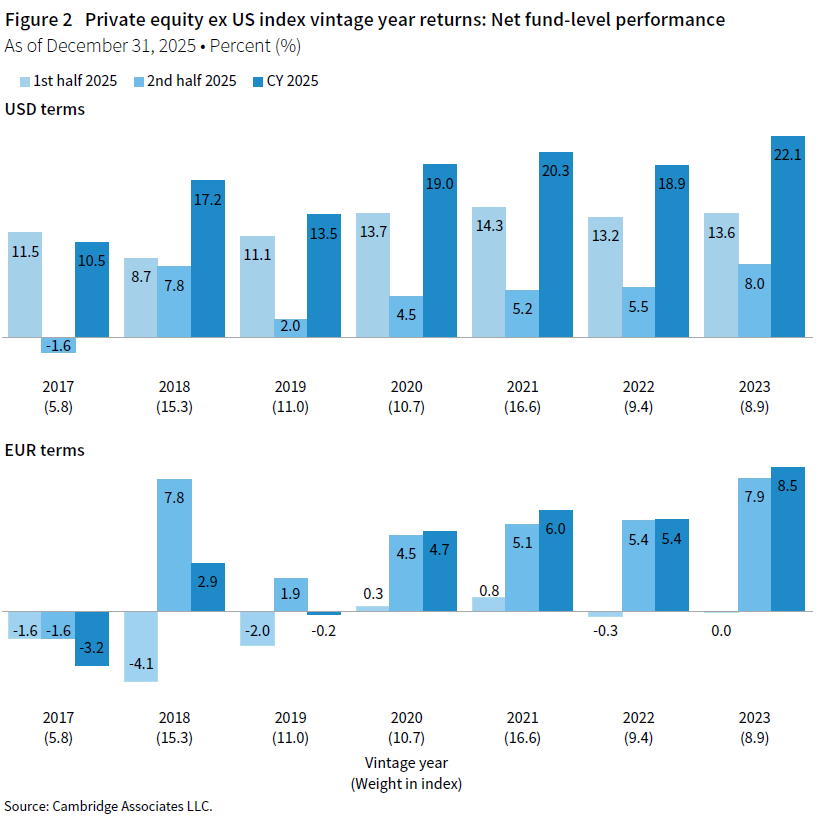
As a percentage of net asset value (NAV), the 2021 vintage remained the largest, and the key vintages (2017–23) combined represented almost 80% of the index’s value and returned about 18% in USD terms and 4% in EUR terms. While a variety of sectors influenced vintage year returns during the year, healthcare, industrials, and IT generally had the largest impacts, given their size within the index. Financials and consumer discretionary also contributed meaningfully. The worst-performing vintage year (2017), which still earned more than 10% during the year, was dragged down by investments in consumer staples.
LP cash flows
Distributions increased to more than $92 billion in 2025—their second highest level—while contributions decreased to $67 billion, their lowest year since 2019 (Figure 3). The exit market picked up in 2025, but distributions remained slow relative to the amount of capital in private equity. Exit activity was expected to accelerate further in 2026, but geopolitical stress and artificial intelligence (AI) disruption in software has caused some pause. As the distribution drought has persisted over the last four years, managers have had a hard time fundraising (2025 being especially low) and therefore the investment pace has also slowed.
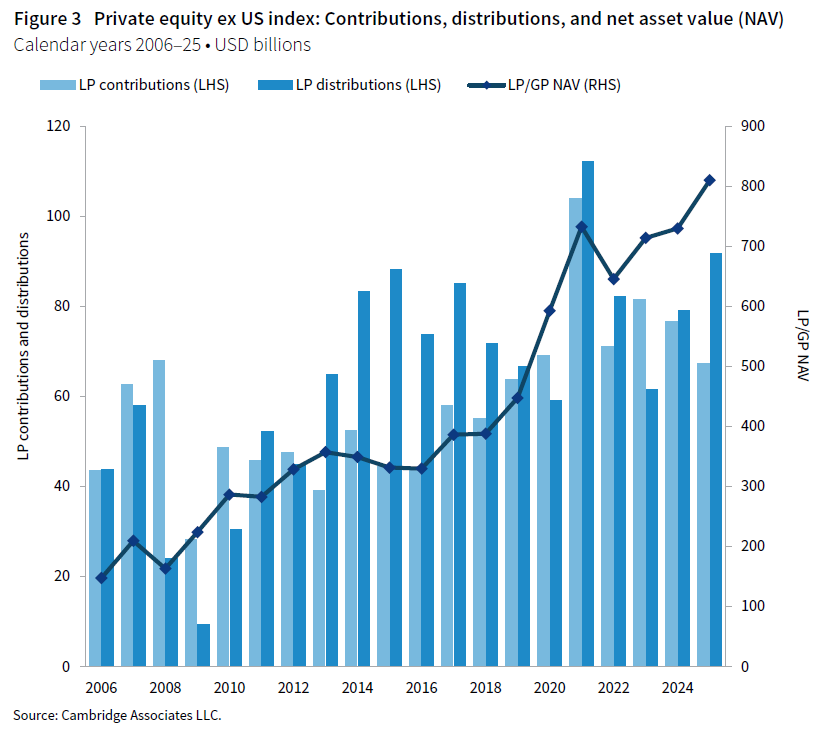
Combined, funds from vintages 2022–24 called more than $50 billion during the year, or 75% of all contributions. On the distribution side, funds from 2018 returned by far the most capital for the second year in a row—almost $22 billion, more than double the next highest vintage (2019). As companies stay private longer and hold periods extend, older funds have increasingly contributed a larger share of overall distributions; vintages 2014–17 accounted for 36% of all capital returned to limited partners (LPs).
Sectors
Figure 4 shows the Global Industry Classification Standard (GICS®) sector breakdown of the global ex US PE index and a public market counterpart, the MSCI ACWI ex US Index. The chart illustrates differences in sector exposures that help explain relative performance. The PE index has considerably less exposure to financials and more to healthcare, industrials, consumer discretionary, and IT.
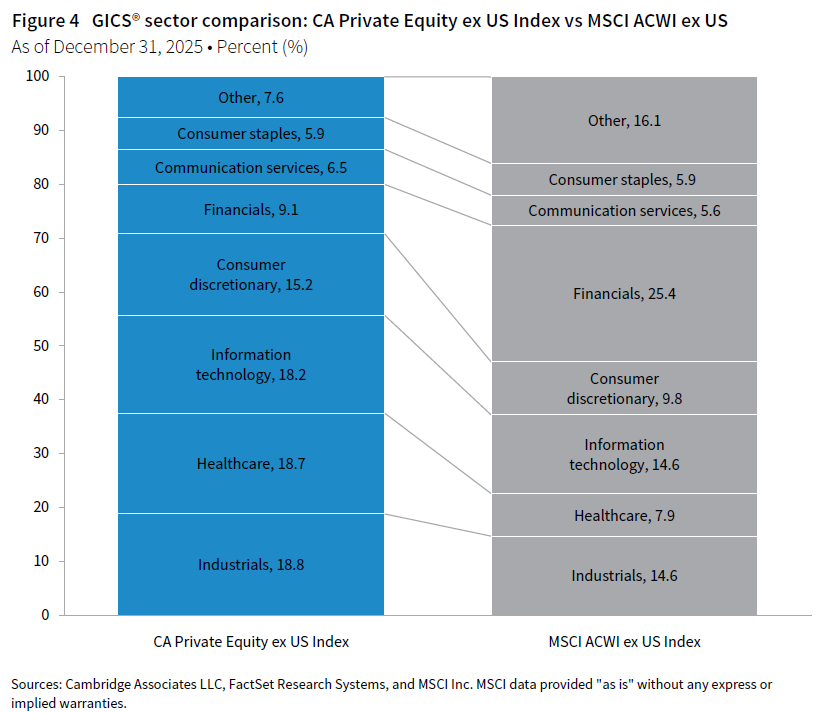
Every meaningfully sized sector earned a positive return in 2025, with financials, IT, and industrials posting the strongest results (in rank order). IT has been a persistently strong performer in private equity, while industrials has gained more recent momentum amid rising defense spending and the infrastructure buildout related to AI. Collectively, the key sectors posted a pooled gross return of 13% in USD terms and 0% in EUR terms—underscoring just how significant currency impact was during the year (Figure 5).
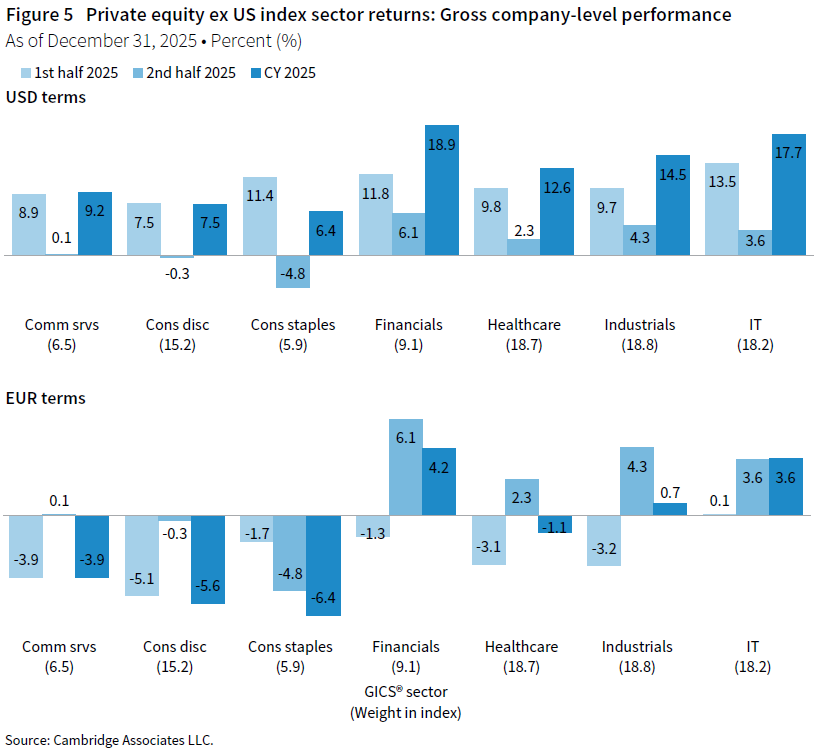
From a capital deployment perspective, IT, healthcare, and industrials attracted the most investment in 2025, accounting for nearly 60% of all contributions. IT took in roughly 5% more than its weight in the index, while the other two were on par with their respective shares. As in the public markets, the IT sector has shifted away from legacy software and begun deploying significant capital into AI-native and AI-enabled businesses, a trend that is only accelerating in 2026. For the second consecutive year, consumer discretionary took in less than its proportional share (9% versus a 15% weight in the index). Discretionary spending has been down meaningfully since its pandemic-era peak, when fiscal stimulus injected excess capital into the global economy.
Countries
The largest countries in the global ex US PE index all posted positive returns during the year, with Germany, France, and the United Kingdom standing out as the strongest performers (Figure 6). Germany earned the highest return at 25%, driven largely by outsized exposure to industrials, a sector that performed particularly well during the year. The weakest return came from US-based investments (1.6%), as newly imposed tariffs re-oriented global markets from a geographical perspective. China also delivered a lower relative return as its economy struggled with deflation and decreasing consumer spending. Combined, the pooled gross return for all five countries was 11% in USD terms and 0% in euros.
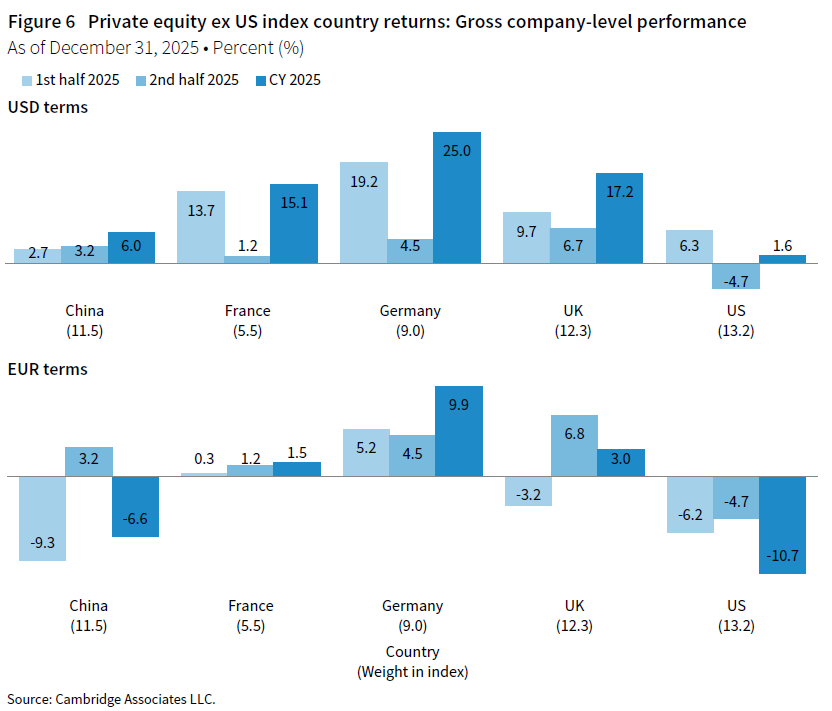
Despite the global ex US PE benchmark excluding US-based funds—and despite poor returns from US-based companies—those companies still received the most capital (16%) during the year. Germany earned the second spot at 10%, followed by the United Kingdom. Investment into Asia has historically been driven by China, but that trend has shifted in recent years as more capital has flowed into other countries in the region, notably Japan and India.
Global ex US venture capital performance insights
Calendar year 2025 marked the beginning of a recovery for the global ex US VC index following three consecutive years of negative returns. Still, the VC index meaningfully underperformed its public market counterparts and modestly trailed its PE counterpart (Figure 1). The US dollar weakened over the year, so returns were considerably stronger when calculated in USD terms compared to EUR terms. From a vintage year perspective, less-mature funds generally outperformed older ones, though older funds had an outsized impact on distributions. Overall distributions picked up in dollar terms but remained low when measured against the unrealized value at the start of the year. Contributions increased for a second consecutive year, driven by growing investment in AI. Returns by sector varied, and the best performers were driven by a notably small number of companies. Country-specific returns were also mixed, and capital inflows into China were slow relative to long-term averages.
According to Pitchbook, 306 global ex US VC-backed companies went public in 2025 with a total valuation of around $170 billion. Buyouts (sponsor to sponsor) totaled 381 transactions, or $30 billion, while M&As (sponsor to strategic) totaled 1,389, or $81 billion. Exit activity across all three transaction types improved slightly from the prior year but remained meaningfully below the peak in 2021.
Vintage years
As of December 31, 2025, the nine meaningfully sized vintages in the global ex US VC index together accounted for 84% of the index’s NAV (Figure 7). Returns generally ranged by fund age, with newer vintages outperforming older ones—the notable exception being 2014. The youngest vintage (2022) posted the best calendar-year return at more than 24%, while the weakest performer (2016) earned less than 4%. Combined, the key vintages earned a pooled return of 12% in USD terms but a negative 2% in EUR terms.
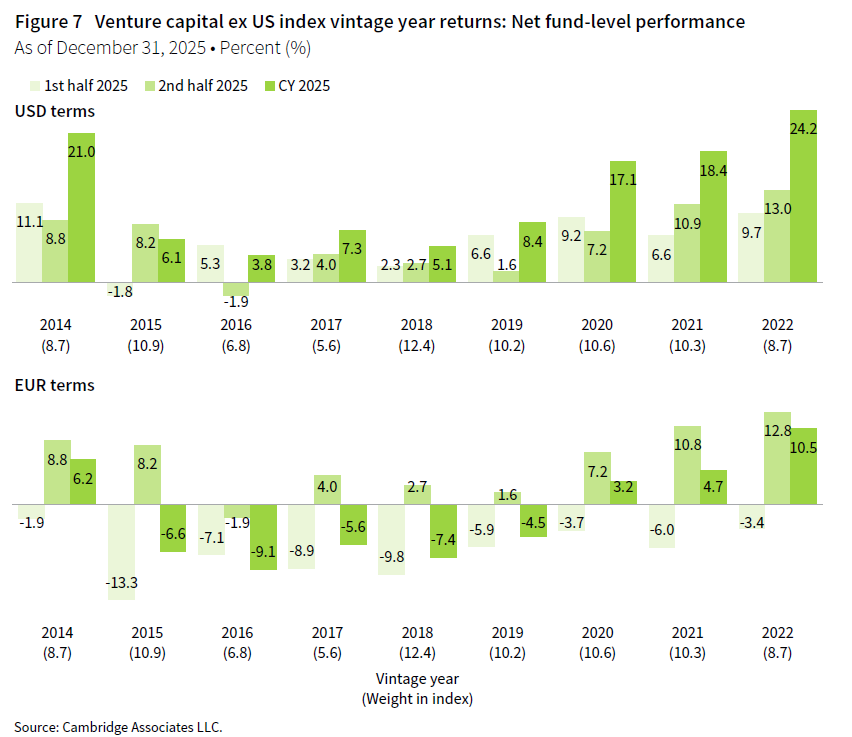
Investments in IT—the largest sector—were the primary driver of positive performance across most key vintage years, with a particularly outsized contribution to the 2014 vintage. Funds from the worst-performing vintage (2016) were the one exception. Healthcare also contributed positively across all vintage years, while communication services and both consumer discretionary and consumer staples were more of a mixed bag. The newest funds from 2021 and 2022 experienced positive performance across the board from a sector perspective.
LP cash flows
There was a meaningful increase in distributions for global ex US VC funds on an absolute basis in 2025, but like private equity, the level remained low relative to the size of the market (Figure 8). The distribution yield (distributions divided by beginning NAV) has now stayed below long-term averages for four consecutive years, which in turn has weighed on fundraising activity. However, contributions rose from the prior year to $10 billion, and the investment pace is expected to continue accelerating as AI has driven considerable interest from VC firms.
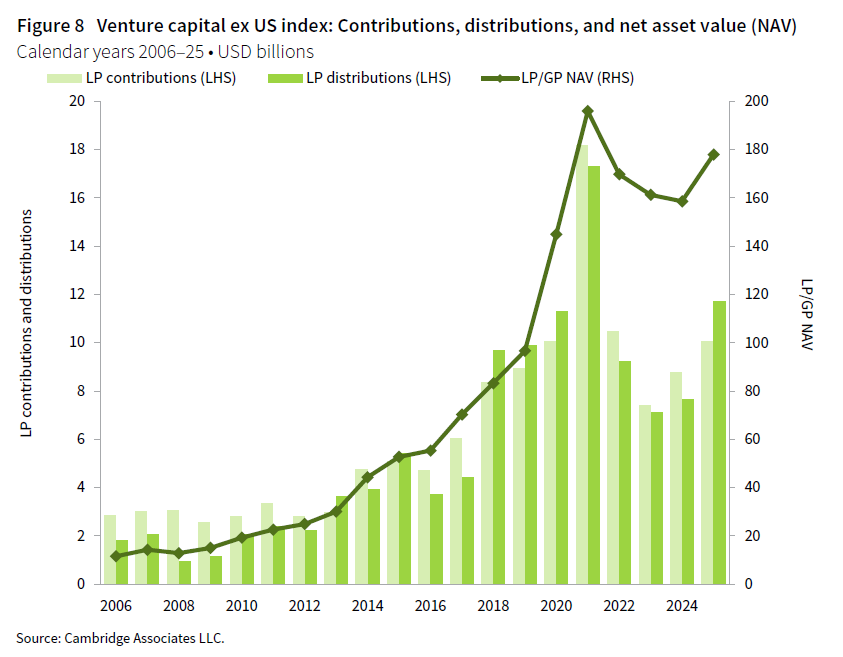
Nearly 60% of capital calls in 2025 came from just two vintage years, 2021 and 2022, which was consistent with the prior year. The 2021 vintage deployed capital quickly into highly valued software companies, but many still entered the year with meaningful dry powder and are now looking to rebalance into AI. Distributions were more evenly spread across vintage years, though older funds from 2014–16 accounted for the most (more than 50% combined). As with private equity, longer hold periods have meant more capital is being distributed by older funds—those formed between 2006 and 2013 returned close to $1.5 billion during the year.
Sectors
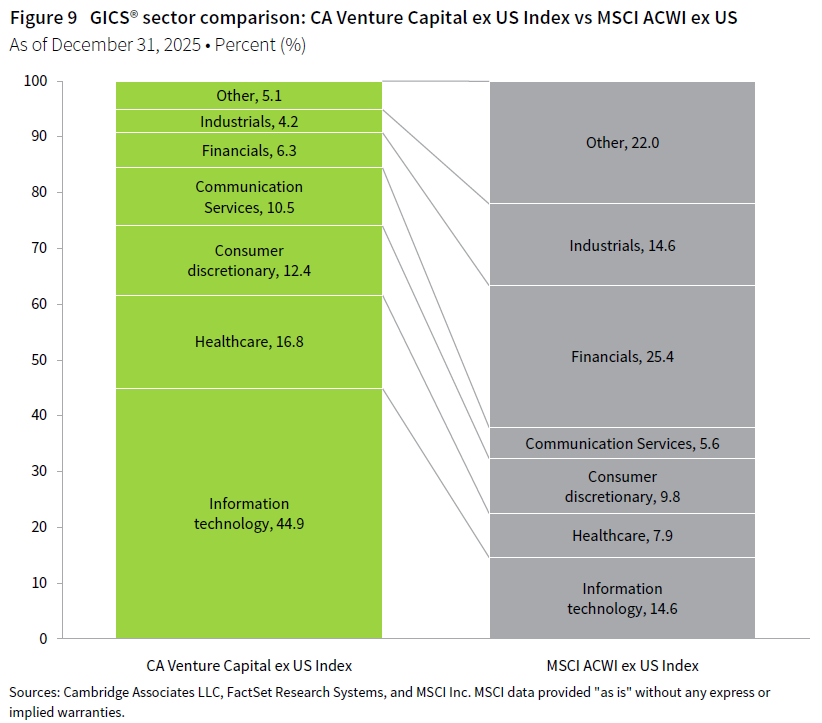
Figure 9 shows the GICS® sector breakdown of the global ex US VC index and a public market counterpart, the MSCI ACWI ex US Index. The comparison highlights significant overweights in the global ex US VC index in IT and healthcare, with smaller overweights in consumer discretionary and communication services. The most notable private market underweights are in financials and industrials, as well as in consumer staples and materials (both of which are included in the “other” category).
All five of the meaningfully weighted sectors posted positive returns in USD terms during 2025, though results were more mixed when measured in euros (Figure 10). Communication services and IT were the clear standouts, gaining 46% and 23%, respectively, although the return contribution was highly concentrated among a narrow set of companies. Consumer discretionary was the weakest performer, returning just 5.1% in USD terms and -7.4% in EUR terms. Consumer spending has remained subdued across much of the world, particularly in China, the largest country in the index. Collectively, the key sectors posted a pooled gross return of 20% in USD terms and 6% in EUR terms.
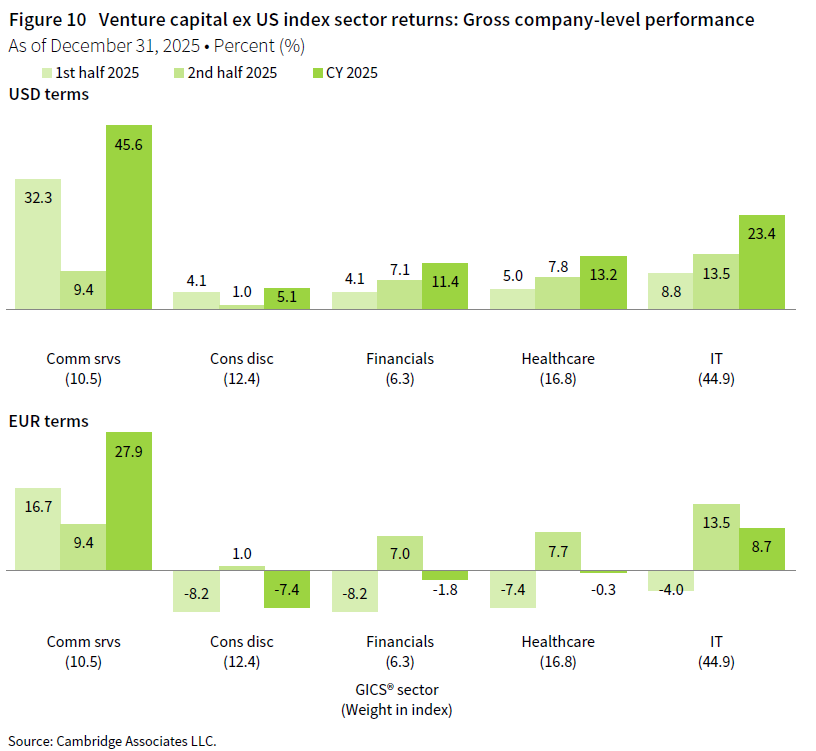
Companies in IT and healthcare alone accounted for 72% of the capital invested during 2025. IT’s share, at 37%, was below its weight in the index, while healthcare’s share of 35% was well above. Healthcare investment in venture capital—both in and outside the United States—continues to be largely driven by biotechnology and life sciences. IT will likely capture a greater share of investment in 2026, given the surging interest in AI.
Countries
As of the end of 2025, weights for the six meaningfully weighted countries in the global ex US VC index ranged from China’s 27% to Ireland’s 5%, and these six countries combined accounted for about 75% of the total benchmark (Figure 11). For the second consecutive year, the United Kingdom posted the best return of the group at 36%, though performance was concentrated. Germany and China also did well—a notable reversal for China, which was the worst-performing country in 2024. India, conversely, was the weakest performer in 2025 at -2.0% in USD terms and -13.6% in EUR terms after being one of the stronger performers in the prior year. When combined, the six largest countries earned 21% on a gross pooled basis in USD terms and 6% when measured in euros.
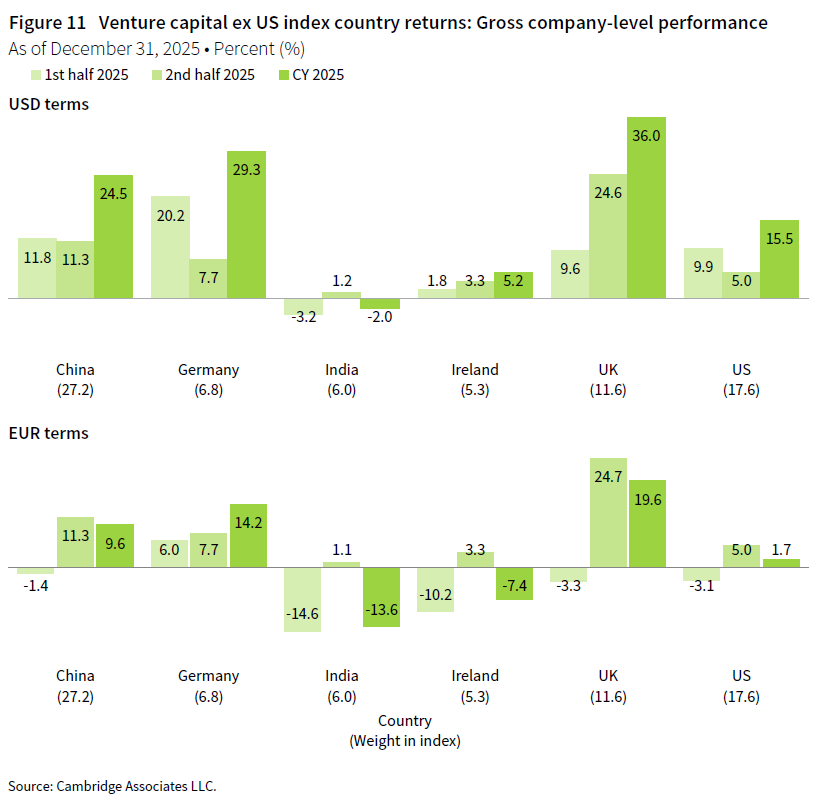
Despite the return profiles for Asian countries in 2025, the multi-year trend of more capital flowing into India and less into China continued. China received just 16% of invested capital during the year, well below the 27% it has garnered since the inception of the benchmark. India, on the other hand, received 12%—more than double its long-term average of 5%. Germany was the other notable country to outpace its historical norm, while the United Kingdom and the United States were right in line with long-term averages.
Caryn Slotsky, Managing Director, PI Strategy Research
Drew Carneal, Investment Director, PI Strategy Research
Adam Sample, Senior Investment Associate, PI Strategy Research
Figure notes
Private equity includes only buyout and growth equity funds.
Global ex US private equity and venture capital index returns
The PE/VC indexes are pooled horizon internal rates of return and are based on limited partners’ fund-level performance; the returns are net of fees, expenses, and carried interest. Because the indexes are capitalization weighted, performance is mainly driven by the largest vintage years.
Public index returns are shown as both time-weighted returns (average annual compound returns) and dollar-weighted returns (modified public market equivalent). Returns are annualized, with the exception of returns less than one year, which are cumulative. The CA mPME replicates private investment performance under public market conditions. The public index’s shares are purchased and sold according to the private fund cash flow schedule, with distributions calculated in the same proportion as the private fund, and mPME net asset value is a function of mPME cash flows and public index returns.
Vintage year returns
Vintage year fund-level returns are net of fees, expenses, and carried interest.
Sector returns
Industry-specific gross company-level returns are before fees, expenses, and carried interest.
Country returns
Industry-specific gross company-level returns are before fees, expenses, and carried interest.
GICS® sector comparisons
The Global Industry Classification Standard (GICS®) was developed by and is the exclusive property and a service mark of MSCI Inc. and S&P Global Market Intelligence LLC and is licensed for use by Cambridge Associates. Other includes sectors that make up less than 3% of the CA benchmark.
About the Cambridge Associates LLC indexes
Cambridge Associates derives its global ex US private equity and venture capital indexes from the financial information contained in its proprietary database of funds based outside the United States. Those funds can still invest inside the United States, which explains the US exposure within both indexes. As of December 31, 2025, the database consisted 1,279 PE funds formed from 1987 to 2025 with a value of about $810 billion. Ten years ago, as of December 31, 2015, the index included 899 PE funds with a value of about $332 billion. As of December 31, 2025, the database comprised 764 VC funds formed from 1986 to 2025 with a value of about $178 billion. Ten years ago, as of December 31, 2015, the index included 398 VC funds with a value of about $53 billion.
The pooled returns represent the net periodic rates of return calculated on the aggregate of all cash flows and market values as reported to Cambridge Associates by the funds’ general partners in their quarterly and annual audited financial reports. These returns are net of management fees, expenses, and performance fees that take the form of carried interest.
About the public indexes
The MSCI ACWI ex US Index captures large- and mid-cap representation across 22 of 23 developed markets (DM) and 24 emerging markets (EM) countries. With 1,981 constituents, the index covers approximately 85% of the global equity opportunity set outside the United States. DM countries include Australia, Austria, Belgium, Canada, Denmark, Finland, France, Germany, Hong Kong, Ireland, Israel, Italy, Japan, the Netherlands, New Zealand, Norway, Portugal, Singapore, Spain, Sweden, Switzerland, and the United Kingdom. EM countries include Brazil, Chile, China, Colombia, Czech Republic, Egypt, Greece, Hungary, India, Indonesia, Korea, Kuwait, Malaysia, Mexico, Peru, the Philippines, Poland, Qatar, Saudi Arabia, South Africa, Taiwan, Thailand, Turkey, and the United Arab Emirates.
The MSCI EAFE Index is a free float–adjusted, market capitalization–weighted index that is designed to measure large- and mid-cap equity performance of developed markets, excluding Canada and the United States. As of December 31, 2025, the MSCI EAFE Index consisted of the following 21 DM country indexes: Australia, Austria, Belgium, Denmark, Finland, France, Germany, Hong Kong, Ireland, Israel, Italy, Japan, the Netherlands, New Zealand, Norway, Portugal, Singapore, Spain, Sweden, Switzerland, and the United Kingdom.
The MSCI Emerging Markets Index is a free float–adjusted, market capitalization–weighted index that is designed to measure large- and mid-cap equity performance of emerging markets. As of December 31, 2025, the MSCI Emerging Markets Index included 24 EM country indexes: Brazil, Chile, China, Colombia, Czech Republic, Egypt, Greece, Hungary, India, Indonesia, Korea, Kuwait, Malaysia, Mexico, Peru, the Philippines, Poland, Qatar, Saudi Arabia, South Africa, Taiwan, Thailand, Turkey, and the United Arab Emirates.