In 2023, the Cambridge Associates LLC Developed Markets ex US Private Equity and Venture Capital (PE/VC) Index earned 7.0% in USD terms. While the positive return was an encouraging sign of recovery from 2022, the index underperformed its public counterpart (MSCI EAFE Index). The PE/VC index’s return was worse in euro terms (3.4%) because the currency strengthened against the US dollar during the year (Figure 1). The Cambridge Associates LLC Emerging Markets Private Equity and Venture Capital Index, which earned 1.6% in 2023, also underperformed its public counterpart, the MSCI Emerging Markets Index. Beyond the short term, both private indexes have typically done better than public markets based on modified public market equivalent (mPME) returns.[1]Cambridge Associates’ mPME calculation is a private-to-public comparison that seeks to replicate private investment performance under public market conditions. The contrast between public and private market returns in 2023 is common during recovery years, when valuations for private investments (PI) take longer to reflect improvements in economic conditions. Inflation decreased from peak levels in 2022 across much of the world, and the expectation of interest rate cuts and enthusiasm about artificial intelligence helped buoy financial markets.
Calendar Year 2023 Highlights
- The developed markets ex US PE/VC index recovered well in 2023 but significantly underperformed the comparable public benchmark (MSCI EAFE Index). The emerging markets index did worse than the developed benchmark and its public market peer (the MSCI Emerging Markets Index). Still, both private indexes outperformed their public counterparts in most time periods listed in Figure 1.
- Public company exposures shifted slightly from 2022; in the developed markets, it rose one percentage point to 5%, and in the emerging markets, it fell one percentage point to 17%.
- All sectors earned positive returns in the developed markets, while performance was weaker and more varied in the emerging markets. In both indexes, newer vintage years did better than older ones, and funds generally performed better in the first half of the year than the second. Country-specific returns were mixed in both indexes.

Developed Markets ex US Private Equity and Venture Capital Performance Insights
For the developed markets ex US PE/VC index, calendar year 2023 was marked by a modest recovery from the prior year, a notable underperformance relative to public markets, and a lack of distributions. Investor sentiment improved as inflation subsided, but valuations and deal activity in PI were slow to respond. All meaningfully sized vintage years had positive returns for the year, but younger funds fared better than more mature ones. Sector exposures remained consistent from the end of 2022, and investments in communication services, industrials, and financials all earned double-digit returns. The two largest countries by capital weight (the United States and the United Kingdom) underperformed smaller countries in the index, including Italy and Sweden. The MSCI EAFE earned more than 18% for the year, about 2.5x the PE/VC index return. Still, the private markets outpaced their public counterparts in all other time periods (Figure 1). Distributions fell for the second consecutive year and trailed contributions for only the second time since 2010.
According to Dealogic, there was one European PE-backed initial public offering (IPO) in 2023. This is the second consecutive year with virtually no IPOs after a relatively busy market in 2020 and 2021. According to Pitchbook, 28 VC-backed companies in Europe went public in 2023, the lowest total since at least 2013. The total value of IPOs was also down significantly (€1.4 billion), in contrast to the €105 billion value at the peak of the market in 2021. Deal flow was slower in 2023, including PE-backed mergers and acquisitions (M&As), which dropped significantly. There were only 556 M&A transactions in 2023, almost a 40% drop from the prior year. Within the sample, 76 (or almost 14%) of the deals had publicly disclosed values, and those averaged $458 million per transaction. Both the percentage of deals with disclosed values and the average size of those values were down materially from 2022. About 55% of activity occurred in the second half of the year.
Vintage Years
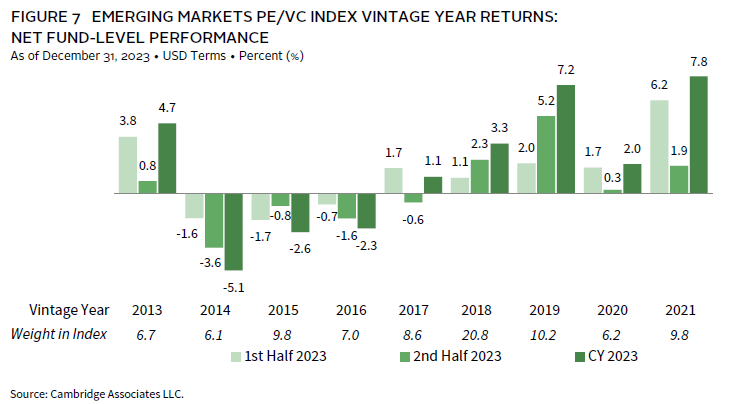
Eight vintage years (2014–21) represented at least 5% of the index’s value at the end of 2023. Combined, these vintages accounted for 86% of the benchmark and earned a pooled return of 8% for the year (Figure 2). All meaningfully weighted vintage years contributed to the positive return—unlike in 2022, when funds from the same eight years all had negative returns. Fund age was an important factor for performance; the older vintages (2014–16) each generated returns of around 4% for the year while the younger vintages (2017–21) all netted more than 8%. The exit environment remained challenging in 2023, potentially forcing longer hold periods and negatively impacting internal rates of return (IRRs), whose calculation incorporates time and could be especially impactful for older investments.
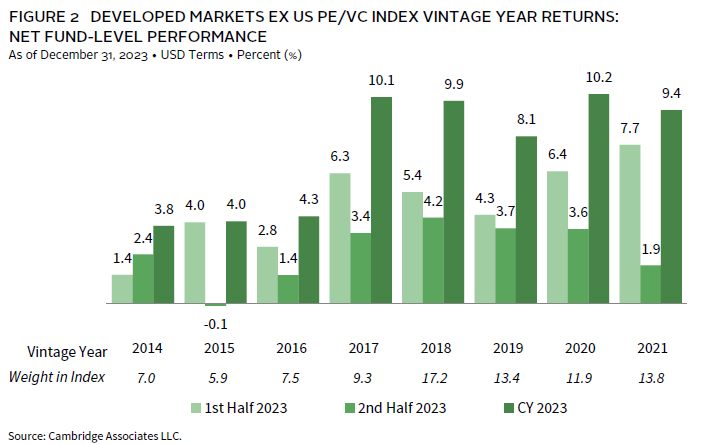
The weights of the large vintage years ranged from 6% (2015) to more than 17% for funds started in 2018. Aside from the 2014 vintage, performance was stronger in the first half of the year than during the second. Public markets followed a similar trajectory in 2023 as inflation proved to be stickier than expected after a rapid initial decline. Performance for the highest returning vintage (2020) was driven primarily by investments in information technology (IT) and communication services, although all meaningfully sized sectors in the vintage were positive for the year. The oldest and worst-performing vintage year (2014) also generated meaningful performance from its investments in IT, but its second-largest sector exposure, consumer discretionary, pulled down the total return.
LP Cash Flows
Distributions fell in 2023 and trailed contributions for only the second time since the years marked by the global financial crisis (2008–10). Persistent inflation and high interest rates dampened growth and valuations, leaving managers with limited exit opportunities, particularly when pricing expectations were based on transactions made in 2020 and 2021. Contributions picked up slightly in 2023 after falling sharply in 2022 (Figure 3). The increase is a positive signal for the industry but could also be a by-product of the large amount of dry powder residing in COVID-era funds that have less time remaining in their investment periods.
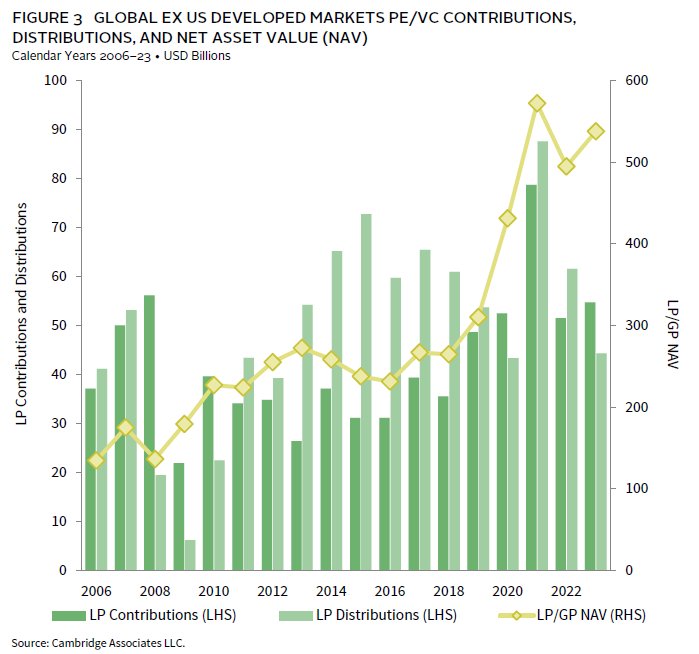
The 2021 and 2022 vintage years each called more than $15 billion and, combined, accounted for 56% of contributions during the year. When funds from 2019–20 are added, this total rises to 82% of capital calls. Distributions were more concentrated than they have been in recent years, with the 2018 vintage alone returning more than $10 billion to limited partners (LPs), or almost a quarter of the total. Funds from 2014–16 also made meaningful distributions during the year.
Sectors
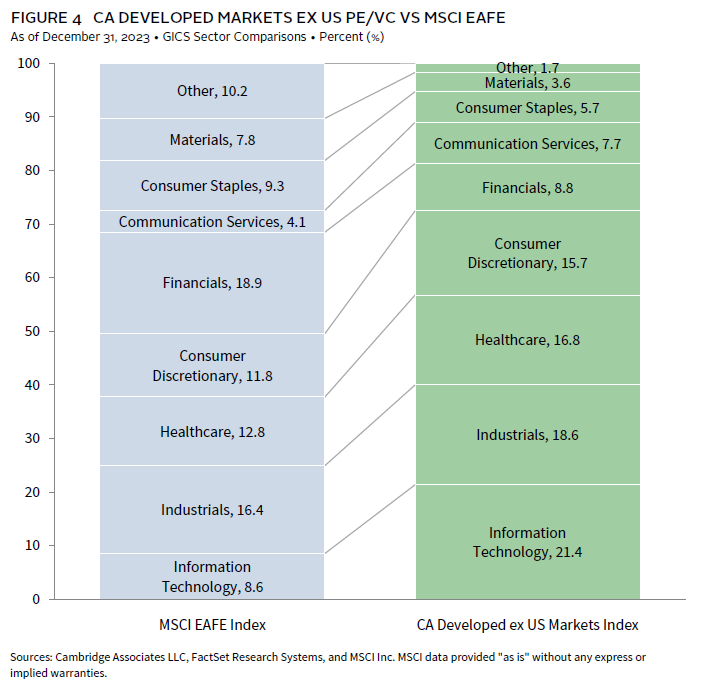
Figure 4 shows the GICS® sector breakdown of the developed markets ex US PE/VC index and a public market counterpart, the MSCI EAFE Index. The sectors with the biggest exposure differences between the two indexes are IT and financials. Private markets have historically had a larger weight in IT, and still do, at 21.4% relative to 8.6% for the public index. In contrast, the public market has more than double the exposure to financials than does the PE/VC benchmark. The private index also has notable overweights in healthcare and consumer discretionary, each with about 4% more than in the MSCI EAFE.
There were seven meaningfully sized sectors in the index at the end of 2023 and all performed positively, in stark contrast to 2022 when all seven posted negative returns (Figure 5). During 2023, three sectors earned double-digit returns: communication services (11.9%), industrials (11.5%), and financials (10.4%). The worst three, healthcare, consumer staples, and consumer discretionary, still returned between 4.0% and 6.0%. Macro factors led to reduction in discretionary spending, which negatively impacted the consumer sector. IT was still the largest sector by weight and earned 8.5% in 2023, a significant improvement from its 16% decline in 2022. The value of the US dollar fell more than 3% against the euro, which led to weaker performance when measured in euros, although the US dollar has since recovered in 2024.

The index’s four largest sectors—IT, industrials, healthcare, and consumer discretionary (in rank order)—represented 73% of its value and returned 7.6% on a gross USD-weighted basis and 4.0% on a euro-weighted basis. There were no material shifts in sector exposures from the end of 2022 to the end of 2023. Healthcare companies attracted the most capital investment during the year, followed by industrials and IT (from largest to smallest). Combined, these three sectors accounted for 56% of the invested capital in 2023, which is almost 10% more than their allocations since the inception of the benchmark. The biggest difference was in healthcare, which received 22% of the capital in 2023, compared to 15% over the long term.
Countries
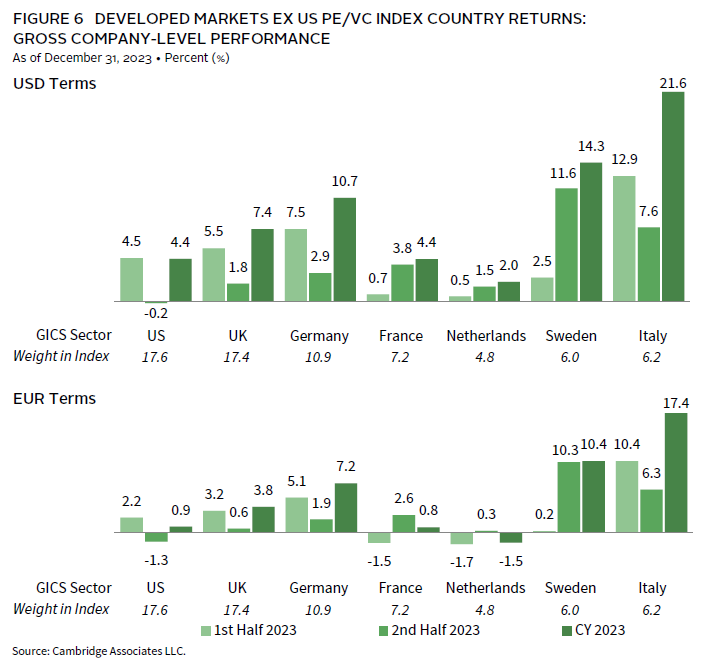
All seven meaningfully weighted countries earned positive returns for the year in USD terms, with a fair amount of disparity among the group’s performance (Figure 6). Although the Netherlands made up only 4.8% of the index at the end of 2023, it was more than 5% at June 30 and, therefore, was still included. Italy was by far the best-performing country (21.6%), and two others generated double-digit returns—Sweden (14.3%) and Germany (10.7%). The largest countries by value—the United States and the United Kingdom—each accounted for about 17% of the index and returned 4.4% and 7.4%, respectively. Differences in performance between the first and second half of 2023 varied by country; four performed better in the first six months and three performed better in the last six months. Like vintage years and sectors, returns were worse when measured in euros and essentially flat for France and the Netherlands for the full year.
European companies attracted 84% of the capital invested during the year, led by those in the United Kingdom, Germany, and Sweden (in rank order). While not part of Europe, US-based businesses received 10% of money invested by managers in the developed ex US index, less than half of the percentage they received in 2022. Historically, together the Europe and the United States garnered more than 90% of capital.
Emerging Markets Private Equity and Venture Capital Performance Insights
Globally, private asset classes underperformed relevant public company indexes in 2023. In the emerging markets, the 1.6% return for the PE/VC benchmark trailed that of the public (MSCI Emerging Markets) by nearly 9%. Additionally, in both the private and public markets, emerging markets underperformed developed markets during the year (Figure 1). At the end of 2023, vintage years 2013–21 made up 85% of the index’s value and annual returns among those vintages averaged approximately 2%.
Vintage Years
Nine vintage years were meaningfully sized in 2023 and collectively accounted for 85% of the total sample (Figure 7). Returns for the year among the nine vintages were mixed, with three posting negative results and six earning varying levels of positive returns; performance ranged from -5.1% (2014) to 7.8% (2021). The pooled return of the nine vintages (2013–21) was 3.7%, nearly an 11% increase from the -6.9% return of the key vintages in the emerging markets index last year. Performance for 2021 vintage funds was driven primarily by write-ups in the healthcare and consumer discretionary sectors. As in 2022, funds formed in 2014—the worst-performing vintage—wrote down values in several sectors, most notably healthcare and IT; write-ups in consumer discretionary slightly mitigated the impact.
LP Cash Flows
Following the trend from last year, cash flows for emerging markets PE/VC funds in 2023 again declined. During 2023, funds called $18.2 billion from investors, a 30% decrease from the previous year and the lowest amount since 2013 (Figure 8). Distributions declined as well as funds returned $23.3 billion in capital to investors—20% less than in 2022 and the lowest amount since 2018. Though substantial, the declines in activity are not altogether unexpected; a difficult macro environment, geopolitical tensions, and a transaction market that continued to cool from its 2021 frenzied levels all put pressure on PE/VC activity across geographies and asset classes.

Funds raised in 2018 and 2020–21 were responsible for most of the capital called during the year, amounting to nearly $12 billion and representing two-thirds of the total. All three vintages called more than $2.0 billion each, and the 2021 group called nearly $7.5 billion.
Eight vintages (2010–11, 2013–16, 2018–19) distributed more than $1 billion each during the year. Notably, 2011 funds returned more than $4.5 billion to LPs (20% of total distributions), suggesting that older funds (some of which are nearing the end of their fund lives) were able to sell some of their long-held investments. It is also indicative of the extended hold periods that have been observed in the market.
Sectors
Figure 9 shows the GICS® sector breakdown of the emerging markets PE/VC index and a public market counterpart, the MSCI Emerging Markets Index. The breakdown provides context when comparing the performance of the two indexes. The chart highlights the relative overweights in the PE/VC index in healthcare, consumer discretionary, and industrials, and the underweights in IT, financials, and materials. At the end of 2023, healthcare was the largest sector in the emerging markets PE/VC index, overtaking consumer discretionary by a narrow margin.

Of the seven meaningfully sized sectors in 2023 (those which constituted more than 5% of the index), five posted positive returns for the year, while two, communication services and consumer staples, earned negative returns (Figure 10). Performance across the key sectors ranged from -4.5% (communication services) to 6.0% (consumer discretionary). Returns were generally better in the first half of the year than the second, during which performance was mostly flat or negative. On a gross USD-weighted basis, the three largest sectors by market value—healthcare, consumer discretionary, and IT (in rank order)—returned 4.9% during the year. In the same period, the remaining four meaningfully weighted sectors returned just 1.2%.

Companies across three sectors (in rank order: healthcare, IT, communication services) garnered two-thirds of the capital invested during the year. Over the long term, managers in the emerging markets index have allocated just 36% of their capital to these three sectors, with 26% going to healthcare and IT. Healthcare and IT attracted 37% and 18%, respectively, of the capital invested during the year—22% more than over the long term for healthcare and 6% more than for IT. On the flip side, consumer discretionary and industrials each received nearly 10% less capital, respectively, than their long-term averages.
Countries
As in past years, China was the largest country in the emerging markets PE/VC index at the end of 2023 (Figure 11). However, mostly due to poor performance in the past several years, the index has become substantially less concentrated, with China constituting about 37% of the index in 2023, down from nearly 50% at the end of 2020 and 40% at the end of 2022. India and South Korea continued to be meaningfully sized, as did the United States, which constituted approximately 9% of the index.[2]Funds in the emerging markets PE/VC benchmark occasionally invest in companies in developed markets countries, as well as those in the emerging markets regions. Japan, a new addition to the meaningfully sized countries, represented more than 5% of the index, driven by strong performance across the year. In the past, Japan has been close to the 5% threshold but has typically lingered below it, along with countries such as Singapore and Hong Kong, which represented about 4% and 3% of the index in 2023, respectively.
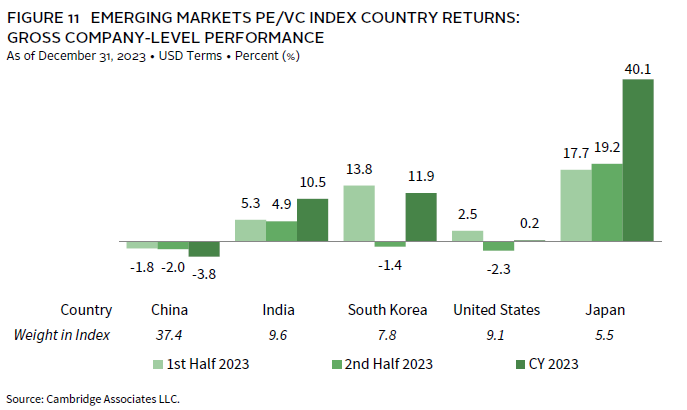
Other than China, the meaningfully sized countries in the index posted flat to positive returns in 2023. Performance ranged from -3.8% (China) to 40.1% (Japan). Japan’s return was driven by significant write-ups in investments across sectors, though investments in IT were responsible for nearly half of the gain during the year; when returns are measured in yen terms, the country’s performance is even stronger. The calendar year gross-weighted return for all five countries was 3.1%, 12.6% higher than last year’s return.
For the year, businesses in China, South Korea, and Japan (in rank order) garnered 66% of the capital deployed. Over the long term, these same countries attracted about 45% of invested capital, with the difference attributable to South Korea and Japan attracting more capital than their long-term levels; at 30%, China received less than it has over the long term (34%). South Korea and Japan received the second- and third-most invested capital, at 23% and 13%, respectively, and came in above their respective long-term totals of 7% and 5%.
Caryn Slotsky, Managing Director
Wyatt Yasinski, Associate Investment Director
Drew Carneal, Associate Investment Director
Figure Notes
Global ex US Private Equity and Venture Capital Index Returns
The PE and VC indexes are pooled horizon internal rates of return and are based on limited partners’ fund-level performance; the returns are net of fees, expenses, and carried interest. Because the indexes are capitalization weighted, performance is mainly driven by the largest vintage years.
Public index returns are shown as both time-weighted returns (average annual compound returns) and dollar-weighted returns (mPME). The CA Modified Public Market Equivalent replicates private investment performance under public market conditions. The public index’s shares are purchased and sold according to the private fund cash flow schedule, with distributions calculated in the same proportion as the private fund, and mPME net asset value is a function of mPME cash flows and public index returns.
Vintage Year Returns
Vintage year fund-level returns are net of fees, expenses, and carried interest.
Sector Returns
Industry-specific gross company-level returns are before fees, expenses, and carried interest.
GICS Sector Comparisons
The Global Industry Classification Standard (GICS®) was developed by and is the exclusive property and a service mark of MSCI Inc. and S&P Global Market Intelligence LLC and is licensed for use by Cambridge Associates LLC. As a result of the GICS sector definition changes in 2018, the makeup of the private and public indexes changed and, in some cases, impacted the relative over and underweights in the private index. The newest sector, communication services, largely includes companies formerly designated as telecommunications, consumer, and IT. “Other” includes sectors that make up less than 3% of the CA benchmark.
About the Cambridge Associates LLC Indexes
Cambridge Associates derives its Developed Markets ex US Private Equity and Venture Capital Index from the financial information contained in its proprietary database of global ex US private equity and venture capital funds. As of December 31, 2023, the database comprised 1,115 global ex US developed markets buyouts, growth equity, and venture capital funds formed from 1986 to 2023 with a value of about $538 billion. Ten years ago, as of December 31, 2013, the benchmark index included 675 global ex US developed markets funds, whose value was roughly $272 billion. The funds in this index invest primarily in developed markets in Australia, Canada, Israel, Japan, New Zealand, Singapore, and Western Europe.
Cambridge Associates derives its Emerging Markets Private Equity and Venture Capital Index from the financial information contained in its proprietary database of global ex US buyouts, growth equity, and venture capital funds. As of December 31, 2023, the database comprised 797 emerging markets private equity and venture capital funds formed from 1986 to 2023 with a value of about $320 billion. Ten years ago, as of December 31, 2013, the benchmark index included 488 emerging markets funds, whose value was about $124 billion. The funds in this index invest primarily in Africa, emerging Asia, emerging Europe, Latin America & Caribbean, and the Middle East ex Israel.
The pooled returns represent the net periodic rates of return calculated on the aggregate of all cash flows and market values as reported to Cambridge Associates by the funds’ general partners in their quarterly and annual audited financial reports. These returns are net of management fees, expenses, and performance fees that take the form of carried interest.
About the Public Indexes
The MSCI All Country World Index (ACWI) is a free float–adjusted, market capitalization–weighted index designed to measure the equity market performance of developed and emerging markets. As of December 31, 2023, the MSCI ACWI consisted of 47 country indexes comprising 23 developed and 24 emerging markets country indexes. The developed markets country indexes included are: Australia, Austria, Belgium, Canada, Denmark, Finland, France, Germany, Hong Kong, Ireland, Israel, Italy, Japan, the Netherlands, New Zealand, Norway, Portugal, Singapore, Spain, Sweden, Switzerland, the United Kingdom, and the United States. The emerging markets country indexes included are: Brazil, Chile, China, Colombia, Czech Republic, Egypt, Greece, Hungary, India, Indonesia, Korea, Malaysia, Mexico, Pakistan, Peru, the Philippines, Poland, Qatar, Saudi Arabia, South Africa, Taiwan, Thailand, Turkey, and the United Arab Emirates.
The MSCI EAFE Index is a free float–adjusted, market capitalization–weighted index that is designed to measure large- and mid-cap equity performance of developed markets, excluding Canada and the United States. As of December 31, 2023, the MSCI EAFE Index consisted of the following 21 developed markets country indexes: Australia, Austria, Belgium, Denmark, Finland, France, Germany, Hong Kong, Ireland, Israel, Italy, Japan, the Netherlands, New Zealand, Norway, Portugal, Singapore, Spain, Sweden, Switzerland, and the United Kingdom.
The MSCI Emerging Markets Index is a free float–adjusted, market capitalization–weighted index that is designed to measure large- and mid-cap equity performance of emerging markets. As of December 31, 2023, the MSCI Emerging Markets Index included 24 emerging markets country indexes: Brazil, Chile, China, Colombia, Czech Republic, Egypt, Greece, Hungary, India, Indonesia, Korea, Malaysia, Mexico, Pakistan, Peru, the Philippines, Poland, Qatar, Saudi Arabia, South Africa, Taiwan, Thailand, Turkey, and the United Arab Emirates.
The MSCI World Index represents a free float–adjusted, market capitalization–weighted index that is designed to measure the equity market performance of developed markets. As of December 31, 2020, it includes 23 developed markets country indexes: Australia, Austria, Belgium, Canada, Denmark, Finland, France, Germany, Hong Kong, Ireland, Israel, Italy, Japan, the Netherlands, New Zealand, Norway, Portugal, Singapore, Spain, Sweden, Switzerland, the United Kingdom, and the United States.
Footnotes