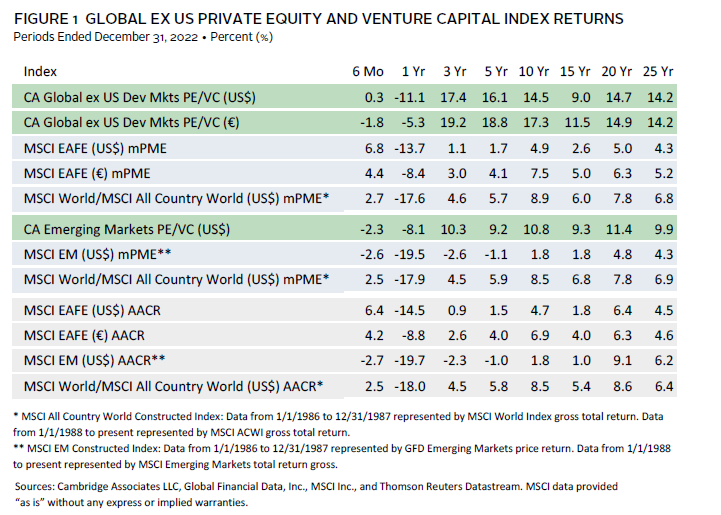
In 2022, the Cambridge Associates LLC Developed Markets ex US Private Equity and Venture Capital (PE/VC) Index returned -11.1% in USD terms, marking a sharp reversal from two strong years in 2020 and 2021. In euro terms, the index’s return (-5.3%) was better, due to the strength of the dollar vis-à-vis the euro (Figure 1). The Cambridge Associates LLC Emerging Markets Private Equity and Venture Capital Index performed slightly better than its developed markets counterpart, returning -8.1% for the year in USD terms, but it also suffered a substantial reversal from strong performance in recent years. The developed markets PE/VC index has handily outperformed public market indexes across time based on modified public market equivalent (mPME) returns,[1]Cambridge Associates’ mPME calculation is a private-to-public comparison that seeks to replicate private investment performance under public market conditions. although the spread in the past year was narrower than usual. The same is generally true for the emerging markets PE/VC index when compared to the MSCI All Country World Index (MSCI ACWI) mPME and MSCI Emerging Markets mPME. Fears of a recession and ongoing geopolitical tensions weighed on markets during the year, though a rally starting in early 2023 has brought markets back to near-peak levels.
Calendar Year 2022 Highlights
- The developed markets ex US PE/VC index had its worst year since 2008; it fell short of the comparable public benchmark’s (MSCI EAFE) returns in the most recent six months but still managed to outperform in all other time periods listed in Figure 1. The emerging markets index has outperformed its public market peer (the MSCI Emerging Markets Index) across all time periods.
- As of December 31, 2022, public company exposures were down about 3% from the prior year for both the developed and emerging markets indexes; public companies accounted for 4% and 18%, respectively.
- In both indexes, all sectors posted negative calendar year returns in 2022. In the developed markets, industrials proved to be the most resilient, while consumer staples, communication services, and IT were the hardest hit. Communication services, financials, and IT and were the lowest-performing sectors in the emerging markets PE/VC benchmark.
Developed Markets ex US PE/VC Performance Insights
After a historic bull market in 2021, marked by soaring returns and valuations, as well as furious fundraising and deal flow paces, 2022 was a year of correction. High inflation, rising interest rates, and ongoing geopolitical tensions put stress on the global economy. In the public markets, the MSCI EAFE outperformed the MSCI Emerging Markets Index, but both had double-digit negative returns for the year. With its -11.1% return, the developed markets PE/VC index’s performance was only slightly better than that of its public counterpart. At year end, eight vintage years (2014–21) made up most of the index’s value and earned a pooled -8.8% net return.
According to Dealogic, there were no European PE-backed initial public offerings (IPOs) in 2022. This marks the third year of decline after 14 companies went public in 2020 and five in 2021. In contrast, according to Pitchbook, 63 VC-backed companies in Europe went public in 2022, down 70% from the prior year but a hopeful sign for VC and tech proliferation amid a dismal year for public exits. The total value of IPOs was also down significantly (€13.4 billion in 2022 versus €107.0 billion in 2021) but was still relatively high for European VC. Despite the volatile year for returns, Europe saw an increase in PE-backed mergers & acquisitions (M&A) in 2022, with 916 transactions completed (up from 871 in 2021). Within the sample, 218 (or almost 24%) of the deals had publicly disclosed values and those averaged $1.1 billion per transaction, the same amount as the prior year. About 57% of activity occurred in the first half of the year.
Vintage Years
At the end of 2022, there were eight vintage years that represented at least 5% of the index’s value. These included funds from 2014–21, which, combined, accounted for almost 87% of the benchmark (Figure 2). Unlike 2021, when the net asset values (NAVs) for a couple of vintage years grew to record levels, almost all meaningfully weighted vintages in 2022 shrunk considerably; on average, they depreciated by $3.6 billion. The only vintage that grew NAV during the year was 2021, which could indicate that managers held valuations constant for recent investments despite the broader market correction. While the weight for most of the large vintage years ranged from 7% to 12%, funds from 2018 represented more than 19% of the index.
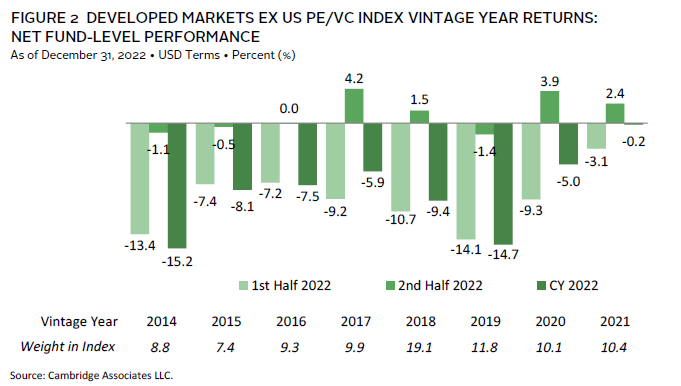
Calendar year returns were negative across the board, ranging from -15.2% (2014) to -0.2% (2021). For all meaningfully weighted vintage years, performance was weak in the first half and flat to positive in the second half. This is consistent with public market performance during the year. The worst-performing vintage year (2014) was driven by write-downs in IT, while the best-performing vintage year (2021) benefited from less volatility, as many of the investments were held near or at cost.
LP Cash Flows
Cash flows in 2022 for the developed markets ex US PE/ VC index contracted from record levels in 2021. Limited partner (LP) contributions and distributions almost reached $50 billion and $60 billion, respectively. Despite macro headwinds, distributions outpaced contributions again in 2022, a trend that has occurred for 11 of the past 12 years (Figure 3). The broader correction in financial markets was felt more strongly for LP cash flows in the second half of the year. Distributions exceeded contributions by almost $12 billion in the first two quarters of 2022 but then flipped and were outpaced by almost $3 billion in the last six months. The story was different in the United States, where more money was called from than returned to LPs.
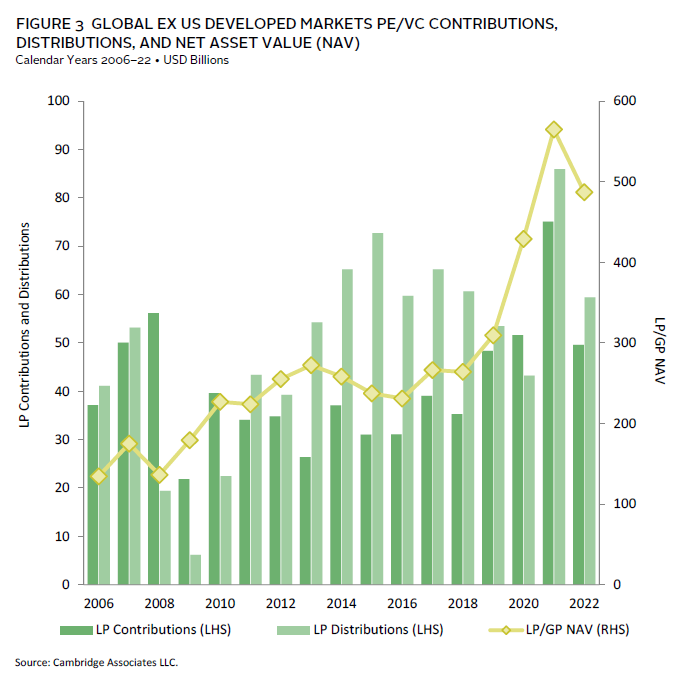
Vintage years 2019–21 were responsible for 76% of capital calls, with each vintage calling at least $9 billion. The previous year’s fast-paced fundraising activity positioned 2021 funds to call by far the most capital in 2022, $17.3 billion or 35% of the total. Distributions were less concentrated, as six vintage years (2012, 2014–18) returned at least $6.0 billion each. Notably, funds raised in 2014 returned the most, more than $11 billion, despite being nine years old.
Sectors
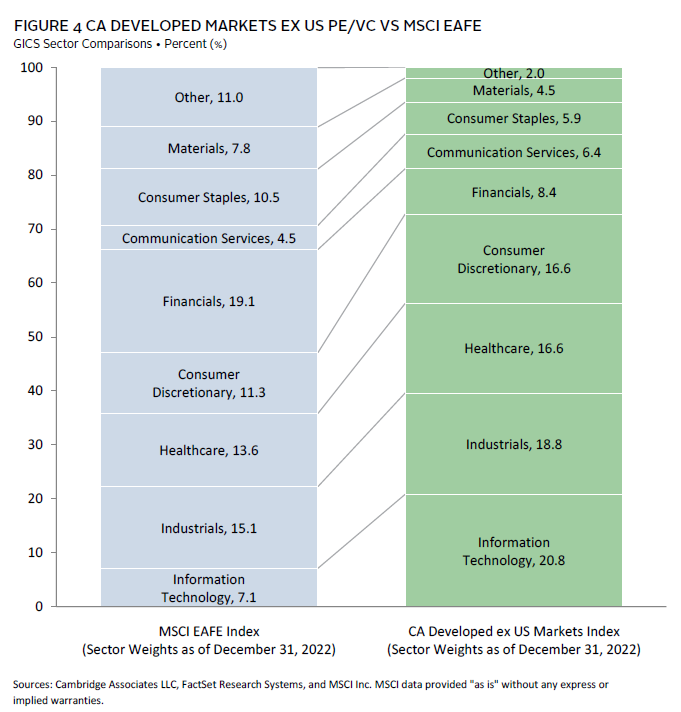
Figure 4 shows the Global Industry Classification Standard (GICS®) sector breakdown of the Developed Markets ex US PE/VC Index and a public market counterpart, the MSCI EAFE Index. Private markets had 13.7% and 5.3% more exposure to IT and consumer discretionary, respectively, when compared to the public index. Healthcare has historically been another meaningfully overweighted sector for the private index but now is only 3% higher than the MSCI EAFE. The public markets had more exposure to financials, about 11%.
At the end of 2022, there were seven meaningfully sized sectors in the index, and all posted negative returns for the year in USD terms (Figure 5). Two of the high-flying sectors during the COVID-19 economy, communication services and IT, experienced a steep correction and returned -18.8% and -16.1%, respectively. Perhaps surprisingly, consumer staples—a sector that has tended to show resilience in recessionary environments—was the worst performer of the group. While only earning -2.3% in USD terms, industrials proved to be the resilient sector despite high inflation. The US dollar, often regarded as the global reserve currency during times of financial distress, gained significant value against the euro through the first three quarters of the year. This led to stronger performance when measured in euros, although the US dollar has since declined to a pre-pandemic levels.
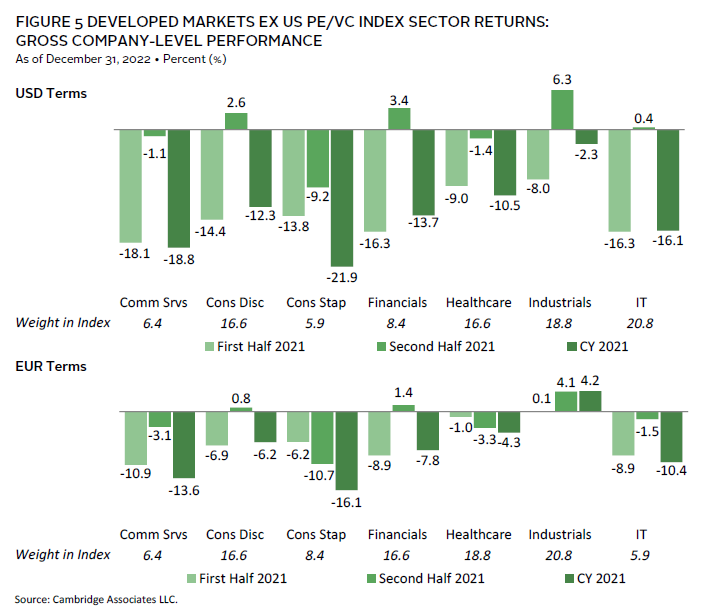
The index’s four largest sectors—IT, industrials, healthcare, and consumer discretionary (in rank order)—represented 73% of its value and returned -10.8% on a gross USD-weighted basis and 0% on a euro-weighted basis. The exposure to industrials grew by 3 percentage points (ppts) from the end of 2021, partially due to its relative outperformance to other sectors. However, IT received the most capital during the year, followed by industrials, healthcare, and consumer discretionary (from largest to smallest). Since the inception of the index, managers invested about 67% in these four sectors; this is 5 ppts shy of 2022 levels, reflecting increases in IT and industrials and decreases in healthcare and consumer discretionary. Despite healthcare’s smaller size in the index, investments in the sector returned substantially more capital than all the other largest sectors during the year.
Countries
Results were mixed for the seven meaningfully sized countries in the index in USD terms; five were negative and two were positive (Figure 6). The worst-performing country by far was the United States, which posted a -24.3% return for the 2022 calendar year. On the other end, the Netherlands and Italy achieved 5.3% and 2.2% returns, respectively. Like vintage years and sectors, performance was stronger in the second half of the year for all countries, and returns were much stronger when measured in euros. The Netherlands was the only country included this year that did not meet the 5% threshold at the end of 2021. This was driven more by relative outperformance to other countries rather than an increase in the amount of invested capital.
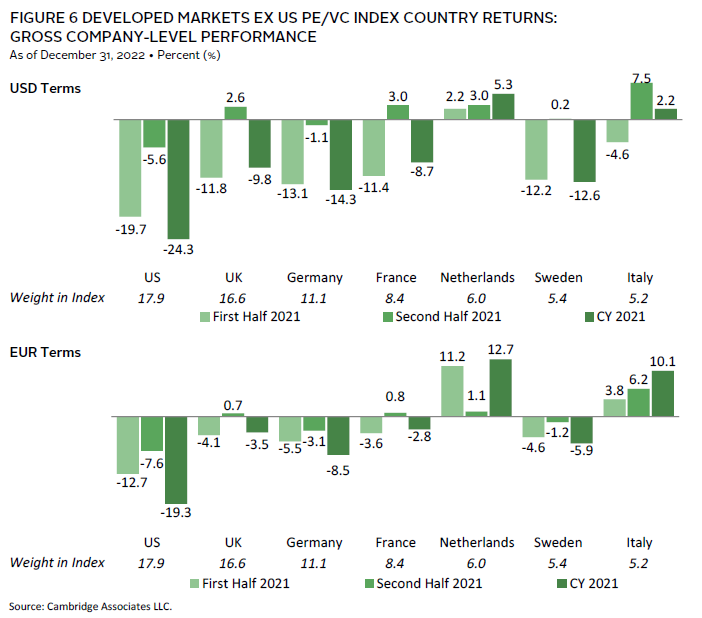
European companies attracted 70% of the capital invested during the year, led by those in the United Kingdom, which accounted for 16%. US-based businesses received 21% (the most of any country) of money invested by managers in the developed ex US index. Historically, Europe and the United States garnered 92% of capital, with the difference in 2022 attributed to the higher-than-normal investment in the United States.[2]Funds in the ex-US developed markets PE/VC benchmark generally invest in companies located in developed markets, including in the United States.
Emerging Markets PE/VC Performance Insights
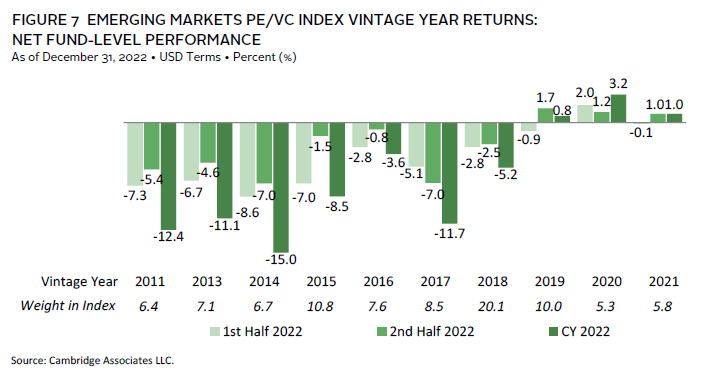
Like its private market counterpart, the public emerging markets index (MSCI Emerging Markets) produced negative returns for the year. In the private markets, emerging markets outperformed developed markets during 2022, while the opposite was true of the public indexes (Figure 1). With a -8.1% annual return, the emerging markets PE/VC benchmark felt the impact of the public market sell-off amid high inflation and interest rates. At the end of 2022, vintage years 2011 and 2013–21 made up about 88% of the index’s value and annual returns among those vintages averaged worse than -6%.
Vintage Years
In 2022, the ten meaningfully sized vintage years collectively accounted for 88% of the total sample (Figure 7). Seven produced negative returns for the year, with the remaining three showing flat to slightly positive performance; returns ranged from -15.0% (2014) to 3.2% (2020). The average pooled return of the ten vintages (2011, 2013–21) was -6.9%, a 22% decrease from the strong 15.1% average return of the key vintages in the emerging markets index last year. Performance for 2020 vintage funds was supported by modest write-ups in several sectors, including IT and consumer staples. Funds formed in the worst-performing vintage, 2014, saw write-downs in nearly all sectors, though healthcare and IT were the biggest drivers; write-ups in consumer discretionary slightly mitigated the impact.
LP Cash Flows
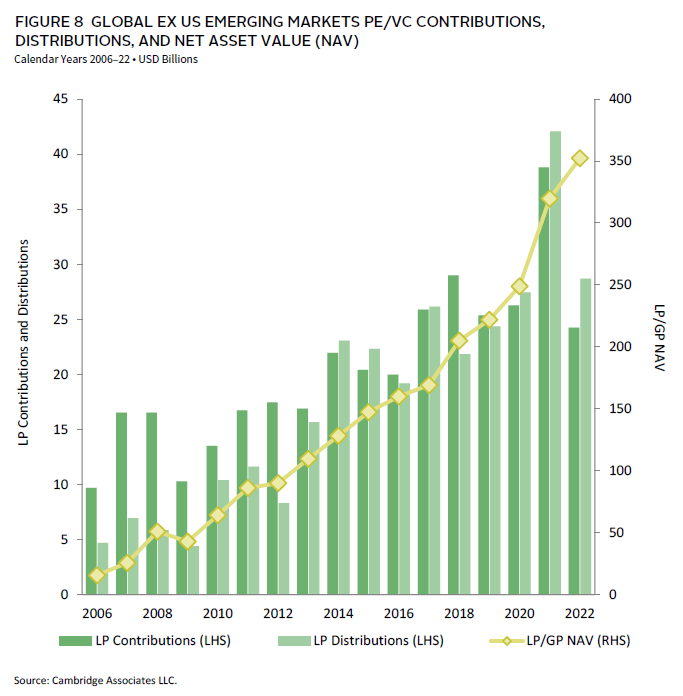
After a record year in 2021, emerging markets PE/VC funds saw cash flows return to pre-pandemic levels. During 2022, funds called $24.2 billion from investors, a 38% decrease from the previous year (Figure 8). Distributions also retrenched as funds returned $28.7 billion in capital to investors, 32% less than in 2021. Since 2017, the emerging markets index has seen a consistent amount of PE/VC investment activity year-over-year (except for 2021, an outlier year).
Funds raised in 2018–21 were responsible for most of the capital called during the year, amounting to $20.8 billion and representing almost 86% of the total. Three vintages (2018–19 and 2021) called more than $5.1 billion each, and 2020 called $3.4 billion.
Notably, ten vintages (2008, 2010–11, 2013–19) each distributed more than $1 billion, indicating that older funds were able to sell some of their long-held investments. This is a recent trend, as fund ages and hold periods continue to extend. Further illustrating this point, funds raised in 2008 and 2010–11 distributed almost 24% of the total capital returned to investors during 2022, and 2013 vintage funds accounted for the most of any year.
Sectors
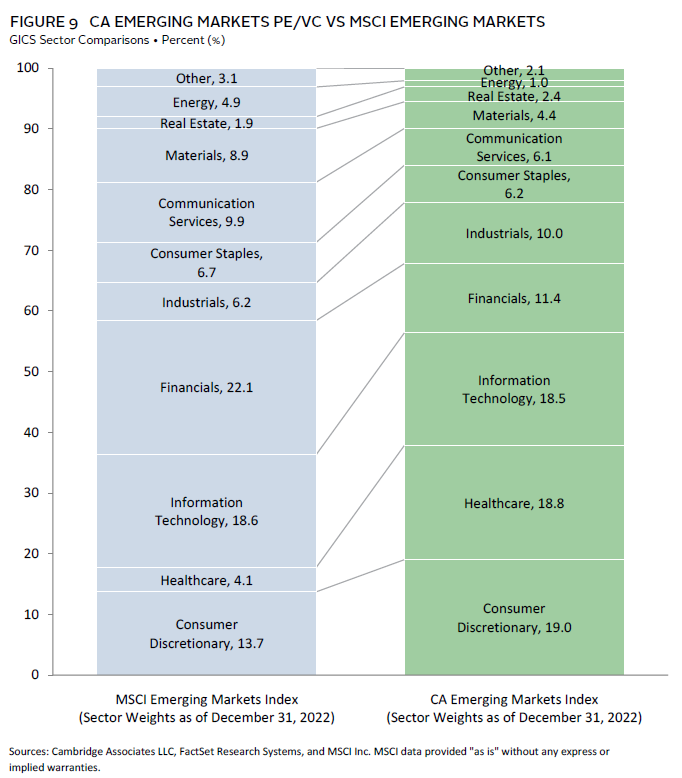
Figure 9 shows the GICS® sector breakdown of the Emerging Markets PE/VC Index and a public market counterpart, the MSCI Emerging Markets Index. The breakdown provides context when comparing the performance of the two indexes. The chart highlights the relative overweights in the PE/VC index in healthcare and consumer discretionary and the underweights in financials and materials. Consumer discretionary was once again the largest sector in the emerging markets PE/VC index after being overtaken by IT in 2021, a change largely attributable to strong relative performance of consumer discretionary in 2022.
All seven meaningfully sized sectors posted negative results for the year, which is consistent with the full index (Figure 10). Performance across the key sectors ranged from -20.1% (communication services) to -2.6% (consumer discretionary). Performance was generally better in the second half of the year, though both halves saw predominantly flat or negative returns across sectors. On a gross USD-weighted basis, the three largest sectors by market value—consumer discretionary, healthcare, and IT (in rank order)—returned -6.9% during the year. In the same period, the remaining four meaningfully weighted sectors returned -11.5%.
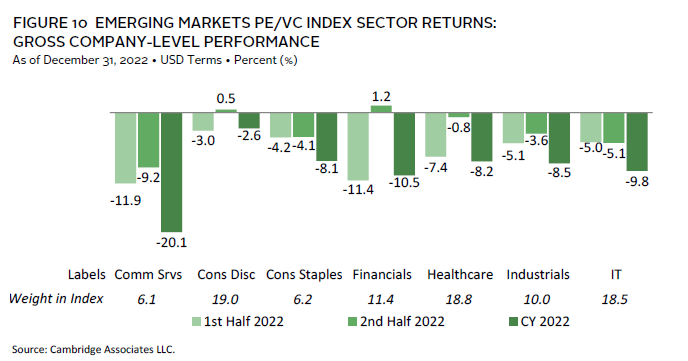
Companies across five sectors (in rank order: healthcare, IT, consumer discretionary, materials, and financials) garnered 78% of the capital invested. Over the long term, managers in the emerging markets index have allocated 61% of their capital to these five sectors, with 26% going to healthcare and IT. Healthcare and IT attracted 23% and 18%, respectively, of the capital invested during the year. Combined, this is 15% more than their long-term norms of 14% and 12%. Materials, a sector that is not meaningfully sized in the emerging markets index, attracted 13% of the capital invested during 2022, which is about 8% higher than its long-term norm. On the flip side, industrials and consumer staples each received about 5% less capital than their long-term averages.
Countries
As in past years, China was the largest country in the emerging markets PE/VC index at the end of 2022 (Figure 11). However, mostly due to poor performance in the past two years, the index has become substantially less concentrated, with China constituting about 40% of the index in 2022, down from nearly 50% at the end of 2020. India and South Korea continued to be meaningfully sized, and as of the end of 2022, the United States constituted 8.8% of the index.[3]Funds in the emerging markets PE/VC benchmark occasionally invest in companies in developed markets countries, as well as those in the emerging markets regions. Three other countries—Hong Kong, Japan, and Singapore (from high to low)—represented between 3.9% and 4.5% of the index.
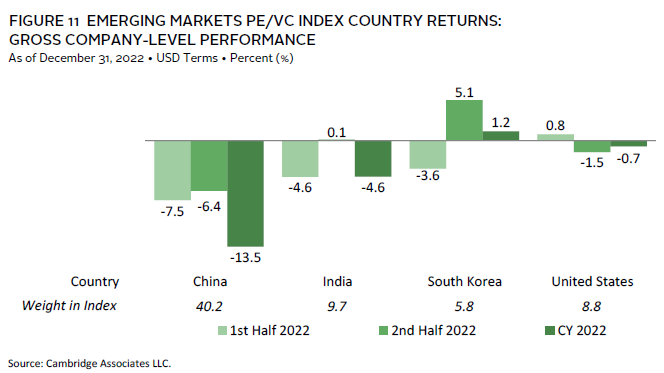
Other than South Korea, the meaningfully sized countries in the index posted negative returns in 2022. Performance for the other three ranged from -13.5% (China) to -0.7% (United States); South Korea returned just 1.2% for the year. The calendar year gross weighted return for all four countries was -9.5%, down from 34% in 2020 and 7.3% in 2021.
For the year, businesses in China, India, the United States, and South Korea (in rank order) each garnered more than $900 million of invested capital and, together, accounted for nearly 66% of the capital deployed. Over the long term, these same countries attracted about 57% of invested capital, with the difference primarily attributable to India and South Korea attracting more capital than their long-term levels. At 29%, China received less than its long-term average of 35% and came in well below the 48% of capital it received last year. India and South Korea received the second- and third-most invested capital, at 15% and 14%, respectively, and came in above their respective long-term averages of 9% and 6%. The United States received 8% of invested capital, slightly above its long-term average of 6%.
Caryn Slotsky, Senior Investment Director
Wyatt Yasinski, Associate Investment Director
Drew Carneal, Senior Investment Associate
Figure Notes
Global ex US Private Equity and Venture Capital Index Returns
The PE/VC indexes are pooled horizon internal rates of return and are based on limited partners’ fund-level performance; the returns are net of fees, expenses, and carried interest. Because the indexes are capitalization weighted, performance is mainly driven by the largest vintage years.
Public index returns are shown as both time-weighted returns (average annual compound returns) and dollar-weighted returns (mPME). The CA Modified Public Market Equivalent replicates private investment performance under public market conditions. The public index’s shares are purchased and sold according to the private fund cash flow schedule, with distributions calculated in the same proportion as the private fund, and mPME NAV is a function of mPME cash flows and public index returns.
Vintage Year Returns
Vintage year fund-level returns are net of fees, expenses, and carried interest.
Sector Returns
Industry-specific gross company-level returns are before fees, expenses, and carried interest.
GICS Sector Comparisons
The Global Industry Classification Standard (GICS®) was developed by and is the exclusive property and a service mark of MSCI Inc. and S&P Global Market Intelligence LLC and is licensed for use by Cambridge Associates LLC. As a result of the GICS® sector definition changes in 2018, the makeup of the private and public indexes changed and, in some cases, impacted the relative over and underweights in the private index. The newest sector, communication services, largely includes companies formerly designated as telecommunications, consumer, and IT. “Other” includes sectors that make up less than 3% of the CA benchmark.
About the Cambridge Associates LLC Indexes
Cambridge Associates derives its Developed Markets ex US Private Equity and Venture Capital Index from the financial information contained in its proprietary database of global ex US private equity and venture capital funds. As of December 31, 2022, the database comprised 1,054 global ex US developed markets buyouts, growth equity, and venture capital funds formed from 1986 to 2022 with a value of about $487 billion. Ten years ago, as of December 31, 2012, the benchmark index included 645 global ex US developed markets funds, whose value was roughly $255 billion. The funds in this index invest primarily in developed markets in Australia, Canada, Israel, Japan, New Zealand, Singapore, and Western Europe.
Cambridge Associates derives its Emerging Markets Private Equity and Venture Capital Index from the financial information contained in its proprietary database of global ex US buyouts, growth equity, and venture capital funds. As of December 31, 2022, the database comprised 801 emerging markets private equity and venture capital funds formed from 1986 to 2022 with a value of about $322 billion. Ten years ago, as of December 31, 2012, the benchmark index included 486 emerging markets funds, whose value was about $109 billion. The funds in this index invest primarily in Africa, emerging Asia, emerging Europe, Latin America & Caribbean, and the Middle East ex Israel.
The pooled returns represent the net periodic rates of return calculated on the aggregate of all cash flows and market values as reported to Cambridge Associates by the funds’ general partners in their quarterly and annual audited financial reports. These returns are net of management fees, expenses, and performance fees that take the form of carried interest.
About the Public Indexes
The MSCI All Country World Index (ACWI) is a free float–adjusted, market capitalization–weighted index designed to measure the equity market performance of developed and emerging markets. As of December 31, 2020, the MSCI ACWI consisted of 49 country indexes comprising 23 developed and 24 emerging markets country indexes. The developed markets country indexes included are: Australia, Austria, Belgium, Canada, Denmark, Finland, France, Germany, Hong Kong, Ireland, Israel, Italy, Japan, the Netherlands, New Zealand, Norway, Portugal, Singapore, Spain, Sweden, Switzerland, the United Kingdom, and the United States. The emerging markets country indexes included are: Brazil, Chile, China, Colombia, Czech Republic, Egypt, Greece, Hungary, India, Indonesia, Korea, Malaysia, Mexico, Pakistan, Peru, the Philippines, Poland, Qatar, Saudi Arabia, South Africa, Taiwan, Thailand, Turkey, and the United Arab Emirates.
The MSCI EAFE Index is a free float–adjusted, market capitalization–weighted index that is designed to measure large- and mid-cap equity performance of developed markets, excluding Canada and the United States. As of December 31, 2022, the MSCI EAFE Index consisted of the following 21 developed markets country indexes: Australia, Austria, Belgium, Denmark, Finland, France, Germany, Hong Kong, Ireland, Israel, Italy, Japan, the Netherlands, New Zealand, Norway, Portugal, Singapore, Spain, Sweden, Switzerland, and the United Kingdom.
The MSCI Emerging Markets Index is a free float–adjusted, market capitalization–weighted index that is designed to measure large- and mid-cap equity performance of emerging markets. As of December 31, 2022, the MSCI Emerging Markets Index included 24 emerging markets country indexes: Brazil, Chile, China, Colombia, Czech Republic, Egypt, Greece, Hungary, India, Indonesia, Korea, Malaysia, Mexico, Pakistan, Peru, the Philippines, Poland, Qatar, Saudi Arabia, South Africa, Taiwan, Thailand, Turkey, and the United Arab Emirates.
Footnotes