In 2019, in USD terms, the Cambridge Associates LLC Developed Markets (ex US) Private Equity and Venture Capital (PE and VC) Index returned 18.9%, driven largely by a strong fourth quarter. The Cambridge Associates LLC Emerging Markets Private Equity and Venture Capital Index earned 11.6% for the year, with middling returns in the second and third quarters. Because the indexes’ returns are measured in US dollars, the currency’s value vis-à-vis the euro impacts performance of the developed markets benchmark. The US dollar was generally stronger in the second half than in the first, which dampened performance measured in USD terms (Figure 1); for the year, the index’s return in euros was 21.1%. With few exceptions, the developed and emerging markets PE and VC indexes have handily outperformed their public market counterparts across time based on modified public market equivalent (mPME) returns. Cambridge Associates’ mPME calculation is a private-to-public comparison that seeks to replicate private investment performance under public market conditions.

FIGURE 1 GLOBAL EX US PE AND VC INDEX RETURNS
Periods Ended December 31, 2019 • Percent (%)
* MSCI All Country World Constructed Index: Data from 1/1/1986 to 12/31/1987 represented by MSCI World Index gross total return. Data from 1/1/1988 to present
represented by MSCI ACWI gross total return.
** MSCI EM Constructed Index: Data from 1/1/1986 to 12/31/1987 represented by GFD Emerging Markets price return. Data from 1/1/1988 to present represented by MSCI Emerging Markets total return gross.
Sources: Cambridge Associates LLC, Global Financial Data, Inc., MSCI Inc., and Thomson Reuters Datastream. MSCI data provided “as is” without any express or
implied warranties.
Calendar Year 2019 Highlights
- Despite underperforming public markets in 2019 (in both USD and euro terms), the developed markets (ex US) PE and VC index’s significant outperformance from 2014 to 2018 enabled it to dominate the comparable public benchmark (MSCI EAFE) in all other time periods listed in Figure 1. The emerging markets index trailed its public market peer (the MSCI Emerging Markets Index) in the past three years but outpaced it in longer time periods.
- Based on market values at December 31, 2019, public companies accounted for a much smaller portion of the developed markets index than the emerging one (about 5% for developed and nearly 16% of emerging).
- In 2019, among the largest sectors, information technology (IT) was by far the best performing in the developed markets (ex US) PE and VC index and communication services was the worst. In the emerging markets PE and VC benchmark, consumer staples earned the highest return and industrials the lowest.
Developed Markets (ex US) PE and VC Performance Insights
After a generally negative 2018, public equities globally rebounded strongly in 2019. The developed markets index (MSCI EAFE) outperformed the emerging markets (MSCI EM) and in both, public healthcare and IT companies performed well in 2019. With its return of nearly 19%, the developed markets (ex US) PE and VC benchmark posted its third double-digit result since 2016. At year-end, 14 vintage years (2005–18) comprised nearly all the index’s value; all but three (2005–06 and 2008) returned at least 9.1% for the year.
Vintage Years
By the end of 2019, the number of meaningfully sized vintage years (those that represented at least 5% of the index’s value) dipped to five (from seven at the end of 2018); combined, the large vintages (2012–16) accounted for 71% of the benchmark’s value (Figure 2). In addition to the meaningfully sized vintage years, five others (2006–07, 2010–11, and 2017) represented at least 3.4% each making up another 20% of the index’s value. As of June 30, 2019, the 2006–07 vintages represented more than 5% of the index’s value but have since dropped to closer to 3% in part because of middling performance in the second half of the year.
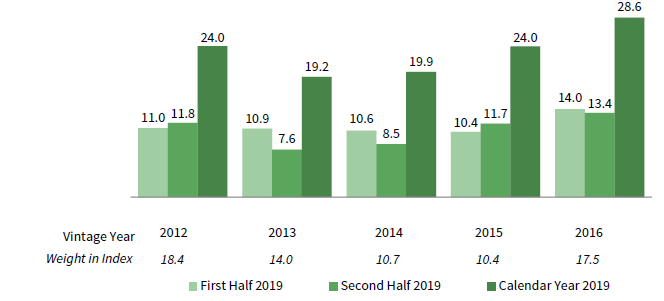
FIGURE 2 DEVELOPED MARKETS
As of December 31, 2019 • USD Terms • Percent (%)
Source: Cambridge Associates LLC.
Calendar year returns for the five key vintage years were strong, ranging from 19.2% (2013) to 28.6% (2016). Write-ups in healthcare, industrials, and to a lesser extent IT were the key contributors to the 2016 vintage year’s strong return. In the 2013 vintage, consumer discretionary, staples, financials, and IT valuations increased substantially.
Sectors
Figure 3 shows the GICS sector breakdown of the Developed Markets (ex US) PE and VC Index and a public market counterpart, the MSCI EAFE Index. The breakdown provides context when comparing the performance of the private and public indexes. The chart highlights the most significant differences between the private equity and public indexes, namely private equity’s IT and consumer discretionary overweights (between 9% and 10% overweights in each) and financials underweight (10% underweight). Buried in the “other” category is the private equity underweight in real assets (specifically energy and real estate). In this edition of the commentary, Figure 4 also includes the sector weightings from December 2007, the period leading into the global financial crisis (GFC) to enable a comparison with the sector breakdown heading into the COVID-19 crisis. The most notable changes in the private equity index are sizable increases in healthcare and IT and corresponding decreases in communication services and industrials.
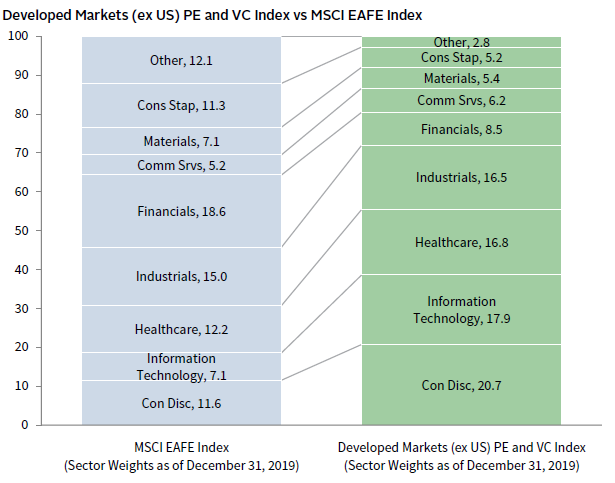
FIGURE 3 GICS SECTOR COMPARISONS
Percent (%)

Sources: Cambridge Associates LLC, FactSet Research Systems, and MSCI Inc. MSCI data provided “as is” without any express or implied warranties.
All eight meaningfully sized sectors earned double-digit positive returns for 2019 in USD and euro terms, with stronger performance in euros than in USD terms (Figure 4). Among the key sectors, IT earned the highest return (with more than double the performance of all the other sectors) and communication services the lowest. Except for inconsequential write-downs in the 2009 vintage, the IT sector enjoyed valuation increases in all other vintages from 2007–17. Funds raised in 2012 wrote up IT valuations the most, followed by vintages 2007, 2011, and 2013 (in rank order). In the much smaller communications services sector, write-ups were more muted, with the largest amount in vintage 2010. Write-downs in vintages 2005 and 2007 were also a factor in the sector’s return. The index’s four largest sectors—consumer discretionary, IT, healthcare, and industrials (in rank order)—represented 72% of its value and returned 17.1% on a gross USD-weighted basis and 19.2% on a euro-weighted basis.

FIGURE 4 DEVELOPED MARKETS (EX US) PE AND VC INDEX SECTOR RETURNS:
GROSS COMPANY–LEVEL PERFORMANCE
As of December 31, 2019 • Percent (%)
Source: Cambridge Associates LLC.
Healthcare, industrials, IT, and consumer discretionary companies (in rank order) attracted 79% of the capital invested in 2019; healthcare, industrials, and IT each garnered more than 20% of the total deployed. Since the inception of the index, managers invested about 67% in these four sectors. The higher percentage in 2019, when compared with the long-term norms, reflects the increased investment in healthcare and IT and the decrease in consumer discretionary.
Countries
In USD terms, all seven meaningfully sized countries in the index (accounting for 72% of its value) returned at least 13.2% in 2019 (Figure 5); as with the sectors, returns in euro terms were higher. The best-performing companies were based in Germany. While write-ups for German companies were widespread, the 2012 vintage led the way and accounted for more than 60% of the net appreciation. Businesses based in France posted the lowest return in the year, as valuation changes were more muted than for other countries; vintage 2016 had the most write-ups and vintage 2010 had the most write-downs. For the year, the gross USD-weighted return for the three largest countries—Germany, the United Kingdom, and the United States—was 22.9%.

FIGURE 5 DEVELOPED MARKETS (EX US) PE AND VC INDEX COUNTRY RETURNS:
GROSS COMPANY–LEVEL PERFORMANCE
As of December 31, 2019 • Percent (%)
Source: Cambridge Associates LLC.
Companies in Europe (led by Germany and the United Kingdom) attracted 71% of the capital invested during the year, while businesses based in the United States garnered 21%. Historically, closer to 80% of the capital invested went into European-based companies and about 13% was invested in the United States.
LP Cash Flows
During the year, limited partner (LP) contributions totaled $42.0 billion, the highest annual amount since 2008, and distributions were $50.4, the lowest annual amount since 2012. The second half of the year was a more active period than the first for both calls and distributions. As was the case in 2018, distributions outpaced contributions in three of the four quarters and for the year (the exception was the last quarter in both years). Distributions have outpaced contributions since the beginning of 2011 (Figure 6), but due to the pandemic, the cycle is expected to turn in 2020.

FIGURE 6 DEVELOPED MARKETS (EX US) PE AND VC CONTRIBUTIONS,
DISTRIBUTIONS, AND NET ASSET VALUE (NAV)
Calendar Years 2006–19 • USD Billions
Source: Cambridge Associates LLC.
Managers of funds raised from 2013 to 2018 called $39.8 billion, or 95% of the total capital called during the year. All called at least $1.6 billion, with the 2016 and 2017 vintages each calling more than $10.1 billion. Ten vintages, 2005–08 and 2010–15, each distributed at least $1.1 billion for a combined amount of $48.0 billion (95% of total distributions). For the second year in a row, the 2012 vintage year distributed the most capital.
Emerging Markets PE and VC Performance Insights
As was the case in the private asset classes, in the public markets, the emerging markets index (MSCI EM) underperformed the developed markets (MSCI EAFE) as public equities bounced back from their poor performance in 2018. Companies in many sectors earned double-digit returns, led by consumer staples and communication services. With an 11.6% annual return, the emerging markets PE and VC benchmark performed almost twice as well as it did in 2018 but worse than in 2017. At the end of 2019, vintage years from 2007 onward made up almost 97% of the index’s value and returns among those vintages were mixed.
Vintage Years
Nine vintage years were meaningfully sized in 2019, each representing at least 5% of the index, and collectively, they accounted for 85% of the total sample (Figure 7). All produced positive returns for the year, ranging from 2.7% (2010) to 23.7% (2016). The average pooled return of the nine vintages (2007 and 2010–17) was 12.8%, a 3.5% increase from the average return of the meaningful years of the emerging markets index last year. The strong performance by 2016 vintage funds was driven primarily by write-ups in IT, and to a lesser extent in financials and industrials. Across sectors, funds formed in the worst-performing vintage, 2010, had mixed results; IT, healthcare, and industrials saw write-downs, while consumer discretionary, consumer staples, and communication services benefited from increased valuations. For the second year in a row, IT was the biggest negative performance driver for the worst-performing vintage.

FIGURE 7 EMERGING MARKETS PE AND VC INDEX VINTAGE YEAR RETURNS:
NET FUND–LEVEL PERFORMANCE
As of December 31, 2019 • USD Terms • Percent (%)
Source: Cambridge Associates LLC.
Sectors
Figure 8 shows the GICS sector breakdown of the Emerging Markets PE and VC Index and a public market counterpart, the MSCI Emerging Markets Index. The comparison provides context when comparing the performance of the two indexes. The chart highlights the relative overweights in the PE and VC index, like healthcare and consumer discretionary, and the underweight in financials. Relative to other Cambridge Associates indexes, such as US PE, US VC, and the Developed Markets (ex US) PE and VC index, the Emerging Markets PE and VC Index sector breakdown more closely resembles its public market comparable, with fewer significant divergences between the public and private sector weightings. Figure 8 also includes the PE and VC sector weightings from December 2007 to allow for comparisons with the pre-GFC period. Notably, the PE and VC index has become somewhat more concentrated over time, with increased exposures to the consumer discretionary, healthcare, and IT sectors. At the end of 2007, the largest three sectors in the index (consumer discretionary, IT, and financials, in rank order) made up about 50% of the total market value; in 2019, that number increased to more than 54%. Consumer discretionary and IT are still the first- and second-largest sectors in the index in 2019 however, healthcare has edged out financials to take the number three spot; having grown to comprise more than 15% of the index from less than 5% in 2007, this sector has seen the most dramatic change from its 2007 value.
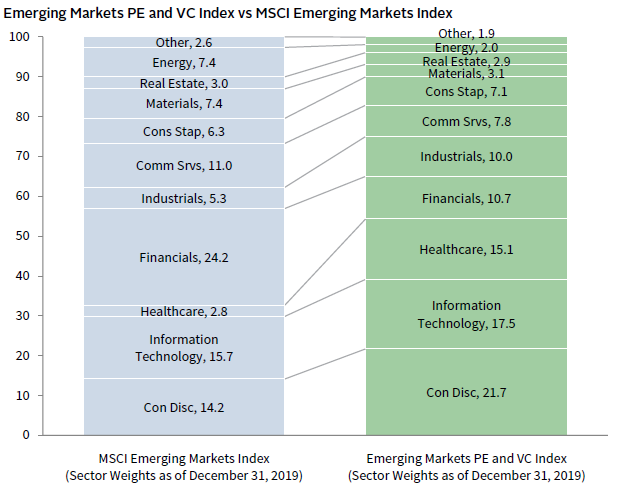
FIGURE 8 GICS SECTOR COMPARISONS
Percent (%)

Sources: Cambridge Associates LLC, FactSet Research Systems, and MSCI Inc. MSCI data provided “as is” without any express or implied warranties.
All seven of the meaningfully sized sectors posted positive returns for the year; all except industrials saw returns in the double digits (Figure 9). Returns across the key sectors ranged from 9.0% (industrials) to 25.4% (consumer staples), performance that compares favorably with 2018, when sector returns were between -9.4% (industrials) and 11.9% (IT). In contrast to its 0.3% return in 2018, consumer staples outperformed all other meaningfully sized sectors in 2019, returning 25.4% and significantly outperforming the next best sector, communication services, which returned 19.2%. Nearly 60% of the consumer staples write-ups were attributed to investments made by funds formed in 2007. On a gross USD-weighted basis, the three largest sectors by market value—consumer discretionary, IT, and healthcare—returned 14.4% during the year. During the same period, the remaining four meaningfully weighted sectors returned 15.4%.
The investment pace in 2019 was slower than that of the previous year (a decrease of about 15%). Companies across five sectors (in rank order: consumer discretionary, healthcare, financials, industrials, and IT) garnered 76% of the capital invested, with healthcare and consumer discretionary alone attracting 45% of all capital. Over the long term, managers in the emerging markets index have allocated 67% of their capital to these five sectors, with nearly half of that amount (32%) going to healthcare and consumer discretionary. Healthcare attracted 20% of the capital invested during the year, 9% more than its long-term norm of 11%; this is the biggest difference between 2019’s invested capital and the long-term trend of any sector listed.
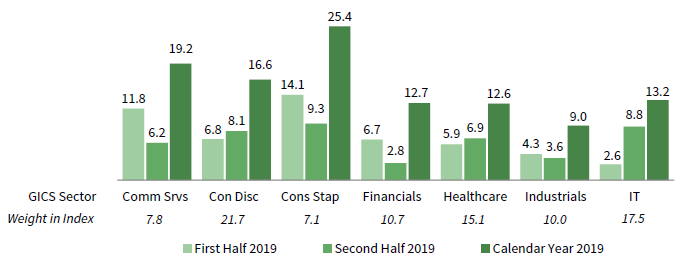
FIGURE 9 EMERGING MARKETS PE AND VC INDEX SECTOR RETURNS:
GROSS COMPANY–LEVEL PERFORMANCE
As of December 31, 2019 • USD Terms • Percent (%)
Source: Cambridge Associates LLC.
Countries
Highlighting the index’s geographic concentration, China remains, by far, the largest country component of the index (Figure 10). India and South Korea continue to be meaningfully sized, and as of the end of 2019, the United States constituted 6.3% of the index. Five other countries—Brazil, Australia, Singapore, Hong Kong, and Japan (from low to high)—represented between 2.1% and 4.6% of the index.
Performance for the meaningfully sized geographies was strong in 2019, with all posting double-digit performance. Returns ranged from 14.5% (India) to 23.3% (United States). For companies in India, 2012, 2014–15, and 2017 vintage funds accounted for the lion’s share of the write-ups during the year. For companies based in the United States, write-ups were widespread. With strong performance across the board, the calendar year gross weighted return for the four countries was 16.8%.
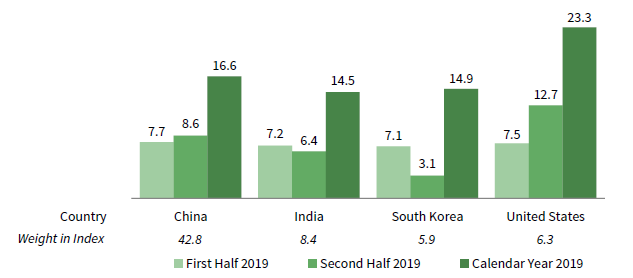
FIGURE 10 EMERGING MARKETS PE AND VC INDEX COUNTRY RETURNS:
GROSS COMPANY–LEVEL PERFORMANCE
As of December 31, 2019 • USD Terms • Percent (%)
Source: Cambridge Associates LLC.
For the year, businesses in China, India, Japan, the United States, and Hong Kong (in rank order) each amassed more than $1.0 billion of invested capital and, together, accounted for almost 70% of the capital deployed. Over the long term, these same countries garnered almost 55% of invested capital, with increases in capital to companies based in China, India, and Japan making up for the difference. China-based companies garnered 36% of invested capital during the year, above the long-term average of 32% and once again the highest amount of any country. India and Japan received the second- and third-most invested capital, at nearly 12% and 10%, respectively, above their long-term averages of 9% and 4%.
LP Cash Flows
Emerging markets PE and VC funds called just shy of $24 billion from investors during 2019, which represents a 17% decrease from the previous year (Figure 11). Despite the reduction in contributions, the year still ranks as the third highest for dollars called since the inception of the index (behind 2017 and the largest, 2018). On the other hand, distributions increased 12.3% year-over-year as managers returned $23.2 billion in capital to investors, making 2019 the second-largest year ever, and only the third time the spread between contributions and distributions was less than $1 billion since 2005. Compared to the developed markets index, emerging markets have seen far fewer distributions but a more consistent increase in PE and VC investment activity year-over-year. While the former might be explained by an overweight in VC, the latter more convincingly reflects a growing appetite for these regions.
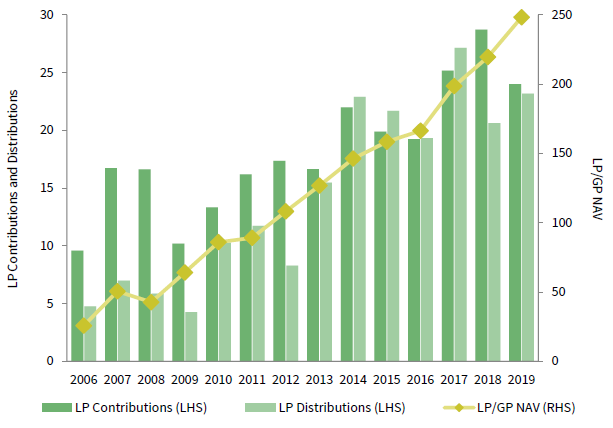
FIGURE 11 EMERGING MARKETS PE AND VC CONTRIBUTIONS,
DISTRIBUTIONS, AND NAV
Calendar Years 2006–19 • USD Billions
Source: Cambridge Associates LLC.
Funds raised in 2014–18 were responsible for most of the capital called in 2019, amounting to $21.2 billion and representing 88.4% of the total. The largest three vintages were 2016–18, which called more than $5 billion each, or double the next largest vintage for capital calls, 2014. LP contributions in 2018 were more widely spread among vintage years, with seven that called capital north of $1 billion. Notably, 2019 vintage funds only called $795 million during the year, while the most recent vintage during the 2018 calendar year called $2.5 billion, more than three times as much.
Funds raised in 2011–14 distributed more than half of the total capital returned to investors during the year. Notably, however, 2007 and 2008 funds also distributed more than $3 billion and $2 billion, respectively, indicating they were able to sell some of their long-held investments. The trend of funds older than ten years distributing significant amounts of capital is a continuation from 2018.
Caryn Slotsky, Senior Investment Director
Wyatt Yasinski, Investment Associate
Drew Carneal, Investment Analyst
Figure Notes
Global ex US Private Equity and Venture Capital Index Returns
The PE/VC indexes are pooled horizon internal rates of return and are based on limited partners’ fund-level performance; the returns are net of fees, expenses, and carried interest. Because the indexes are capitalization weighted, performance is mainly driven by the largest vintage years.
Public index returns are shown as both time-weighted returns (average annual compound returns) and dollar-weighted returns (mPME). The CA Modified Public Market Equivalent replicates private investment performance under public market conditions. The public index’s shares are purchased and sold according to the private fund cash flow schedule, with distributions calculated in the same proportion as the private fund, and mPME net asset value is a function of mPME cash flows and public index returns.
Vintage Year Returns
Vintage year fund-level returns are net of fees, expenses, and carried interest.
Sector Returns
Industry-specific gross company-level returns are before fees, expenses, and carried interest.
GICS Sector Comparisons
The Global Industry Classification Standard (GICS®) was developed by and is the exclusive property and a service mark of MSCI Inc. and S&P Global Market Intelligence LLC and is licensed for use by Cambridge Associates LLC. As a result of the GICS sector definitions changes in 2018, the makeup of the private and public indexes changed and in some cases, impacted the relative over and underweights in the private index. The newest sector, communication services, largely includes companies formerly designated as telecommunications, consumer, and IT. “Other” includes sectors that make up less than 3% of the CA benchmark.
About the Cambridge Associates LLC Indexes
Cambridge Associates derives its Global ex US Developed Markets Private Equity and Venture Capital Index from the financial information contained in its proprietary database of global ex US private equity and venture capital funds. As of December 31, 2018, the database comprised 826 global ex US developed markets buyouts, growth equity, and venture capital funds formed from 1986 to 2018 with a value of about $254 billion. Ten years ago, as of December 31, 2008, the benchmark index included 524 global ex US developed markets funds, whose value was roughly $136 billion. The funds in this index invest primarily in developed markets in Australia, Canada, Israel, Japan, New Zealand, Singapore, and Western Europe.
Cambridge Associates derives its Emerging Markets Private Equity and Venture Capital Index from the financial information contained in its proprietary database of global ex US buyouts, growth equity, and venture capital funds. As of December 31, 2018, the database comprised 674 emerging markets private equity and venture capital funds formed from 1986 to 2018 with a value of about $229 billion. Ten years ago, as of December 31, 2008, the benchmark index included 385 emerging markets funds, whose value was about $44 billion. The funds in this index invest primarily in Africa, emerging Asia, emerging Europe, Latin America & Caribbean, and the Middle East ex Israel.
The pooled returns represent the net periodic rates of return calculated on the aggregate of all cash flows and market values as reported to Cambridge Associates by the funds’ general partners in their quarterly and annual audited financial reports. These returns are net of management fees, expenses, and performance fees that take the form of carried interest.
About the Public Indexes
The MSCI All Country World Index (ACWI) is a free float–adjusted, market capitalization–weighted index designed to measure the equity market performance of developed and emerging markets. As of December 31, 2018, the MSCI ACWI consisted of 49 country indexes comprising 23 developed and 26 emerging markets country indexes. The developed markets country indexes included are: Australia, Austria, Belgium, Canada, Denmark, Finland, France, Germany, Hong Kong, Ireland, Israel, Italy, Japan, the Netherlands, New Zealand, Norway, Portugal, Singapore, Spain, Sweden, Switzerland, the United Kingdom, and the United States. The emerging markets country indexes included are: Argentina, Brazil, Chile, China, Colombia, Czech Republic, Egypt, Greece, Hungary, India, Indonesia, Korea, Malaysia, Mexico, Pakistan, Peru, the Philippines, Poland, Qatar, Russia, Saudi Arabia, South Africa, Taiwan, Thailand, Turkey, and the United Arab Emirates.
The MSCI EAFE Index is a free float–adjusted, market capitalization–weighted index that is designed to measure large- and mid-cap equity performance of developed markets, excluding Canada and the United States. As of December 31, 2018, the MSCI EAFE Index consisted of the following 21 developed markets country indexes: Australia, Austria, Belgium, Denmark, Finland, France, Germany, Hong Kong, Ireland, Israel, Italy, Japan, the Netherlands, New Zealand, Norway, Portugal, Singapore, Spain, Sweden, Switzerland, and the United Kingdom.
The MSCI Emerging Markets Index is a free float–adjusted, market capitalization–weighted index that is designed to measure large- and mid-cap equity performance of emerging markets. As of December 31, 2018, the MSCI Emerging Markets Index included 26 emerging markets country indexes: Argentina, Brazil, Chile, China, Colombia, Czech Republic, Egypt, Greece, Hungary, India, Indonesia, Korea, Malaysia, Mexico, Pakistan, Peru, the Philippines, Poland, Qatar, Russia, Saudi Arabia, South Africa, Taiwan, Thailand, Turkey, and the United Arab Emirates.
The MSCI World Index represents a free float–adjusted, market capitalization–weighted index that is designed to measure the equity market performance of developed markets. As of December 31, 2018, it includes 23 developed markets country indexes: Australia, Austria, Belgium, Canada, Denmark, Finland, France, Germany, Hong Kong, Ireland, Israel, Italy, Japan, the Netherlands, New Zealand, Norway, Portugal, Singapore, Spain, Sweden, Switzerland, the United Kingdom, and the United States.