In the last six months of 2018, in USD terms, the Cambridge Associates LLC Developed Markets ex US Private Equity[1]The private equity index includes buyout and growth equity funds. and Venture Capital (PE/VC) Index returned 2.2%, a sizable drop from the first half results (6.7%) due to a negative return (-1.2%) in the final quarter. For the year, the developed markets index returned 9.2% when measured in USD terms. Due to nearly flat returns in the third and fourth quarters (1.1% and -0.3%, respectively), the Cambridge Associates LLC Emerging Markets Private Equity and Venture Capital Index earned 0.9% for the second half of the year, bringing its full year return to 6.6%. Because the indexes’ returns are measured in US dollars, the currency’s value vis-à-vis the euro impacts performance of the developed markets benchmark. During third and fourth quarters 2018, the US dollar generally strengthened, which dampened performance measured in USD terms (Figure 1); for the year, the index’s return in euros was 14.6%. The developed and emerging markets PE/VC indexes have handily outperformed their public market counterparts across time based on modified public market equivalent (mPME)[2]Cambridge Associates’ mPME calculation is a private-to-public comparison that seeks to replicate private investment performance under public market conditions. returns.
Second Half and Calendar Year 2018 Highlights
- Significant outperformance in recent time periods helped to expand the developed ex US and emerging markets PE/VC indexes dominance over the corresponding public benchmarks (MSCI EAFE and Emerging Markets Indexes) over all time periods ending December 31, 2018, listed in Figure 1. Except for during the three-year period ending in 2018, the developed markets return in euros has exceeded the return based in US dollars.
- Based on market values at December 31, 2018, public companies accounted for a much smaller portion of the developed markets index than the emerging one (about 7% for developed and nearly 19% of emerging).
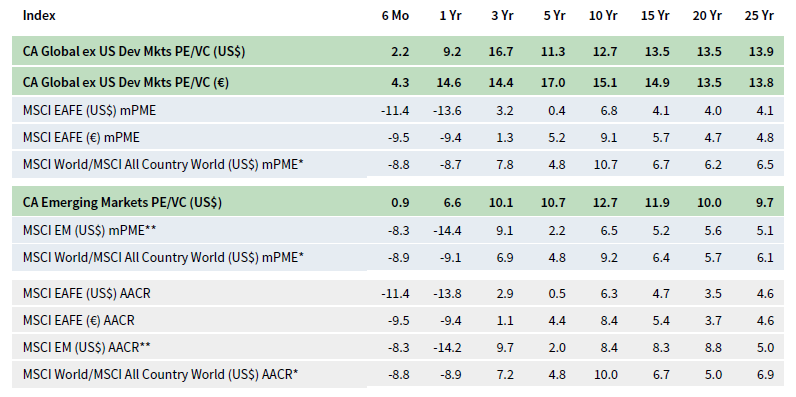
FIGURE 1 GLOBAL EX US PRIVATE EQUITY AND VENTURE CAPITAL INDEX RETURNS
Periods Ended December 31, 2018 • Percent (%)
* MSCI All Country World Constructed Index: Data from 1/1/1986 to 12/31/1987 represented by MSCI World Index gross total return. Data from 1/1/1988 to present represented by MSCI ACWI gross total return.
** MSCI EM Constructed Index: Data from 1/1/1986 to 12/31/1987 represented by GFD Emerging Markets price return. Data from 1/1/1988 to present represented by MSCI Emerging Markets total return gross.
Sources: Cambridge Associates LLC, Global Financial Data, Inc., MSCI Inc., and Thomson Reuters Datastream. MSCI data provided “as is” without any express or implied warranties.
Developed ex US Private Equity and Venture Capital Performance Insights
Vintage Years
During the second half of 2018, six of the nine meaningfully sized vintage years (those that represented at least 5% of the index’s value) earned positive returns; the three exceptions were vintages 2006, 2010, and 2012. Combined, the nine vintages accounted for 89% of the benchmark’s value (Figure 2) and returns ranged from -2.4% (2006 and 2012) to 7.6% (2016) for the two-quarter period. Write-ups for IT were by far the largest contributor to the 2016 vintage year’s strong return. In the 2006 and 2012 vintages, write-downs were widespread. In the 2006 vintage, write-downs in financials, industrials, and IT far outnumbered write-ups in healthcare companies. In the 2012 group, the only sector with significant write-ups was IT.

FIGURE 2 DEVELOPED MARKETS EX US PE/VC INDEX VINTAGE YEAR RETURNS: NET FUND-LEVEL PERFORMANCE
As of December 31, 2018 • USD Terms • Percent (%)
Source: Cambridge Associates LLC.
For the year, all but one of the nine large vintage years (2010) posted positive returns and the range among them was wide, -3.4% to 17.1% (2013). In the best-performing group, vintage 2013, write-ups in consumer discretionary, healthcare, and IT were the key drivers of success. Conversely, consumer discretionary write-downs were the downfall of the 2010 vintage’s performance.
Compared with the previous six-month period (January 2018 – June 2018), limited partner (LP) contributions were higher and distributions were lower (in USD terms) in second half 2018, with a bigger swing in contributions than in distributions. Developed markets PE/VC funds called $19.6 billion from investors, a 60% increase, and distributions totaled $28.8 billion, a 4% decline. While distributions outpaced contributions during the second half of the year, they trailed in the last three months (the first time since fourth quarter 2012). Distributions have outpaced contributions since the beginning of 2011 (Figure 3).

FIGURE 3 GLOBAL EX US DEVELOPED MARKETS PE/VC CONTRIBUTIONS, DISTRIBUTIONS, AND NET ASSET VALUE (NAV)
Calendar Years 2006–18 • USD Billions
Source: Cambridge Associates LLC.
Managers of funds raised from 2013 to 2016 called $17.0 billion, or 87% of the total capital called during the last two quarters. All called more than $2.5 billion, with the 2016 vintage calling almost $6.8 billion. Nine vintages, 2005–13, each distributed at least $1.0 billion for a combined amount of $26.4 billion (92% of total distributions). The 2012 vintage year led the way, distributing $8.1 billion.
During the year, managers in the developed markets PE/VC index called $31.9 billion and distributed $58.9 billion, and both totals were lower than in 2017 (when they were $37.2 billion and $63.7 billion, respectively). The 2012–16 vintages accounted for 89% ($28.5 billion) of the year’s capital calls. Vintages 2006, 2007, and 2011–13 all distributed more than $5 billion for a combined total of $45.3 billion (or 77% of all distributions).
Sectors
Figure 4 shows the GICS sector breakdown of the Developed ex US Markets Private Equity and Venture Capital Index and a public market counterpart, the MSCI EAFE Index. The breakdown provides context when comparing the performance of the two indexes. The chart highlights the relative overweights in the PE/VC index, most notably in consumer discretionary, IT, and healthcare, and the considerable underweights in financials and consumer staples.

FIGURE 4 CA DEVELOPED MARKETS EX US PE/VC VS MSCI EAFE
As of December 31, 2018 • GICS Sector Comparisons • Percent (%)
Source: Cambridge Associates LLC.
Five of the eight meaningfully sized sectors earned positive returns for second half 2018 in USD terms, and all eight did in EUR terms, as performance in euros was stronger than in USD terms (Figure 5). Among the key sectors, IT earned the highest return and industrials the lowest. All vintages from 2007 through 2016 saw gains in the IT sector. Write-downs in the industrials sector in vintages 2006, 2008, and 2012 more than offset gains in other years. The index’s four largest sectors—consumer discretionary, IT, healthcare, and industrials (in rank order)—represented 71% of its value, returning 2.3% on a gross USD-weighted basis and 4.5% on a EUR-weighted basis.
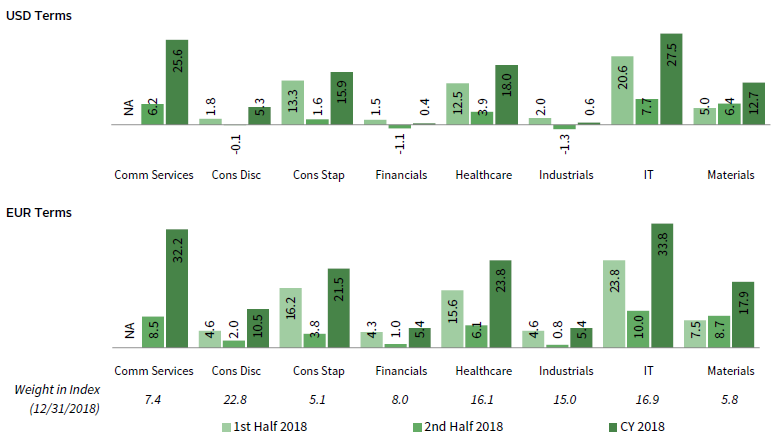
FIGURE 5 DEVELOPED MARKETS EX US PE/VC INDEX SECTOR RETURNS: GROSS COMPANY-LEVEL PERFORMANCE
As of December 31, 2018 • Percent (%)
Source: Cambridge Associates LLC.
Calendar year returns for the eight key sectors were positive in USD and EUR terms, but for financials and industrials, those returns were less than 1% (in USD). IT companies produced the highest return for the year, with communication services a close second. IT returns were strong across nearly all vintages and communication services write-ups were driven by vintage years 2005, 2011–12. For the two sectors that struggled most, write-downs in financials were most significant in vintages 2006 and 2012, and for industrials, write-downs were largest in vintages 2007–8 and 2012. In USD and EUR terms, the index’s four largest sectors returned 11.6% and 17.1%, respectively.
Healthcare, industrials, consumer (discretionary and staples combined), IT, and materials companies (in rank order) attracted almost 87% of the capital invested during second half 2018; healthcare and industrials together garnered more than 40% of the total deployed. For the year, those sectors attracted nearly 84% of the capital invested, led by the combined consumer sector (about 23%) and healthcare (about 19%). Since the inception of the index, managers invested about 78% in these six sectors; historically, nearly half of all invested capital went toward the two consumer sectors and industrials.
Countries
In USD terms, all but one of the seven meaningfully sized countries in the index (accounting for 71% of its value) posted positive returns during the last two quarters (Figure 6); as with the sectors, returns in EUR terms were higher, helping two of the large countries produce double-digit returns. Companies based in the Netherlands (a top performer in the second half of 2017 and the first half of 2018) were the best performing; only one vintage between 2006 and 2015 (2012) had meaningful write-downs, and the highest write-ups were in the 2013 fund group. For the US companies—the worst performers among the large countries—write-downs were fairly widespread but not extreme in any vintage. For the six-month period, the gross USD-weighted return for the three largest countries—the United Kingdom, the United States,[3]Funds in the developed markets ex US PE/VC benchmark primarily invest in companies in Europe, but occasionally make investments in US companies as well. This is particularly true of “global” … Continue reading and Germany—was 0.9%, almost 150 basis points (bps) lower than the index’s total gross return.
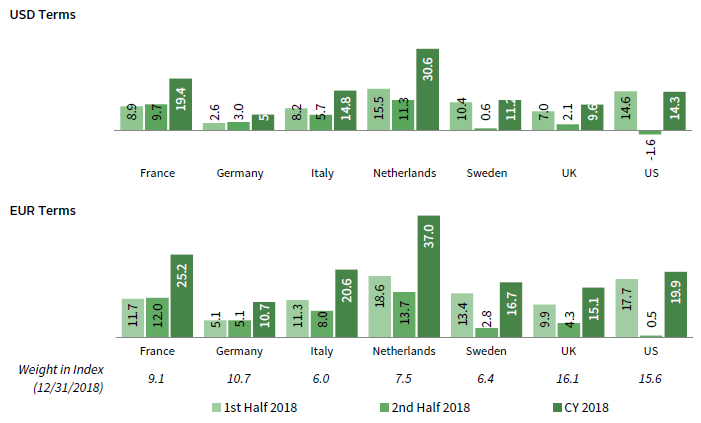
FIGURE 6 DEVELOPED MARKETS EX US PE/VC INDEX COUNTRY RETURNS: GROSS COMPANY-LEVEL PERFORMANCE
As of December 31, 2018 • Percent (%)
Source: Cambridge Associates LLC.
During the year, companies in five of the seven key countries produced double-digit positive returns. The two exceptions were the United Kingdom and Germany (two of the three largest country constituents of the index). Write-ups for Netherlands-based companies were highest in vintage years 2007 and 2013 (more than $1 billion in each group). For German companies, the worst performers for the year, write-ups were middling (the highest amount was in vintage 2014 and totaled less than $500 million) and somewhat offset by write-downs in a few vintages, the most pronounced of which were in vintage year 2015. The calendar year gross dollar-weighted return for the three largest countries was 10.4%, almost 140 bps shy of the whole index.
Companies in the United Kingdom, Germany, France, Sweden, the Netherlands, Italy, and Luxembourg (in rank order) attracted more than 71% of the capital invested during the year, about 8%% higher than the long-term norm for those countries combined. Notably, managers allocated nearly 5% less than they have historically to businesses in the United Kingdom and about 5% more to companies in Luxembourg. US-based investments garnered approximately 5% of the capital deployed by managers in the developed markets index in 2018, less than half the long-term norm of 12%.
Emerging Markets Private Equity and Venture Capital Performance Insights
Vintage Years
During the second half 2018, nine vintage years (2007, 2008, 2010–16) accounted for at least 5% of the emerging markets PE/VC index’s value; combined, the nine represented 88% of the index’s value (Figure 7). Five of the nine vintages produced negative returns for second half 2018, contributing to moderate calendar year performance for the index (6.6%).
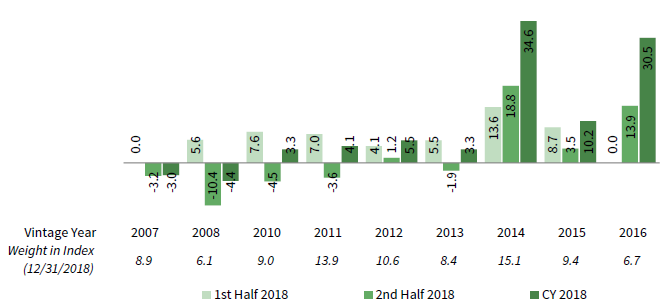
FIGURE 7 EMERGING MARKETS PE/VC INDEX VINTAGE YEAR RETURNS: NET FUND-LEVEL PERFORMANCE
Calendar Years 2006–18 • USD Billions
Source: Cambridge Associates LLC.
Performance among the large vintages in the second half and for the year was quite varied—2008 and 2014 were the worst and best vintages for both time periods, with returns ranging from -10.4% (2008) to 18.8% (2014) in the second half, and -4.4% (2008) to 34.6% (2014) for the full year. In the second half 2018 and for the full calendar year, write-ups in consumer discretionary companies were the main driver of return for the best-performing and largest vintage, 2014. Write-offs in IT were primarily responsible for the negative performance posted by the lowest-returning and smallest vintage, 2008.
During the second half, emerging markets PE/VC funds called $14.0 billion from investors, only a 3% increase from the first half of the year, but still marking the half-year period with the most capital called since the inception of the index. In line with the calling pattern during the second half 2018, emerging markets PE/VC managers also called a historic amount of capital for the year; managers called $27.5 billion in 2018, the most in any year (the second highest Is 2017). Managers distributed just over $10.3 billion in the second half, which represented a slight decrease from the prior six-month period. For the calendar year, managers distributed $21.4 billion, a decrease of 23% from the prior year. Unlike in other regions, LP contributions outnumbered distributions for the year (Figure 8), though, notably, there have been only five years since the inception (1986) of the emerging markets index when distributions were higher than contributions.
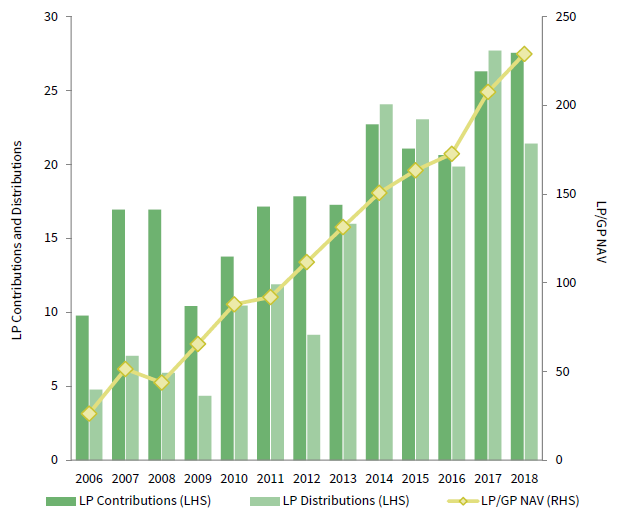
FIGURE 8 GLOBAL EX US EMERGING MARKETS PE/VC CONTRIBUTIONS, DISTRIBUTIONS, AND NET ASSET VALUE (NAV)
Calendar Years 2006–18 • USD Billions
Source: Cambridge Associates LLC.
Managers of funds raised in 2013–18 called the majority of capital in second half 2018, totaling more than $12.3 billion and about 88% of all capital called in the period. Each of those vintages called more than $1.3 billion, with 2014, 2016, and 2017 calling more than $2.1 billion. On the distributions front, managers in four vintage years (2007–08, 2010, and 2012) returned at least $1.0 billion to LPs, for a combined total of $6.0 billion, or 58% of the period’s total. Managers in the 2008 vintage, the smallest vintage of those meaningfully sized, returned the most capital, topping $2.1 billion for second half 2018.
Sectors
Figure 9 shows the GICS sector breakdown of the Emerging Markets PE/VC Index and a public market counterpart, the MSCI Emerging Markets Index. The breakdown provides context when comparing the performance of the two indexes. The chart highlights the relative overweights in the PE/VC index, such as consumer discretionary, healthcare, industrials, and IT, and the underweights in communication services, energy, financials, and materials.

FIGURE 9 CA EMERGING MARKETS PE/VC VS MSCI EMERGING MARKETS
As of December 31, 2018 • GICS Sector Comparisons • Percent (%)
Source: Cambridge Associates LLC.
Five of the seven meaningfully sized sectors posted positive second half returns (Figure 10). For calendar year 2018, industrials was the only sector to have negative returns. And despite negative performance in the second half, returning -5.9%, IT outperformed all other meaningfully sized sectors for the year, returning 11.9%. In second half 2018, over 75% of the IT write-downs were attributed to investments made by funds formed in 2008. For the year, sector returns were negative to average, ranging from -9.4% (industrials) to 11.9% (IT), performance that compares poorly with the much stronger 2017, when sector returns were between 22.1% (healthcare) and 30.9% (financials). On a gross USD-weighted basis, the three largest sectors by market value—IT, consumer discretionary, and healthcare—returned -2.1% during the second half, underperforming the return for all companies by 100 bps.
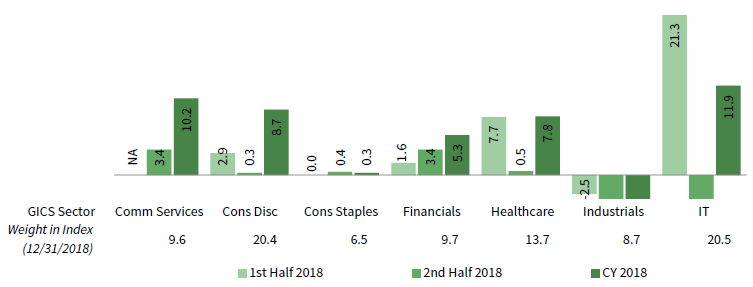
FIGURE 10 EMERGING MARKETS PE/VC INDEX SECTOR RETURNS: GROSS COMPANY-LEVEL PERFORMANCE
As of December 31, 2018 • USD Terms • Percent (%)
Source: Cambridge Associates LLC.
Second-half investment pace was slightly slower than the previous six-month period (a decrease of about 12%). Companies across five sectors (in rank order: healthcare, consumer discretionary, financials, IT, and industrials) garnered 75% of the capital invested in the last six months of 2018, with healthcare and consumer discretionary alone attracting almost 40% of all capital. Over the long term, managers in the emerging markets index have allocated 66% of their capital to these five sectors, with healthcare accounting for the biggest difference between the most recent six months (20%) and the long-term norm (11%).
Countries
Highlighting the index’s geographic concentration, China remains, by far, the largest country component of the index (Figure 11). India and South Korea have continued to be meaningfully sized, and as of the end of 2018, the United States constituted 6.5% of the index.[4]Funds in the emerging markets PE/VC benchmark occasionally invest in companies in developed markets regions, as well as the emerging markets regions. Five other countries—Australia, Brazil, Hong Kong, Japan, and Singapore—represented between 2.0% and 3.5% of the index.
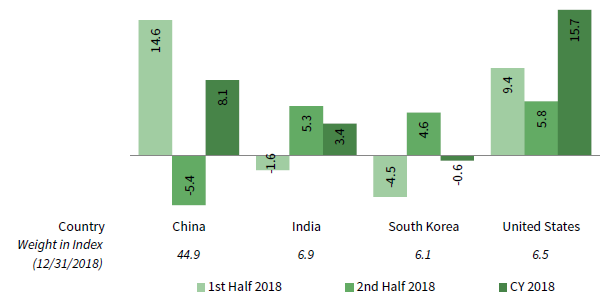
FIGURE 11 EMERGING MARKETS PE/VC INDEX COUNTRY RETURNS: GROSS COMPANY-LEVEL PERFORMANCE
As of December 31, 2018 • USD Terms • Percent (%)
Source: Cambridge Associates LLC.
Performance for the meaningfully sized geographies was middling for the second half 2018, ranging from -5.4% (China) to 5.8% (United States). Companies in China had negative returns in the second half, trailing positive performance in the first half (14.6%), with 2007–08 and 2011 vintage funds accounting for the majority of write-downs during the period. When combined, companies based in China, India, South Korea, and the United States returned -2.4% on a gross USD-weighted basis, about 130 bps less than the full index in the second half 2018. China-based companies garnered 45% of invested capital in the second half 2018, once again receiving more capital than any other country. Surprisingly, and in alignment with the first half 2018, the United States received the second-highest amount of capital, roughly 13% of all invested capital in the second half 2018, and about 5% more than the long-term average.
During the year, South Korea was the only country of those meaningfully sized to post a negative return. Companies based in the United States had the best performance, returning 15.7% for the year; write-ups were widespread and not concentrated to any specific vintage(s). Although performance varied across the largest countries, the calendar year gross weighted return for the four countries was 7.3%, slightly above the index return of 6.0%. For the year, China, the United States, India, South Korea, and Australia (in rank order) each amassed more than $1.0 billion of invested capital and, together, accounted for over 70% of the capital deployed. Over the long term, these same countries garnered 61% of invested capital, with increases in capital to companies based in China and the United States making up for the difference. Once again, China led the way in 2018, collecting 40% of all invested capital for the year, and above the long-term average of 34%. ■
Caryn Slotsky, Senior Investment Director
Sarah Grifferty, Senior Investment Associate
Wyatt Yasinski, Investment Associate
Figure Notes
Global ex US Private Equity and Venture Capital Index Returns
The PE/VC indexes are pooled horizon internal rates of return and are based on limited partners’ fund-level performance; the returns are net of fees, expenses, and carried interest. Because the indexes are capitalization weighted, performance is mainly driven by the largest vintage years.
Public index returns are shown as both time-weighted returns (average annual compound returns) and dollar-weighted returns (mPME). The CA Modified Public Market Equivalent replicates private investment performance under public market conditions. The public index’s shares are purchased and sold according to the private fund cash flow schedule, with distributions calculated in the same proportion as the private fund, and mPME net asset value is a function of mPME cash flows and public index returns.
Vintage Year Returns
Vintage year fund-level returns are net of fees, expenses, and carried interest.
Sector Returns
Industry-specific gross company-level returns are before fees, expenses, and carried interest.
GICS Sector Comparisons
The Global Industry Classification Standard (GICS®) was developed by and is the exclusive property and a service mark of MSCI Inc. and S&P Global Market Intelligence LLC and is licensed for use by Cambridge Associates LLC. As a result of the GICS sector definitions changes in 2018, the makeup of the private and public indexes changed and in some cases, impacted the relative over and underweights in the private index. The newest sector, communication services, largely includes companies formerly designated as telecommunications, consumer, and IT. “Other” includes sectors that make up less than 3% of the CA benchmark.
About the Cambridge Associates LLC Indexes
Cambridge Associates derives its Global ex US Developed Markets Private Equity and Venture Capital Index from the financial information contained in its proprietary database of global ex US private equity and venture capital funds. As of December 31, 2018, the database comprised 826 global ex US developed markets buyouts, growth equity, and venture capital funds formed from 1986 to 2018 with a value of about $254 billion. Ten years ago, as of December 31, 2008, the benchmark index included 524 global ex US developed markets funds, whose value was roughly $136 billion. The funds in this index invest primarily in developed markets in Australia, Canada, Israel, Japan, New Zealand, Singapore, and Western Europe.
Cambridge Associates derives its Emerging Markets Private Equity and Venture Capital Index from the financial information contained in its proprietary database of global ex US buyouts, growth equity, and venture capital funds. As of December 31, 2018, the database comprised 674 emerging markets private equity and venture capital funds formed from 1986 to 2018 with a value of about $229 billion. Ten years ago, as of December 31, 2008, the benchmark index included 385 emerging markets funds, whose value was about $44 billion. The funds in this index invest primarily in Africa, emerging Asia, emerging Europe, Latin America & Caribbean, and the Middle East ex Israel.
The pooled returns represent the net periodic rates of return calculated on the aggregate of all cash flows and market values as reported to Cambridge Associates by the funds’ general partners in their quarterly and annual audited financial reports. These returns are net of management fees, expenses, and performance fees that take the form of carried interest.
About the Public Indexes
The MSCI All Country World Index (ACWI) is a free float–adjusted, market capitalization–weighted index designed to measure the equity market performance of developed and emerging markets. As of December 31, 2018, the MSCI ACWI consisted of 49 country indexes comprising 23 developed and 26 emerging markets country indexes. The developed markets country indexes included are: Australia, Austria, Belgium, Canada, Denmark, Finland, France, Germany, Hong Kong, Ireland, Israel, Italy, Japan, the Netherlands, New Zealand, Norway, Portugal, Singapore, Spain, Sweden, Switzerland, the United Kingdom, and the United States. The emerging markets country indexes included are: Argentina, Brazil, Chile, China, Colombia, Czech Republic, Egypt, Greece, Hungary, India, Indonesia, Korea, Malaysia, Mexico, Pakistan, Peru, the Philippines, Poland, Qatar, Russia, Saudi Arabia, South Africa, Taiwan, Thailand, Turkey, and the United Arab Emirates.
The MSCI EAFE Index is a free float–adjusted, market capitalization–weighted index that is designed to measure large- and mid-cap equity performance of developed markets, excluding Canada and the United States. As of December 31, 2018, the MSCI EAFE Index consisted of the following 21 developed markets country indexes: Australia, Austria, Belgium, Denmark, Finland, France, Germany, Hong Kong, Ireland, Israel, Italy, Japan, the Netherlands, New Zealand, Norway, Portugal, Singapore, Spain, Sweden, Switzerland, and the United Kingdom.
The MSCI Emerging Markets Index is a free float–adjusted, market capitalization–weighted index that is designed to measure large- and mid-cap equity performance of emerging markets. As of December 31, 2018, the MSCI Emerging Markets Index included 26 emerging markets country indexes: Argentina, Brazil, Chile, China, Colombia, Czech Republic, Egypt, Greece, Hungary, India, Indonesia, Korea, Malaysia, Mexico, Pakistan, Peru, the Philippines, Poland, Qatar, Russia, Saudi Arabia, South Africa, Taiwan, Thailand, Turkey, and the United Arab Emirates.
The MSCI World Index represents a free float–adjusted, market capitalization–weighted index that is designed to measure the equity market performance of developed markets. As of December 31, 2018, it includes 23 developed markets country indexes: Australia, Austria, Belgium, Canada, Denmark, Finland, France, Germany, Hong Kong, Ireland, Israel, Italy, Japan, the Netherlands, New Zealand, Norway, Portugal, Singapore, Spain, Sweden, Switzerland, the United Kingdom, and the United States.
Footnotes