Overview
In third quarter 2017, in USD terms, the Cambridge Associates LLC Global ex US Developed Markets Private Equity and Venture Capital Index (PE/VC) returned 5.4% to bring its year-to-date performance to 21.0%. The Cambridge Associates LLC Emerging Markets Private Equity and Venture Capital Index earned 4.4% in third quarter, bringing its nine-month return to 12.2%. Throughout the first three quarters of 2017, the euro gained strength against the US dollar, helping to boost the developed markets index return when measured in USD terms (Figure 1). The developed markets PE/VC index has equaled or outperformed its public market counterparts across time horizons, while the emerging markets PE/VC index only trails its public market peers in the most recent time periods (based on modified public market equivalent [mPME] returns).
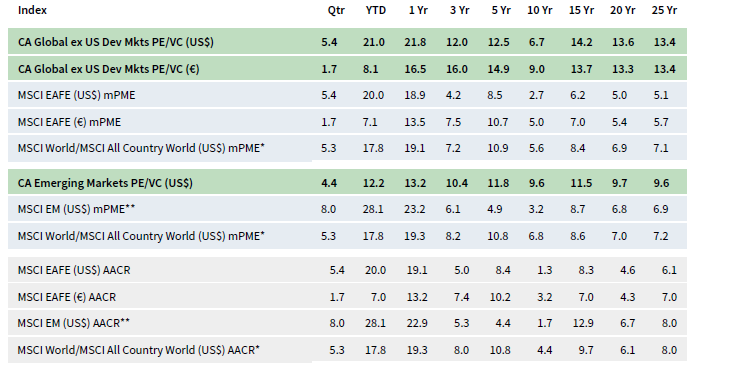
FIGURE 1 US PRIVATE EQUITY AND VENTURE CAPITAL INDEX RETURNS
Periods Ended September 30, 2017 • Percent (%)
Sources: Cambridge Associates LLC, Global Financial Data, Inc., MSCI Inc., and Thomson Reuters Datastream. MSCI data provided “as is” without any express or implied warranties.
Notes: The PE/VC indexes are pooled horizon internal rates of return and are based on limited partners’ fund-level performance; the returns are net of fees, expenses, and carried interest. Because the indexes are capitalization weighted, performance is mainly driven by the largest vintage years. Public index returns are shown as both time-weighted returns (average annual compound returns) and dollar-weighted returns (modified public market equivalent). Returns are annualized, with the exception of returns less than one year, which are cumulative. The CA mPME replicates private investment performance under public market conditions. The public index’s shares are purchased and sold according to the private fund cash flow schedule, with distributions calculated in the same proportion as the private fund, and mPME net asset value is a function of mPME cash flows and public index returns.
* MSCI All Country World Constructed Index: Data from 1/1/1986 to 12/31/1987 represented by MSCI World Index gross total return. Data from 1/1/1988 to present represented by MSCI ACWI gross total return.
** MSCI EM Constructed Index: Data from 1/1/1986 to 12/31/1987 represented by GFD Emerging Markets price return. Data from 1/1/1988 to present represented by MSCI Emerging Markets total return gross.
Third Quarter 2017 Highlights
- The developed markets PE/VC index’s performance was equal to or better than the comparable public equity index (MSCI EAFE Index), based on mPME returns, for all time periods ending September 30, 2017, listed in Figure 1. The emerging markets PE/VC index continued its recent struggles against its corresponding public market benchmark (MSCI Emerging Markets Index) but outperformed it over the medium and long term.
- The primary geographical components of the ex US PE/VC indexes have remained constant with Western European countries dominating the developed markets index and China, India, and South Korea continuing to represent the largest countries in the emerging markets benchmark.
- Based on market values on September 30, 2017, public companies accounted for more of the emerging markets PE/VC index than the developed markets one, about 17% and 7%, respectively.
Global ex US Developed Markets Private Equity and Venture Capital Performance Insights
- During third quarter 2017, all eight meaningfully sized vintage years (those that represented at least 5% of the index’s value) earned positive returns. Combined, the eight vintages represented almost 87% of the benchmark’s value (Figure 2) and third quarter returns ranged from 0.7% to 9.0%. In addition to having healthy write-ups for consumer discretionary, financials, IT, health care, and industrials companies (in rank order), the best-performing vintage, 2014, did not have a sector suffer meaningful losses. In the lowest-performing vintage, 2010, write-downs and write-ups across sectors were essentially equal. For the largest vintage, 2012, widespread write-ups (led by IT, industrials, and materials) were partially offset by write-downs in consumer staples.
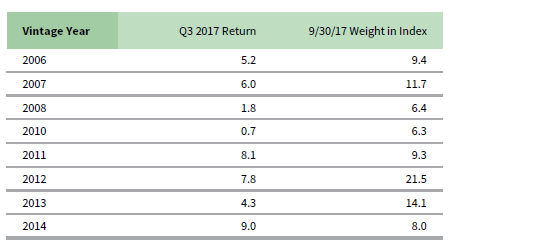
FIGURE 2 GLOBAL EX US DEVELOPED MARKETS PE/VC INDEX
VINTAGE YEAR RETURNS: NET FUND-LEVEL PERFORMANCE
Percent (%)
Notes: Returns in USD terms. Vintage year fund-level returns are net of fees, expenses, and carried interest.
- Limited partner (LP) contributions ($8.8 billion) were roughly equal to the previous quarter’s total ($8.6 billion) and in line with the 15-year average. At $14.0 billion for the quarter, distributions saw a quarter-over-quarter decline of about 22%. Distributions continued to outpace contributions; since the beginning of 2011, fund managers have distributed 1.7 times as much as they’ve called. Conversely, in the previous five years (2006–10), managers called 1.4 times as much capital as they distributed.
- Managers of funds raised from 2013 to 2016 called $7.7 billion, or 88% of the total capital called during the quarter. All four vintages called more than $1.0 billion. The 2014 vintage called the most capital, $3.4 billion. Seven vintages, 2005, 2007–08, and 2010–13, each distributed more than $1.1 billion for a combined total of $12.1 billion (86% of the total); vintages 2005 and 2011 led the way with more than $2.2 billion of distributions each.
- Figure 3 shows the GICS sector breakdown of the Global ex US Developed Markets PE/VC Index and its public market counterpart, the MSCI EAFE Index. The breakdown provides context when comparing the performance of the two indexes. The chart highlights the relative overweights in the PE/VC index, such as consumer discretionary, IT, health care, and industrials, and the underweights in financials and consumer staples.
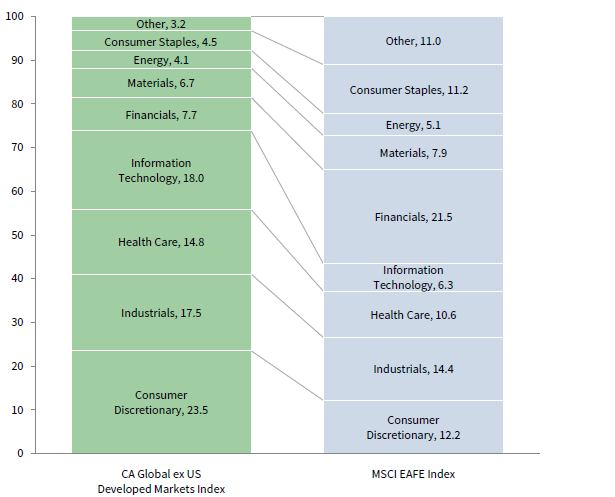
FIGURE 3 GICS SECTOR COMPARISONS: CA GLOBAL EX US DEVELOPED MARKETS
vs MSCI EAFE
As of September 30, 2017 • Percent (%)
Sources: Cambridge Associates LLC, FactSet Research Systems, and MSCI Inc. MSCI data provided “as is” without any express or implied warranties.
Notes: The Global Industry Classification Standard (GICS®) was developed by and is the exclusive property and a service mark of MSCI Inc. and S&P Global Market Intelligence LLC and is licensed for use by Cambridge Associates. Other includes sectors that make up less than 2% of the CA benchmark.
- All six meaningfully sized sectors earned positive returns for the quarter in both USD and euro terms, although performance was much lower in euros given the currency’s strengthening (Figure 4). Among the key sectors, IT posted the highest return and financials the lowest. The 2007 and 2012 vintages were the primary drivers of the IT sector’s performance. Write-ups for financial companies in vintages 2012–14 were partially offset by write-downs in the 2010 vintage. The four largest sectors—consumer discretionary, IT, industrials, and health care (in rank order)—represented 74% of the index’s value and, on a dollar-weighted basis, returned 7.1%.
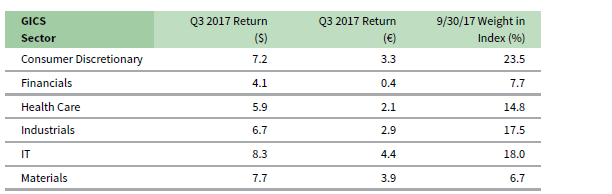
FIGURE 4 GLOBAL EX US DEVELOPED MARKETS PE/VC INDEX SECTOR RETURNS:
GROSS COMPANY-LEVEL PERFORMANCE
Percent (%)
Note: Industry-specific gross company-level returns are before fees, expenses, and carried interest.
- Leading all sectors, consumer (discretionary and staples combined) companies attracted almost 40% of the capital invested during the quarter. The next three largest sectors by investment were health care, IT, and industrials, which together garnered almost the same amount as the consumer companies.
- In USD terms, all seven large countries in the index (accounting for almost 70% of its value) earned positive returns during third quarter (Figure 5); as with the sectors, returns in EUR terms were lower, most notably for US-based businesses, whose return turned negative when calculated in euros. Companies based in Germany returned 13.3% (the best among the large countries), while US companies eked out a 0.4% return (in USD terms). German IT companies helped boost the country’s return for the quarter; vintage years 2007 and 2012 were the biggest contributors to the country’s performance as a whole. For the US-based companies, solid health care performance was muted by lackluster and negative returns in the IT and consumer sectors, respectively. For the quarter, the gross dollar-weighted return for the three largest countries—the United Kingdom, the United States, and Germany—was 5.4%, about 50 basis points lower than the index’s total gross return.[1]Funds in the global ex US developed markets PE/VC index primarily invest in companies in Europe, but occasionally make investments in US companies as well.
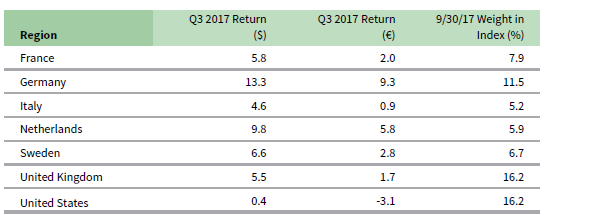
FIGURE 5 GLOBAL EX US DEVELOPED MARKETS PE/VC INDEX REGIONAL RETURNS:
GROSS COMPANY-LEVEL PERFORMANCE
Percent (%)
Note: Geographic region–specific gross company-level returns are before fees, expenses, and carried interest.
- Companies in developed European countries attracted 70% of the capital invested during the quarter, 6% shy of the long-term norm for the region. Investment in US-based companies (almost 20% of total) was about 7% higher than what it has been historically in the global ex US manager index.
Emerging Markets Private Equity Performance Insights
- As of third quarter, there were nine vintage years (2007–15) that accounted for at least 5% of the index’s value; combined, the nine represented over 90% of the index’s value (Figure 6). Across the top-sized vintage years, third quarter returns were widely dispersed, ranging from 0.0% (vintage year 2008) to 12.4% (vintage 2015). Throughout 2017, vintage year 2011 was consistently the largest, representing 17% of the index’s value. Prior to 2017, the 2007 vintage was the largest.
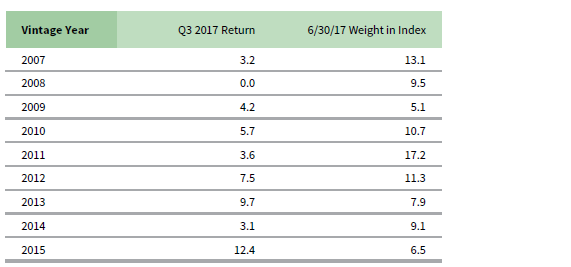
FIGURE 6 EMERGING MARKETS PE/VC INDEX VINTAGE YEAR RETURNS:
NET FUND-LEVEL PERFORMANCE
Percent (%)
Notes: Returns in USD terms. Vintage year fund-level returns are net of fees, expenses, and carried interest.
- Write-ups in materials and consumer staples were the main drivers for the best-performing vintage, 2015—somewhat atypical sectors to be driving performance. Returns for 2015 were also boosted by the consumer discretionary sector. The lowest-returning vintage, 2008, was positively impacted by write-ups in IT but other sectors’ valuations were down or flat.
- During third quarter, emerging markets PE/VC funds called $6.8 billion from investors, a greater than 41% increase from the prior quarter, making it the fourth largest quarter for capital calls since the inception of the index in 1986. Managers distributed nearly $8.8 billion this quarter, which represented a 19% quarter-to-quarter increase. More significantly, third quarter distributions amounted to the largest since the inception of the index and year-to-date distributions are on track to make 2017 the best year for cash outflows. Since 1986, distributions have outpaced contributions in only 15% of the quarters, but in the past five years they have outpaced contributions in half of the quarters.
- Managers of funds that were raised from 2012 to 2016 called about $5.9 billion or 87% of the total for the quarter; of those vintages, 2012, 2014, and 2015 all called more than $1.2 billion. On the distributions front, managers in four vintage years (2006, 2007, 2010, and 2012) returned at least $850 million to LPs, for a combined total of almost $6.0 billion, or 68% of the quarter’s total. Distributions from the 2007 vintage led all vintages this quarter, at almost $3.0 billion, accounting for one-third of the total distributions.
- Figure 7 shows the GICS sector breakdown of the Emerging Markets PE/VC Index and its public market counterpart, the MSCI Emerging Markets Index. The breakdown provides context when comparing the performance of the two indexes. The chart highlights the relative overweights in the PE/VC index, such as consumer discretionary, health care, and industrials, and the underweights in financials, energy, and materials.
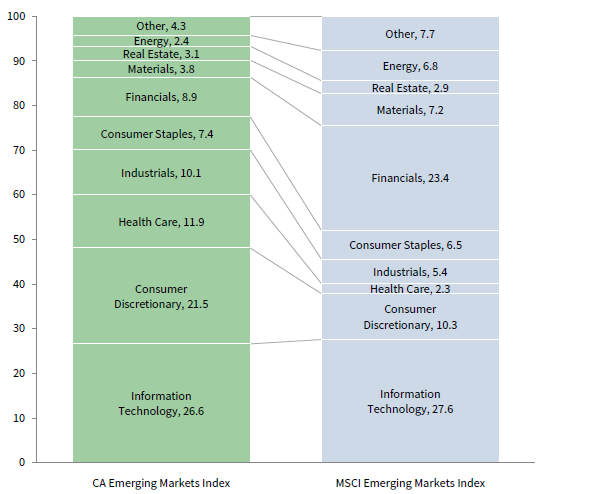
FIGURE 7 GICS SECTOR COMPARISONS: CA EMERGING MARKETS
vs MSCI EMERGING MARKETS
As of September 30, 2017 • Percent (%)
Sources: Cambridge Associates LLC, FactSet Research Systems, and MSCI Inc. MSCI data provided “as is” without any express or implied warranties.
Notes: The Global Industry Classification Standard (GICS®) was developed by and is the exclusive property and a service mark of MSCI Inc. and S&P Global Market Intelligence LLC and is licensed for use by Cambridge Associates. Other includes sectors that make up less than 2% of the CA benchmark.
- All six of the meaningfully sized sectors posted positive quarterly returns over 5.0% (Figure 8); returns were highest for consumer staples at 8.3%. Almost all of the consumer staples write-ups were attributed to investments made by funds formed in 2011, 2012, and 2015. Returns for the other five sectors ranged from 5.4% to 8.1%, with consumer discretionary posting the lowest return in the group. On a gross, dollar-weighted basis, the three largest sectors by market value—IT, consumer discretionary, and health care—collectively returned 5.7%, relatively on par with the gross return for all companies at 6.0%.
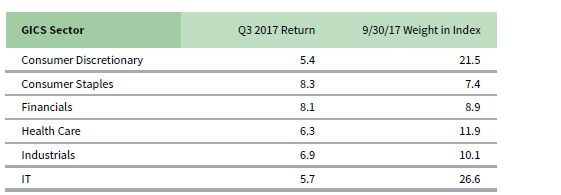
FIGURE 8 EMERGING MARKETS PE/VC INDEX SECTOR RETURNS:
GROSS COMPANY-LEVEL PERFORMANCE
Percent (%)
Notes: Returns in USD terms. Industry-specific gross company-level returns are before fees, expenses, and carried interest.
- Compared with second quarter, the investment pace in the third was faster (an increase of more than 50%). Companies across four sectors (in rank order: consumer discretionary, IT, health care, and financials) garnered 84% of the capital invested in the quarter; consumer discretionary and IT alone attracted nearly 58% of all capital. Over the long term, managers in the emerging markets index have allocated over 60% of their capital to these four sectors, and roughly 41% to consumer discretionary and IT.
- Highlighting the index’s geographic concentration, China continued to be by far the largest country component of the index; India and South Korea were the only other countries that qualified as meaningfully sized (Figure 9). Four other countries—Australia, Hong Kong, Japan, and the United States—represented between 2.5% and 4.5% of the index.[2]Funds in the global ex US emerging markets PE/VC index may occasionally invest in companies in developed markets regions as well as the emerging markets regions. In contrast to the previous quarter, Brazil and Singapore no longer represent even 2.5% of the index’s value.
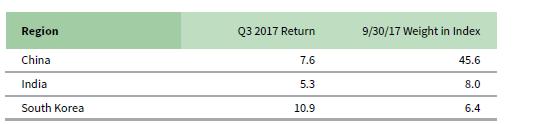
FIGURE 9 EMERGING MARKETS PE/VC INDEX REGIONAL RETURNS:
GROSS COMPANY-LEVEL PERFORMANCE
Percent (%)
- China-based companies continued to receive more capital than any other country, almost 40% of the total for the quarter. Combined, companies in China, South Korea, and, surprisingly, the United Kingdom garnered the most interest, slightly more than 60% of dollars invested during the quarter. Cash flows into South Korean and UK companies increased by 7% in each country this quarter over their long-term trend. In contrast, companies in Singapore, Japan, and Brazil saw less interest this quarter, as compared to their long-term average.
- On a gross dollar-weighted basis, when combined, China, India, and South Korea returned nearly 7.6%. Among countries representing at least 2.5% of the index, Hong Kong earned the best return, 13.3%.
About the Cambridge Associates LLC Indexes
Cambridge Associates derives its Global ex US Developed Markets Private Equity and Venture Capital Index from the financial information contained in its proprietary database of global ex US private equity and venture capital funds. As of September 30, 2017, the database comprised 890 global ex US developed markets private equity and venture capital funds formed from 1986 to 2017 with a value of about $275 billion. Ten years ago, as of September 30, 2007, the benchmark index included 525 global ex US developed markets funds, whose value was roughly $169 billion. The funds in this index invest primarily in developed markets in Australia, Canada, Israel, Japan, New Zealand, Singapore, and Western Europe.
Cambridge Associates derives its Emerging Markets Private Equity and Venture Capital Index from the financial information contained in its proprietary database of global ex US private equity and venture capital funds. As of September 30, 2017, the database comprised 652 emerging markets funds formed from 1986 to 2016 with a value of about $199 billion. Ten years ago, as of September 30, 2007, the benchmark index included 326 emerging markets funds, whose value was $43 billion. The funds in this index invest primarily in Africa, emerging Asia, emerging Europe, Latin America & Caribbean, and the Middle East ex Israel.
The pooled returns represent the net periodic rates of return calculated on the aggregate of all cash flows and market values as reported to Cambridge Associates by the funds’ general partners in their quarterly and annual audited financial reports. These returns are net of management fees, expenses, and performance fees that take the form of carried interest.
About the Public Indexes
The MSCI All Country World Index (ACWI) is a free float–adjusted, market capitalization–weighted index designed to measure the equity market performance of developed and emerging markets. As of September 2017, the MSCI ACWI consists of 46 country indexes comprising 23 developed and 24 emerging markets country indexes. The developed markets country indexes included are: Australia, Austria, Belgium, Canada, Denmark, Finland, France, Germany, Hong Kong, Ireland, Israel, Italy, Japan, the Netherlands, New Zealand, Norway, Portugal, Singapore, Spain, Sweden, Switzerland, the United Kingdom, and the United States. The emerging markets country indexes included are: Brazil, Chile, China, Colombia, Czech Republic, Egypt, Greece, Hungary, India, Indonesia, Korea, Malaysia, Mexico, Pakistan, Peru, the Philippines, Poland, Qatar, Russia, South Africa, Taiwan, Thailand, Turkey, and the United Arab Emirates.
The MSCI EAFE Index is a free float–adjusted, market capitalization–weighted index that is designed to measure large- and mid-cap equity performance of developed markets, excluding Canada and the United States. As of September 2017, the MSCI EAFE Index consisted of the following 21 developed markets country indexes: Australia, Austria, Belgium, Denmark, Finland, France, Germany, Hong Kong, Ireland, Israel, Italy, Japan, the Netherlands, New Zealand, Norway, Portugal, Singapore, Spain, Sweden, Switzerland, and the United Kingdom.
The MSCI Emerging Markets Index is a free float–adjusted, market capitalization–weighted index that is designed to measure large- and mid-cap equity performance of emerging markets. As of September 2017, the MSCI Emerging Markets Index included 24 emerging markets country indexes: Brazil, Chile, China, Colombia, Czech Republic, Egypt, Greece, Hungary, India, Indonesia, Korea, Malaysia, Mexico, Pakistan, Peru, the Philippines, Poland, Qatar, Russia, South Africa, Taiwan, Thailand, Turkey, and the United Arab Emirates.
The MSCI World Index represents a free float–adjusted, market capitalization–weighted index that is designed to measure the equity market performance of developed markets. As of June 2017, it includes 23 developed markets country indexes: Australia, Austria, Belgium, Canada, Denmark, Finland, France, Germany, Hong Kong, Ireland, Israel, Italy, Japan, the Netherlands, New Zealand, Norway, Portugal, Singapore, Spain, Sweden, Switzerland, the United Kingdom, and the United States.
Footnotes