Overview
In USD terms, the Cambridge Associates LLC benchmark indexes for global ex US developed and emerging markets private equity[1]Beginning with this quarter’s edition of the global ex US benchmark commentary, “private equity” will refer only to buyout and growth equity funds in the benchmark indexes, and will not include … Continue reading and venture capital (PE/VC) produced nearly identical results in fourth quarter 2017 (5.7% and 5.6%, respectively); but, for the year, the developed markets index earned a significantly better return (30.0% versus 18.9%). The developed and emerging markets indexes both earned much better returns in 2017 than they did in 2016. For the second year in a row, the Cambridge Associates Global ex US Developed Markets PE/VC Index bested its public market counterpart for both the quarter and the year (based on modified public market equivalent [mPME] returns). Also for the second year in a row, the Cambridge Associates Emerging Markets PE/VC Index trailed its public market peer for the year. Over the long term, private benchmarks have outperformed the public indexes handily.
After three years of weakening, the euro strengthened against the dollar, helping to boost the developed markets index return when measured in USD terms (Figure 1). In 2017, private equity entry valuations and leverage multiples remained elevated as exits through mergers and acquisitions (M&A) rose compared with 2016. In Asia, amid an active fundraising environment, exits were also numerous as the number and value of initial public offerings (IPOs) and M&A transactions were both higher in 2017 than in 2016.
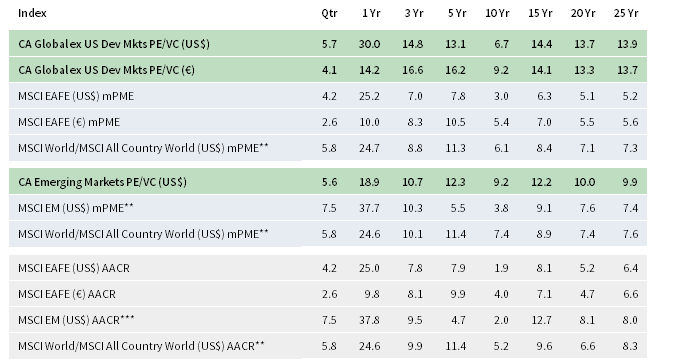
FIGURE 1 GLOBAL EX US PRIVATE EQUITY* AND VENTURE CAPITAL INDEX RETURNS
Periods Ended December 31, 2017 • Percent (%)
Sources: Cambridge Associates LLC, Global Financial Data, Inc., MSCI Inc., and Thomson Reuters Datastream. MSCI data provided “as is” without any express or implied warranties.
Notes: The PE/VC indexes are pooled horizon internal rates of return and are based on limited partners’ fund-level performance; the returns are net of fees, expenses, and carried interest. Because the indexes are capitalization weighted, performance is mainly driven by the largest vintage years. Public index returns are shown as both time-weighted returns (average annual compound returns) and dollar-weighted returns (modified public market equivalent). Returns are annualized, with the exception of returns less than one year, which are cumulative. The CA mPME replicates private investment performance under public market conditions. The public index’s shares are purchased and sold according to the private fund cash flow schedule, with distributions calculated in the same proportion as the private fund, and mPME net asset value is a function of mPME cash flows and public index returns.
* Includes buyout and growth equity funds only.
** MSCI All Country World Constructed Index: Data from 1/1/1986 to 12/31/1987 represented by MSCI World Index gross total return. Data from 1/1/1988 to present represented by MSCI ACWI gross total return.
*** MSCI EM Constructed Index: Data from 1/1/1986 to 12/31/1987 represented by GFD Emerging Markets price return. Data from 1/1/1988 to present represented by MSCI Emerging Markets total return gross.
Fourth Quarter and Calendar Year 2017 Highlights
- The developed markets PE/VC index outperformed its public equity counterpart (MSCI EAFE) in all trailing time periods listed in Figure 1 (in both USD and EUR terms).
- With the exception of the one-quarter and one-year periods, the emerging markets index bested its comparable public benchmark (MSCI EM).
- Based on market values on December 31, 2017, public companies accounted for 7% of the developed markets PE/VC index and about 17% of the emerging markets PE/VC index.
Global ex US Developed Markets Private Equity and Venture Capital Performance Insights
In fourth quarter 2017, the developed markets PE/VC index returned 5.7% to cap off its best year since 2007 (30.0%). Returns for the eight meaningfully sized (5% or more of the index value) vintage years in the index (2006–08 and 2010–14) ranged from 4.6% to 9.6% during fourth quarter; for the year, they ranged from 23.1% to 46.0% (Figure 2). By the end of the year, these eight years represented 85% of the benchmark’s value, of which 57% resided in the four largest vintages: 2006, 2007, 2012, and 2013. The 2006 and 2014 vintages produced the lowest and highest returns, respectively, for the quarter and year.
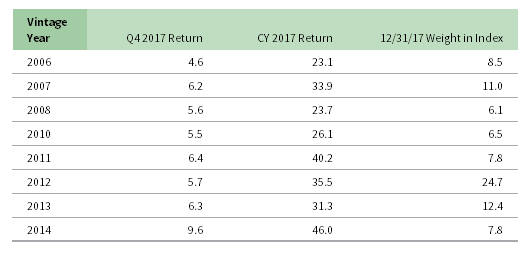
FIGURE 2 GLOBAL EX US DEVELOPED MARKETS PE/VC INDEX VINTAGE YEAR RETURNS: NET FUND-LEVEL PERFORMANCE
Percent (%)
Notes: Private equity is composed of buyout and growth equity funds. Returns in USD terms. Vintage year fund-level returns are net of fees, expenses, and carried interest.
For the best- and worst-performing large vintage years, many of the same sectors—including consumer discretionary, health care, industrials, and IT—were among the positive contributors to performance, but the concentration of gains was not the same. For the quarter’s best vintage year, 2014, industrials led the way; in contrast, consumer discretionary and IT saw the largest gains in the quarter’s lowest-performing vintage, 2006. For the year, the 2014 vintage enjoyed significant write-ups in those four sectors plus financials while the 2006 vintages gains were dominated by consumer discretionary and industrials. In the index’s largest vintage year, 2012, gains for the year were most significant in industrials and IT. In fourth quarter, energy was the sole sector to post meaningful losses.
Figure 3 shows the GICS sector breakdown of the developed markets PE/VC benchmark and its public market counterpart, MSCI EAFE. The breakdown provides context when comparing the performance of the two indexes. The chart highlights the relative overweights in the PE/VC index, such as consumer discretionary, IT, health care, and industrials and the underweights in financials and consumer staples.
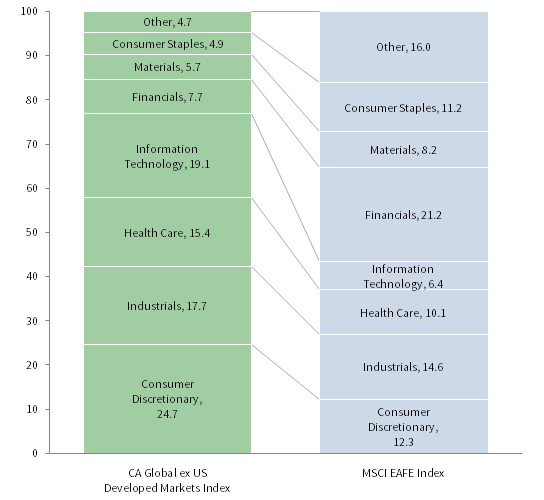
FIGURE 3 CA GLOBAL EX US DEVELOPED MARKETS PE/VC vs MSCI EAFE
As of December 31, 2017 • GICS Sector Comparisons • Percent (%)
Sources: Cambridge Associates LLC, FactSet Research Systems, and MSCI Inc. MSCI data provided “as is” without any express or implied warranties.
Notes: Private equity is composed of buyout and growth equity funds. The Global Industry Classification Standard (GICS®) was developed by and is the exclusive property and a service mark of MSCI Inc. and S&P Global Market Intelligence LLC and is licensed for use by Cambridge Associates. Other includes sectors that make up less than 2% of the CA benchmark.
All Six Key Sectors Posted Positive Returns for the Quarter and Year. Fourth quarter returns were positive across the index’s six meaningfully sized sectors, ranging from 3.1% to 8.8%, in USD terms. Among the meaningfully sized sectors, IT turned in the best performance for the quarter (Figure 4). The 2007 vintage year was the largest contributor to the sector’s return. The materials sector was a close second to IT, and the 2007 and 2013 vintages were the primary drivers of its performance. With more modest write-ups in general, health care trailed the other key sectors. At the end of the year, consumer staples companies came close to being considered meaningfully sized at 4.9% of the index; the sector returned 6.6% for the quarter (slightly outperforming consumer discretionary companies) and 23.9% for the year (slightly underperforming consumer discretionary companies). Energy companies, which represented barely more than 1% of the index at year end, were the worst performing across all sectors for both the quarter and the year.

FIGURE 4 GLOBAL EX US DEVELOPED MARKETS PE/VC INDEX SECTOR RETURNS: GROSS COMPANY-LEVEL PERFORMANCE
Percent (%)
Notes: Private equity is composed of buyout and growth equity funds. Industry-specific gross company-level returns are before fees, expenses, and carried interest.
Portfolio Companies Based in France and the Netherlands Led in Fourth Quarter and the Year, Respectively; Italian Companies Were the Worst Performing for the Quarter and UK Companies Were the Worst Performing for the Year—except for US Companies, which Trailed All in Both Time Periods. Fourth quarter returns (in USD terms) for the seven meaningfully sized geographic regions ranged from the United States 0% to France’s 9.9% (Figure 5). Seven countries—the United States, the United Kingdom, Germany, France, Sweden, the Netherlands, and Italy (in rank order)—accounted for 71% of the index’s value. Most of the portfolio companies in the index are located in Western Europe, but some of the larger funds in the index invest in businesses based in the United States, which has resulted in it growing to become the largest region in the index.
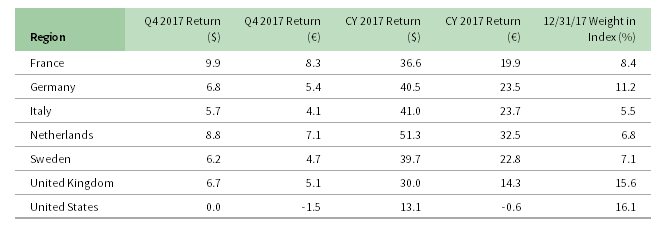
FIGURE 5 GLOBAL EX US DEVELOPED MARKETS PE/VC INDEX REGIONAL RETURNS: GROSS COMPANY-LEVEL PERFORMANCE
Percent (%)
Notes: Private equity is composed of buyout and growth equity funds. Geographic region–specific gross company-level returns are before fees, expenses, and carried interest.
For the year, all of the meaningfully sized geographic regions produced double-digit returns (except for US-based companies when measured in EUR terms). For all annual returns, the effects of a weakened US dollar are visible in Figure 5, as performance calculated in euros is much lower than that based on US dollars.
During fourth quarter, across the index, company-level valuations rose by nearly $12 billion, and more than half of those write-ups were in companies located in France, Germany, the Netherlands, and the United Kingdom; US-based companies were virtually flat. For the year, while all seven key countries experienced meaningful valuation increases, Germany and the United Kingdom led the way. For the UK companies, nearly 60% of the write-ups were in three vintages, 2006, 2007, and 2013. Vintage years 2006, 2007, and 2012 accounted for more than 70% of the write-ups for German companies.
Distributions Continued to Outpace Contributions. Distributions have now outpaced contributions for seven straight years (Figure 6), during which distributions have outpaced contributions at a ratio of 1.8. In the previous seven years, (2004–10), LPs contributed 1.3 times as much as they received in distributions. For the year, contributions and distributions were both up when compared with the previous year. Contributions and distributions rose 25% and 10%, respectively, from levels reached in 2016. Distributions in 2017 represented the third highest annual tally since the inception of the index.
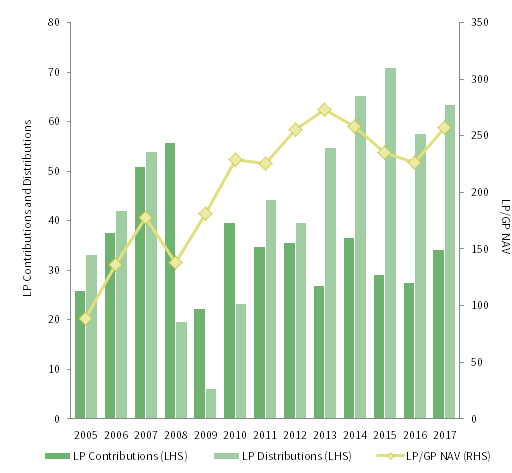
FIGURE 6 GLOBAL EX US DEVELOPED MARKETS PE/VC CONTRIBUTIONS, DISTRIBUTIONS, AND NET ASSET VALUE (NAV)
Calendar Years 2006–17 • USD Billions
Note: Private equity is composed of buyout and growth equity funds.
In fourth quarter, managers in the developed markets ex US index called $14.4 billion from limited partners and returned $19.4 billion, the highest amount distributed during a quarter in two years. Capital calls leapt $6.3 billion, or almost 80%, from the third quarter, while distributions increased $6.1 billion, or 46%. Investors in funds launched in 2012–16 contributed $14 billion (or 98% of the total called); each vintage called $1.8 billion or more. On the other hand, investors in funds launched in 2005–08, and 2011–13 all received more than $1 billion of distributions during the quarter for a total of $17 billion or 88% of the total.
Almost 60% of the capital invested by fund managers in the developed markets index in fourth quarter went into two sectors (industrials and IT) with IT companies garnering more than a third of the capital. Reflective of the recent emphasis on IT, the sectors’ tally was almost 25% higher than their combined long-term norm. Over the year, three sectors—consumer discretionary, industrials, and IT (in rank order)—received 60% of the invested capital, with consumer discretionary companies attracting nearly a quarter of it, which is roughly in line with its long-term norm.
About 72% of the capital invested in the year by fund managers in the developed markets index went to companies in Belgium, France, Germany, Italy, Sweden, the United Kingdom, and the United States.[2]Funds in the global ex US developed markets PE/VC index primarily invest in companies in Europe, but occasionally make investments in US companies as well. The percentage is equal to what has been invested in these seven countries since inception of the index but the proportions are different than over the long term. For example, UK businesses attracted nearly 20% of the money invested during the year, more than 5% less than over the long term.
Emerging Markets Private Equity and Venture Capital Performance Insights
The Cambridge Associates LLC Emerging Markets PE/VC Index performed similarly to the developed markets ex US index for the quarter, posting a 5.6% return. Despite the index’s moderately strong performance, it underperformed the MSCI Emerging Markets Index (Figure 1). Solid quarterly performance by three of the four largest vintages—2007, 2010, and 2011—had a positive impact on the overall return of the index. Performance for the quarter’s top-performing vintage, 2012, was driven by write-ups in consumer discretionary, industrials, and financials (in rank order). At year end, vintage years 2007, 2008, 2010–15 were considered meaningfully sized and in total represented more than 85% of the index.
For 2017, the index returned 18.9% and trailed its developed markets counterpart. The index also lagged far behind the one-year return of the MSCI Emerging Markets Index on an mPME basis, but outperformed this benchmark in all other time periods greater than one year (Figure 1). The largest vintage year in the index, 2011, posted an 18.3% return for the year (Figure 7). Vintage years 2013 and 2015 had the strongest performance for the year, each posting returns just over 32%. Both vintages experienced strong write-ups in consumer discretionary investments, and the 2015 group also experienced large write-ups in IT. Vintages 2007 and 2008 were the laggards for the year (among meaningfully sized funds), but still produced solid annual returns, driven primarily by write-ups in consumer discretionary and IT investments.
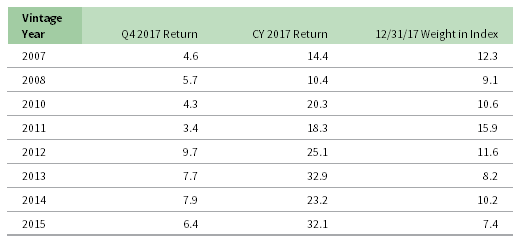
FIGURE 7 EMERGING MARKETS PE/VC INDEX VINTAGE YEAR RETURNS: NET FUND-LEVEL PERFORMANCE
Percent (%)
Notes: Private equity is composed of buyout and growth equity funds. Returns in USD terms. Vintage year fund-level returns are net of fees, expenses, and carried interest.
Figure 8 shows the GICS sector breakdown of the emerging markets benchmark and its public market counterpart, the MSCI Emerging Markets Index. The breakdown provides context when comparing the performance of the two indexes. The chart highlights the relative overweights in the PE/VC index, such as consumer discretionary, health care, and industrials, and the underweights in financials, energy, and materials.
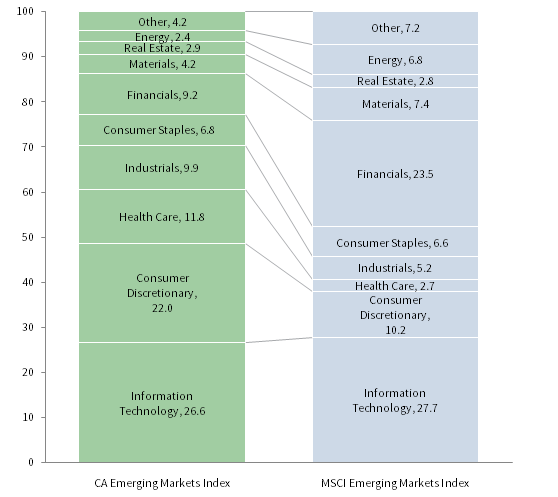
FIGURE 8 CA EMERGING MARKETS PE/VC vs MSCI EMERGING MARKETS
As of December 31, 2017 • GICS Sector Comparisons • Percent (%)
Sources: Cambridge Associates LLC, FactSet Research Systems, and MSCI Inc. MSCI data provided “as is” without any express or implied warranties.
Notes: Private equity is composed of buyout and growth equity funds. The Global Industry Classification Standard (GICS®) was developed by and is the exclusive property and a service mark of MSCI Inc. and S&P Global Market Intelligence LLC and is licensed for use by Cambridge Associates. Other includes sectors that make up less than 2% of the CA benchmark.
Financials and Consumer Discretionary Investments Posted Highest Returns in 2017. Calendar year 2017 proved to be a good year for the six largest sectors in the index, as each posted returns greater than 22.1%. In line with fourth quarter, investments in financials gained the most for the year, at 30.9%, making it the best-performing meaningfully sized sector. The sector’s annual performance was driven by write-ups in 2007, 2011, and 2012 vintage year funds. Consumer discretionary investments also experienced a strong return for the year with a 27.0% gain (Figure 9). The only sector posting a negative return for the year was energy, which constituted less than 3% of the index.
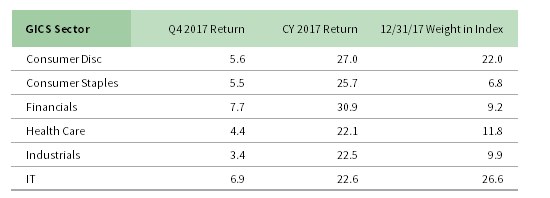
FIGURE 9 EMERGING MARKETS PE/VC INDEX SECTOR RETURNS:
GROSS COMPANY-LEVEL PERFORMANCE
Percent (%)
Notes: Private equity is composed of buyout and growth equity funds. Industry-specific gross company-level returns are before fees, expenses, and carried interest.
Regional Concentration Unchanged in Emerging Markets. The emerging markets PE/VC index has remained concentrated by geography, with China representing 45% of the index, India 8%, and South Korea 7% (Figure 10). (South Korea was a new meaningfully sized entrant in 2017, reaching an index weight greater than 5% in second quarter 2017.) South Korea–based investments performed very well in fourth quarter and the year, posting gains of 14.7% and 48.6%, respectively. Investments in China generated a return of 21.3% for the year, driven by vintage years 2010 and 2011. The highest performing sector for China-based companies was consumer discretionary. India-based investments recorded an uptick in performance for the quarter (8.4%) and the year (28.9%), a significant improvement over the prior two years. Annual performance was driven by 2006, 2007, and 2011 vintage year funds. Of the countries representing less than 5% of the index, standouts were Australia, Hong Kong, Japan, and the United Kingdom. One-year returns in each country topped 26%, and Hong Kong and Japan returned more than 42% for the year.[3]Funds in the global ex US emerging markets PE/VC index may occasionally invest in companies in developed markets regions as well as the emerging markets regions.
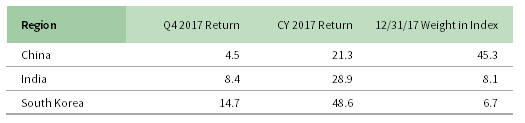
FIGURE 10 EMERGING MARKETS PE/VC INDEX REGIONAL RETURNS: GROSS COMPANY-LEVEL PERFORMANCE
Percent (%)
Notes: Private equity is composed of buyout and growth equity funds. Geographic region–specific gross company-level returns are before fees, expenses, and carried interest.
Fourth quarter marked the 19th consecutive quarter, and the 22nd of the last 24, where China-based companies received over $1 billion from emerging markets managers. In percentage terms, China represented about 31% of the invested capital for the quarter, which is in alignment with the long-term trend. Companies based in Japan, India, South Korea, and the United States also each attracted 10% or more of invested capital during the quarter.
2017 Contributions Reached All-Time Highs. For calendar year 2017, distributions by emerging markets managers outpaced capital calls, $28.2 billion to $24.6 billion, making it the third out of the past four years with net positive outflows from emerging markets funds. The highest amount of capital calls and distributions since the inception of the index also occurred in 2017, making it a historic year (Figure 11).
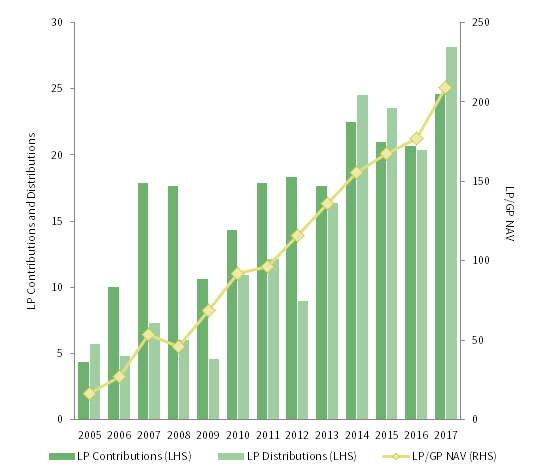
FIGURE 11 GLOBAL EX US EMERGING MARKETS PE/VC CONTRIBUTIONS, DISTRIBUTIONS, AND NET ASSET VALUE (NAV)
Calendar Years 2006–17 • USD Billions
Note: Private equity is composed of buyout and growth equity funds.
During fourth quarter, emerging markets PE/VC managers called $5.7 billion from LPs, slightly less than the quarterly average for the year. Distributions totaled $7.0 billion, on par with the quarterly average for the year. Funds raised in 2013–16 together called over $4.6 billion, with vintage year 2015 calling over $1.8 billion. Together these vintages accounted for 82% of all capital called in the quarter. Managers with funds raised in 2007, 2008, and 2011 each distributed over $1.0 billion for fourth quarter, representing 48% of quarterly distributions. Vintage years 2012 and 2015 were not far behind, distributing over $745 million each. Though the 2007 vintage led the way, it distributed less than half of the amount distributed in the prior quarter.
Caryn Slotsky, Senior Investment Director
Jacob Gilfix, Senior Investment Associate
Sarah Grifferty, Investment Associate
About the Cambridge Associates LLC Indexes
Cambridge Associates derives its Global ex US Developed Markets Private Equity and Venture Capital Index from the financial information contained in its proprietary database of global ex US private equity and venture capital funds. As of December 31, 2017, the database comprised 798 global ex US developed markets buyouts, growth equity, and venture capital funds formed from 1986 to 2017 with a value of about $257 billion. Ten years ago, as of December 31, 2007, the benchmark index included 501 global ex US developed markets funds, whose value was roughly $178 billion. The funds in this index invest primarily in developed markets in Australia, Canada, Israel, Japan, New Zealand, Singapore, and Western Europe.
Cambridge Associates derives its Emerging Markets Private Equity and Venture Capital Index from the financial information contained in its proprietary database of global ex US buyouts, growth equity, and venture capital funds. As of December 31, 2017, the database comprised 650 emerging markets private equity and venture capital funds formed from 1986 to 2017 with a value of about $209 billion. Ten years ago, as of December 31, 2007, the benchmark index included 347 emerging markets funds, whose value was about $54 billion. The funds in this index invest primarily in Africa, emerging Asia, emerging Europe, Latin America & Caribbean, and the Middle East ex Israel.
The pooled returns represent the net periodic rates of return calculated on the aggregate of all cash flows and market values as reported to Cambridge Associates by the funds’ general partners in their quarterly and annual audited financial reports. These returns are net of management fees, expenses, and performance fees that take the form of carried interest.
About the Public Indexes
The MSCI All Country World Index (ACWI) is a free float–adjusted, market capitalization–weighted index designed to measure the equity market performance of developed and emerging markets. As of December 31, 2017, the MSCI ACWI consisted of 47 country indexes comprising 23 developed and 24 emerging markets country indexes. The developed markets country indexes included are: Australia, Austria, Belgium, Canada, Denmark, Finland, France, Germany, Hong Kong, Ireland, Israel, Italy, Japan, the Netherlands, New Zealand, Norway, Portugal, Singapore, Spain, Sweden, Switzerland, the United Kingdom, and the United States. The emerging markets country indexes included are: Brazil, Chile, China, Colombia, Czech Republic, Egypt, Greece, Hungary, India, Indonesia, Korea, Malaysia, Mexico, Pakistan, Peru, the Philippines, Poland, Qatar, Russia, South Africa, Taiwan, Thailand, Turkey, and the United Arab Emirates.
The MSCI EAFE Index is a free float–adjusted, market capitalization–weighted index that is designed to measure large- and mid-cap equity performance of developed markets, excluding Canada and the United States. As of December 31, 2017, the MSCI EAFE Index consisted of the following 21 developed markets country indexes: Australia, Austria, Belgium, Denmark, Finland, France, Germany, Hong Kong, Ireland, Israel, Italy, Japan, the Netherlands, New Zealand, Norway, Portugal, Singapore, Spain, Sweden, Switzerland, and the United Kingdom.
The MSCI Emerging Markets Index is a free float–adjusted, market capitalization–weighted index that is designed to measure large- and mid-cap equity performance of emerging markets. As of December 31, 2017, the MSCI Emerging Markets Index included 24 emerging markets country indexes: Brazil, Chile, China, Colombia, Czech Republic, Egypt, Greece, Hungary, India, Indonesia, Korea, Malaysia, Mexico, Pakistan, Peru, the Philippines, Poland, Qatar, Russia, South Africa, Taiwan, Thailand, Turkey, and the United Arab Emirates.
The MSCI World Index represents a free float–adjusted, market capitalization–weighted index that is designed to measure the equity market performance of developed markets. As of December 31, 2017, it includes 23 developed markets country indexes: Australia, Austria, Belgium, Canada, Denmark, Finland, France, Germany, Hong Kong, Ireland, Israel, Italy, Japan, the Netherlands, New Zealand, Norway, Portugal, Singapore, Spain, Sweden, Switzerland, the United Kingdom, and the United States.
Footnotes