Overview
In USD terms, the Cambridge Associates LLC benchmark indexes for global ex US developed and emerging markets private equity and venture capital (PE/VC) produced nearly identical results in fourth quarter 2016 (0.9% and 0.8%, respectively), but for the year the developed markets index earned a significantly better return (11.7% versus 4.6%). The Cambridge Associates Global ex US Developed Markets PE/VC Index bested its public market counterpart for both the quarter and the year (based on modified public market equivalent [mPME] returns), while the Cambridge Associates Emerging Markets PE/VC Index trailed its public market peer for the year. Over the long term, private benchmarks have outperformed the public indexes handily. For the third year in a row, the euro weakened, again hampering the developed markets index return when measured in US dollars (Table 1). Geopolitical uncertainty, persistent high entry valuations, and drops in initial public offerings (IPOs) and mergers & acquisitions (M&As) impacted the European buyout environment in 2016. In Asia, the number of IPOs and M&A transactions remained strong but values dropped from the previous year.

Table 1. Returns for the Global ex US Developed and Emerging Markets PE/VC Indexes vs Public Counterparts
Periods Ending December 31, 2016 • Percent (%)
Sources: Cambridge Associates LLC, Global Financial Data, MSCI Inc., Standard & Poor’s, and Thomson Reuters Datastream. MSCI data provided “as is” without any express or implied warranties.
Notes: The PE/VC indexes are pooled horizon internal rates of return and are based on limited partners’ fund-level performance; the returns are net of fees, expenses, and carried interest. Because the indexes are capital weighted, performance is mainly driven by the largest vintage years. Public index returns are shown as both time-weighted returns (average annual compound returns) and dollar-weighted returns (modified public market equivalent). The CA mPME replicates private investment performance under public market conditions. The public index’s shares are purchased and sold according to the private fund cash flow schedule, with distributions calculated in the same proportion as the private fund, and mPME net asset value is a function of mPME cash flows and public index returns.
* Returns for the MSCI Emerging Markets Index begin 1/1/1988; to match the 1986 inception of the Emerging Markets PE/VC Index, price returns from Global Financial Data are used for the period 1/1/1986 to 12/31/1987.
Fourth Quarter and Calendar Year 2016 Highlights
- The developed markets PE/VC index outperformed its public equity counterpart (MSCI EAFE) in all trailing time periods listed in Table 1 (in both USD and euro terms). With the exception of the one-year period, the emerging markets index bested its comparable public benchmark (MSCI EM) in all of the time horizons in the table.
- Based on market values on December 31, 2016, public companies accounted for almost 9% of the developed markets PE/VC index and about 14% of the emerging markets PE/VC index.
Global ex US Developed Markets Private Equity and Venture Capital Performance Insights
Despite posting its lowest quarterly return of 2016 during the fourth quarter, 0.9%, the Cambridge Associates LLC Global ex US Developed Markets PE/VC Index earned 11.7% for the year, its best annual showing since 2013. Returns for the eight meaningfully sized (5% or more of the index value) vintage years in the index (2005–08 and 2010–13) ranged from -1.9% to 4.8% during the fourth quarter; for the year, they ranged from 1.1% to 20.5% (Table 2). By the end of the year, these eight years represented 87% of the benchmark’s value; more than 57% of the index’s value resided in the four largest vintages: 2006, 2007, 2012, and 2013. Three of the eight key vintage years (2005, 2006, and 2010) produced negative results in the quarter; the 2006 funds were the worst performers of the group. Five of the eight large vintage years posted double-digit returns for the year, led by the 2007 vintage.
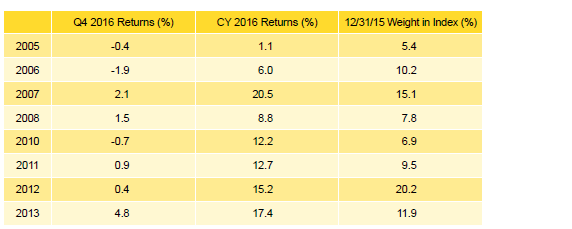
Table 2. Global ex US Developed Markets PE/VC Index Vintage Year Returns:
Net Fund-Level Performance
Notes: Returns in USD terms. Vintage year fund-level returns are net of fees, expenses, and carried interest.
A mix of sectors contributed to the results for the best- and worst-performing large vintage years. For the quarter’s best vintage year, 2013, write-ups were widespread but most pronounced in the consumer discretionary sector. In the 2006 vintage, the quarter’s lowest performer, write-downs in consumer discretionary and industrials were only partially offset by gains in IT. For the year, the 2007 vintage enjoyed significant write-ups in four key sectors: health care, IT, industrials, and consumer discretionary (in rank order). In the 2005 vintage, gains in consumer discretionary, industrials, and financials were nearly completely offset by losses in consumer staples and health care.
Figure 1 shows the GICS sector breakdown of the developed markets PE/VC benchmark and its public market counterpart, MSCI EAFE. The breakdown provides context when comparing the performance of the two indexes. The chart highlights the relative overweights in the PE/VC index, such as consumer discretionary, IT, health care, and industrials and the underweights in financials and consumer staples.
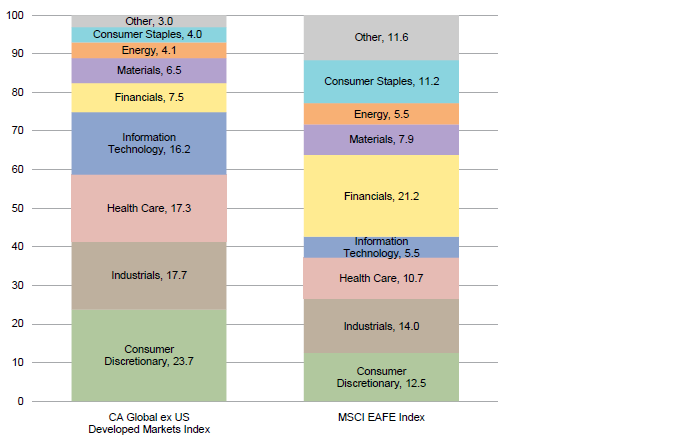
Figure 1. GICS Sector Comparisons: CA Global ex US Developed Markets
As of December 31, 2016 • Percent (%)
Sources: Cambridge Associates LLC, FactSet Research Systems, and MSCI Inc. MSCI data provided “as is” without any express or implied warranties.
Notes: The Global Industry Classification Standard (GICS®) was developed by and is the exclusive property and a service mark of MSCI, Inc. and S&P Global Market Intelligence LLC and is licensed for use by Cambridge Associates.Other includes sectors that make up less than 2% of the CA benchmark.
All Six Key Sectors Posted Positive Returns for the Quarter and Year. Fourth quarter returns were positive across the index’s six meaningfully sized sectors, ranging from 1.3% to 3.5%. Energy, which represented only 4.1% at year end, was up 8.5% in the quarter. Among the meaningfully sized sectors, materials turned in the best performance for the quarter (Table 3). The vintage years that drove the materials sector’s return were 2007, 2012, and 2013. Health care trailed the other key sectors, as write-ups in 2007, 2008, and 2015 were partially offset by write-downs in the 2005 vintage. Vintage years 2009 and 2013 accounted for the lion’s share of the write-ups for energy companies. For the year, returns among the meaningfully sized sectors ranged from 5.4% (financials) to 22.3% (materials).

Table 3. Global ex US Developed Markets PE/VC Index Sector Returns: Gross Company-Level Performance
Percent (%)
Note: Industry-specific gross company-level returns are before fees, expenses, and carried interest.
Portfolio Companies Based in the Netherlands Led in the Fourth Quarter and Year; UK Companies Trailed in Both Time Periods. Fourth quarter returns for the six meaningfully sized geographic regions ranged from the United Kingdom’s -1.4% to the Netherland’s 6.3% (Table 4). Six countries—the United States, the United Kingdom, Germany, France, Sweden, and the Netherlands (in rank order)—accounted for just shy of 65% of the index’s value. Most of the portfolio companies in the index are located in Western Europe, but because some of the larger funds in the index invest in businesses based in the United States and those companies have had strong recent performance, the United States is the largest region in the index. Two other countries, Italy and Spain, each represented more than 4% of the index.
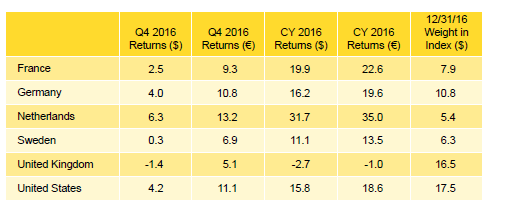
Table 4. Global ex US Developed Markets PE/VC Index Regional Returns: Gross Company-Level Performance
Percent (%)
Note: Geographic region–specific gross company-level returns are before fees, expenses, and carried interest.
For the first time since 2009 (or, in seven years), not all of the meaningfully sized geographic regions produced positive annual returns. Companies in the United Kingdom lost 2.7% in 2016 and one other country, Ireland (a much smaller constituent in the index), did not earn a positive return for the year. As seen in Table 4, when calculated in euros, returns for the European companies were better than those in US dollars, illustrating the downward pressure a strong US dollar puts on performance when calculated in that currency.
During the fourth quarter, across the index, company-level valuations rose by more than $4 billion, driven mostly by write-ups in US, German, and Dutch companies and write-downs in British companies. For the year, valuation increases were led by companies based in the United States, Germany, France, and the Netherlands, and decreases were dominated by those in the United Kingdom. For the US companies, write-ups were concentrated in five vintages, 2013, 2008, 2007, 2012, and 2010 (in rank order). Vintage year 2007 was the only vintage to see significant write-ups in companies in the United Kingdom, all others had either no valuation change or write-downs.
Distributions Continued to Outpace Contributions. In the fourth quarter, managers in the global ex US developed markets index called $10.4 billion from limited partners (LPs) and returned $17.3 billion, the highest amount distributed during a quarter in 2016. Capital calls jumped a whopping $4.6 billion, or almost 80%, from the third quarter, while distributions increased $1.4 billion, or nearly 9%. Investors in funds launched in 2012–14 contributed $7.2 billion (or 70% of the total called). On the other hand, investors in funds launched in 2005–07, and 2012 all received more than $2 billion of distributions during the quarter for a total of $14.1 billion or 81% of the total. For the eleventh quarter in a row, and the 21st out of the past 24, distributions outpaced contributions. Over that six-year period (2011–16), LP distributions outnumbered contributions by a ratio of 1.6. In the previous six-year period, from 2005 through 2010, contributions outnumbered distributions by a ratio of 1.3.
For the year, contributions and distributions were both down when compared with the previous year. Contributions and distributions were down 10.6% and 15.5%, respectively, from levels reached in 2015. It was the second year in a row that contributions declined. Distributions in 2016 represented the third highest annual tally since the inception of the index; the year also extended the streak of distributions outpacing contributions to six years (Figure 2).
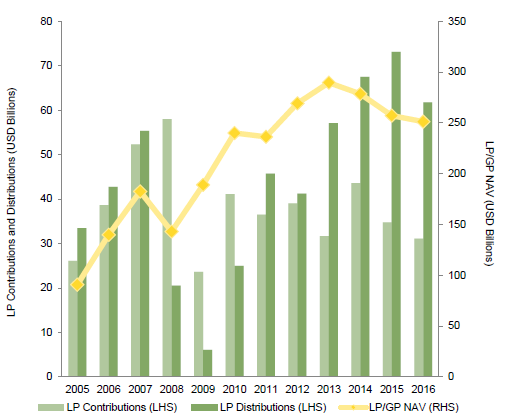
Figure 2. Global ex US Developed Markets Contributions, Distributions, and Net Asset Value (NAV)
Calendar Years 2005–16
Nearly 90% of the capital invested by fund managers in the developed markets index in the fourth quarter went into five sectors (in rank order, consumer discretionary, industrials, health care, IT, and materials); consumer discretionary companies alone accounted for more than a third of all investments (by invested capital), about 11% higher than their combined long-term norm. Similarly, over the year, four sectors—consumer discretionary, health care, IT, and industrials (in rank order)—received almost 75% of the invested capital, and each attracted roughly $3 billion or more of investments.
More than 60% of the capital invested in the year by fund managers in the developed markets index went to companies in France, Germany, Italy, the United Kingdom, and the United States.[1]Funds in the global ex US developed markets PE/VC index primarily invest in companies in Europe, but occasionally make investments in US companies as well. The percentage is equal to what has been invested in these five countries since inception of the index but the proportions are different than over the long term. For example, US-based businesses attracted about 18% of the money invested during the year, roughly 6% more than over the long term.
Emerging Markets Private Equity Performance Insights
The Cambridge Associates LLC Emerging Markets PE/VC Index performed similarly to the global ex US developed index for the quarter, posting a 0.8% return. Despite the index’s lackluster performance, it still outperformed the MSCI Emerging Markets Index (Table 1). Weak quarterly performance by the 2007 and 2010 vintages had an impact on the overall return of the index. The index’s quarterly return was also influenced by negative performance in industrial sector investments in 2006 and 2008 vintage year funds. However, performance for the quarter’s top-performing vintage, 2012, was driven by write-ups in industrials. At year end, vintage years 2006–14 each represented at least 5% of the index value and in total represented 92% of the index.
For full year 2016, the emerging markets benchmark return of 4.6% lagged far behind its developed markets counterpart. The index also trailed the one-year return of the MSCI Emerging Markets Index on an mPME basis, but outperformed this benchmark in all other time periods (Table 1). The largest vintage year in the index, 2007, posted a 5.4% return for the year (Table 5). Vintage year funds in 2013 and 2014 each posted double-digit returns for the year of 10.4% and 12.4%, respectively. Both years experienced strong write-ups in consumer discretionary investments. Just as for the fourth quarter, vintages 2006 and 2008 were the laggards in the year, and again investments in the industrials sector dragged down performance in both vintages.
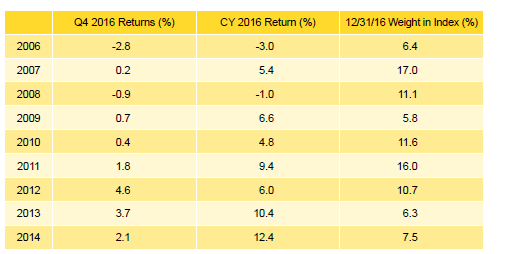
Table 5. Emerging Markets PE/VC Index Vintage Year Returns: Net Fund-Level Performance
Notes: Returns in USD terms. Vintage year fund-level returns are net of fees, expenses, and carried interest.
Consumer Staples and Health Care Posted Double-Digit Gains in 2016. Despite its negative fourth quarter return, investments in consumer staples gained 15.1% for the year, making it the best performing sector in the index among those that are meaningfully sized. The sector’s performance was driven by strong write-ups in 2006, 2008, 2011, and 2012 vintage year funds. Health care also posted a double-digit return for 2016 with a 12.2% gain (Table 6). Calendar year 2016 proved to be a good year for the six largest sectors in the index (consumer discretionary, consumer staples, financials, health care, industrials, and IT) as each posted positive returns. The only sectors posting negative returns for the year were energy and utilities, which together constituted only 3% of the index.
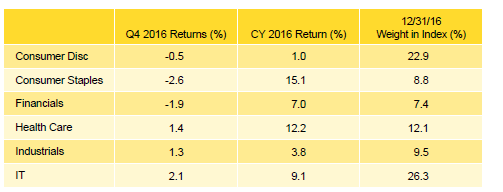
Table 6. Emerging Markets PE/VC Index Sector Returns: Gross Company-Level Performance
Notes: Returns in USD terms. Industry-specific gross company-level returns are before fees, expenses, and carried interest.
Figure 3 shows the GICS sector breakdown of the emerging markets benchmark and its public market counterpart, the MSCI Emerging Markets Index. The breakdown provides context when comparing the performance of the two indexes. The chart highlights the relative overweights in the PE/VC index, such as consumer discretionary, health care, and industrials, and the underweights in financials, energy, and materials.
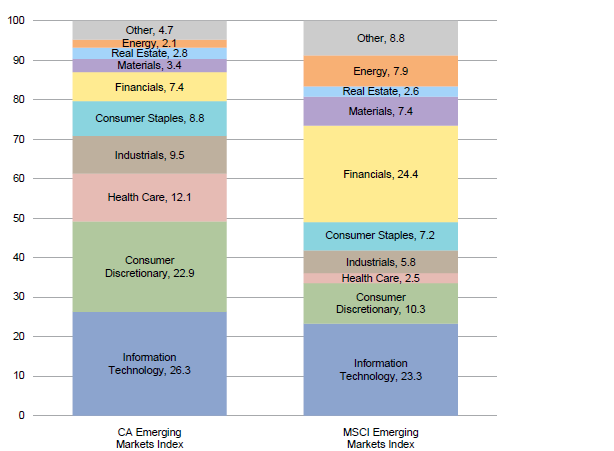
Figure 3. GICS Sector Comparisons: CA Emerging Markets vs MSCI Emerging Markets
As of December 31, 2016 • Percent (%)
Sources: Cambridge Associates LLC, FactSet Research Systems, and MSCI Inc. MSCI data provided “as is” without any express or implied warranties.
Notes: The Global Industry Classification Standard (GICS®) was developed by and is the exclusive property and a service mark of MSCI, Inc. and S&P Global Market Intelligence LLC and is licensed for use by Cambridge Associates.Other includes sectors that make up less than 2% of the CA benchmark.
Regional Concentration Unchanged in Emerging Markets. The emerging markets PE/VC index has remained concentrated by geography, with China representing 46.1% of the index and India representing 8.3% (Table 7). South Korea represented 4.7% of the index, thus falling short of the threshold for being considered meaningfully sized. That said, South Korea–based investments performed well in the quarter, posting a 4.1% gain. Investments in China generated a return of 2.8% for the year, driven by vintage years 2010, 2011, 2013, and 2014. China-based health care and IT companies performed well while consumer discretionary companies experienced write-downs. Similar to 2015, India-based investments recorded unremarkable performance in fourth quarter 2016 but delivered strong returns for the year, an 11.6% gain. Performance was driven by strong write-ups in financials and IT businesses with the only notable write-downs coming from investments in consumer discretionary companies. With respect to vintage years, 2007 represented the lion’s share of write-ups for the year. Of the countries representing less than 5% of the index, standouts were Australia, Brazil, Japan, and Russia, with returns in each country topping 20%.
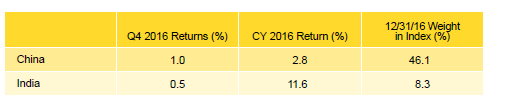
Table 7. Emerging Markets PE/VC Index Regional Returns: Gross Company-Level Performance
Notes: Returns in USD terms. Geographic region–specific gross company-level returns are before fees, expenses, and carried interest.
The fourth quarter marked the 15th consecutive quarter, and 18th of the last 20, where China-based companies received over $1 billion from investors. In percentage terms, China represented about 22% of the invested capital for the quarter, 8% below its long-term norm. Companies based in Australia, Brazil, Hong Kong, India, Luxembourg, and the United States also attracted substantial capital.
2016 Contributions Reach All-Time Highs. During the fourth quarter, emerging markets PE/VC managers called $7.1 billion from LPs, more than doubling the amount called in the third quarter. Distributions totaled $5.7 billion, the highest quarterly distribution of the year. Funds raised in the 2012, 2014, and 2015 vintage years called over $1.5 billion and together accounted for 73% of all capital called in the quarter. Managers in the 2005–07 and 2011 vintage years represented 68% of distributions. The 2007 vintage led the way, nearly doubling the amount of the next closest vintage year with $1.6 billion of distributions to LPs.
For full year 2016, distributions by emerging markets managers narrowly outpaced capital calls, $20 billion to $19.7 billion, marking the third consecutive year of net outflows from emerging markets funds (Figure 4). Despite the historically high US dollar amount called in the fourth quarter, 2016 represented the third year in a row when capital calls decreased from the previous year.
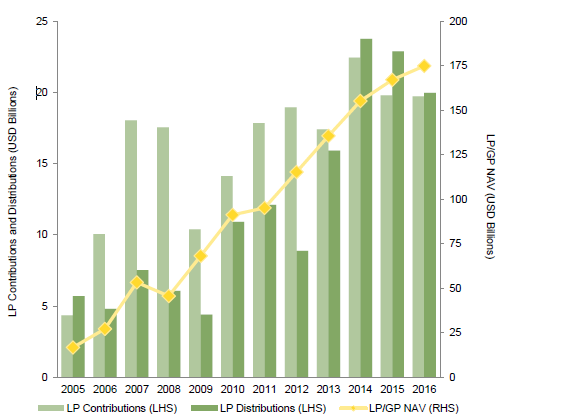
Figure 4. Emerging Markets Contributions, Distributions, and Net Asset Value (NAV)
Calendar Years 2005–16
About the Cambridge Associates LLC Indexes
Cambridge Associates derives its Global ex US Developed Markets Private Equity and Venture Capital Index from the financial information contained in its proprietary database of global ex US private equity and venture capital funds. As of December 31, 2016, the database comprised 863 global ex US developed markets private equity and venture capital funds formed from 1986 to 2016 with a value of about $251 billion. Ten years ago, as of December 31, 2006, the benchmark index included 477 global ex US developed markets funds, whose value was roughly $140 billion. The funds in this index invest primarily in developed markets in Australia, Canada, Israel, Japan, New Zealand, Singapore, and Western Europe.
Cambridge Associates derives its Emerging Markets Private Equity and Venture Capital Index from the financial information contained in its proprietary database of global ex US private equity and venture capital funds. As of December 31, 2016, the database comprised 627 emerging markets private equity and venture capital funds formed from 1986 to 2016 with a value of about $175 billion. Ten years ago, as of December 31, 2006, the benchmark index included 283 emerging markets funds, whose value was over $27 billion. The funds in this index invest primarily in Africa, emerging Asia, emerging Europe, Latin America & Caribbean, and the Middle East ex Israel.
The pooled returns represent the net periodic rates of return calculated on the aggregate of all cash flows and market values as reported to Cambridge Associates by the funds’ general partners in their quarterly and annual audited financial reports. These returns are net of management fees, expenses, and performance fees that take the form of carried interest.
About the Public Indexes
The MSCI EAFE Index is a free-float-adjusted market capitalization–weighted index that is designed to measure large- and mid-cap equity performance of developed markets, excluding Canada and the United States. As of December 2016 the MSCI EAFE Index consisted of the following 21 developed markets country indexes: Australia, Austria, Belgium, Denmark, Finland, France, Germany, Hong Kong, Ireland, Israel, Italy, Japan, the Netherlands, New Zealand, Norway, Portugal, Singapore, Spain, Sweden, Switzerland, and the United Kingdom.
The MSCI Emerging Markets Index is a free-float-adjusted market capitalization–weighted index that is designed to measure large- and mid-cap equity performance of emerging markets. As of December 2016, the MSCI Emerging Markets Index included 23 emerging markets country indexes: Brazil, Chile, China, Colombia, Czech Republic, Egypt, Greece, Hungary, India, Indonesia, Korea, Malaysia, Mexico, Peru, the Philippines, Poland, Russia, Qatar, South Africa, Taiwan, Thailand, Turkey, and the United Arab Emirates.
The Standard & Poor’s 500 Composite Stock Price Index is a capitalization-weighted index of 500 stocks intended to be a representative sample of leading companies in leading industries within the US economy. Stocks in the index are chosen for market size, liquidity, and industry group representation.
Footnotes