Overview
After earning nearly identical returns in fourth quarter 2016, in USD terms, the Cambridge Associates LLC Global ex US Developed Markets Private Equity and Venture Capital Index and the Cambridge Associates LLC Emerging Markets Private Equity and Venture Capital Index produced similar results again in first quarter 2017 (4.2% and 4.0%, respectively). The euro strengthened against the US dollar, helping to boost the developed markets index return when measured in USD terms (Table 1). Although the developed and emerging markets private equity and venture capital (PE/VC) indexes underperformed their public market counterparts in first quarter and the last 12 months, for the developed markets index the disparity over the last year was small (based on modified public market equivalent [mPME] returns). Over the long term, the private benchmarks have outperformed the public indexes handily.
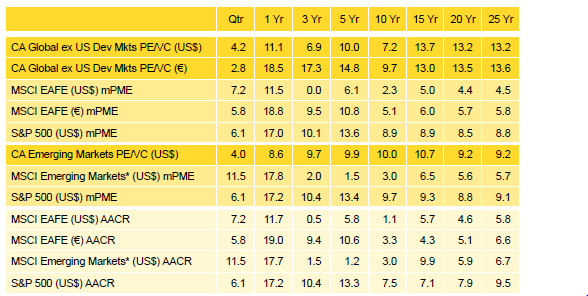
Table 1. Returns for the Global ex US Developed and Emerging Markets PE/VC Indexes vs Public Counterparts
Periods Ending March 31, 2017 • Percent (%)
Sources: Cambridge Associates LLC, Global Financial Data, MSCI Inc., Standard & Poor’s, and Thomson Reuters Datastream. MSCI data provided “as is” without any express or implied warranties.
Notes: The PE/VC indexes are pooled horizon internal rates of return and are based on limited partners’ fund-level performance; the returns are net of fees, expenses, and carried interest. Because the indexes are capitalization weighted, performance is mainly driven by the largest vintage years. Public index returns are shown as both time-weighted returns (average annual compound returns) and dollar-weighted returns (modified public market equivalent). The CA mPME replicates private investment performance under public market conditions. The public index’s shares are purchased and sold according to the private fund cash flow schedule, with distributions calculated in the same proportion as the private fund, and mPME net asset value is a function of mPME cash flows and public index returns.
* Returns for the MSCI Emerging Markets Index begin 1/1/1988; to match the 1986 inception of the Emerging Markets PE/VC Index, price returns from Global Financial Data are used for the period 1/1/1986 to 12/31/1987.
First Quarter 2017 Highlights
- The developed markets PE/VC index outperformed the comparable public equity index (MSCI EAFE Index), based on mPME returns, for all time periods longer than one year ending March 31, 2017, listed in Table 1. The emerging markets PE/VC index had similar success against its corresponding public market benchmark (MSCI Emerging Markets Index).
- Geographically, Western Europe continued to dominate the developed markets index, and China and India still represented the only two countries to account for more than 5% of the emerging markets index.
- Based on market values at March 31, 2017, public companies accounted for around 8% of the developed markets PE/VC index and about 15% of the emerging markets PE/VC index.
Global ex US Developed Markets Private Equity and Venture Capital Performance Insights
- During first quarter 2017, all nine meaningfully sized vintage years (those that represented at least 5% of the index’s value) posted positive returns. Combined, the nine vintages represented more than 91% of the benchmark’s value (Table 2) and returns ranged from 2.1% to 7.9% for the quarter. Write-ups for IT and health care companies were the main drivers for the best-performing vintage, 2014. In the lowest-performing vintage, 2005, valuation changes were fairly modest across the board, with health care and consumer discretionary companies seeing the largest write-ups. For the largest vintage, 2012, write-ups were led by industrials, financials, and materials (in rank order).

Table 2. Global ex US Developed Markets PE/VC Index Vintage Year Returns:
Net Fund-Level Performance
Notes: Returns in USD terms. Vintage year fund-level returns are net of fees, expenses, and carried interest.
- Limited partner contributions and distributions were lower in first quarter 2017 than they were in fourth quarter 2016, but first quarter saw above average levels of both and there were similar quarter-over-quarter decreases from fourth quarter 2015 to first quarter 2016. Developed markets PE/VC funds called $5.4 billion from investors during the quarter, a 49% decrease, and distributions totaled $14.3 billion, a 20% drop. Distributions continued to outpace contributions, which has been the case in all but three quarters since the beginning of 2011.
- Managers of funds raised in 2012–15 called $4.1 billion, or 77% of the total capital called during the quarter. Three of the four vintage years called more than $1.0 billion (2012, 2013, and 2015). Four vintages, 2007–08 and 2011–12, each distributed more than $1.2 billion for a combined total of $10.7 billion (75% of the total). The 2007 vintage year led the way, distributing $4.6 billion.
- Figure 1 shows the GICS sector breakdown of the Global ex US Developed Markets Private Equity and Venture Capital Index and its public market counterpart, the MSCI EAFE Index. The breakdown provides context when comparing the performance of the two indexes. The chart highlights the relative overweights in the PE/VC index, such as consumer discretionary, IT, health care, and industrials and the underweights in financials and consumer staples.
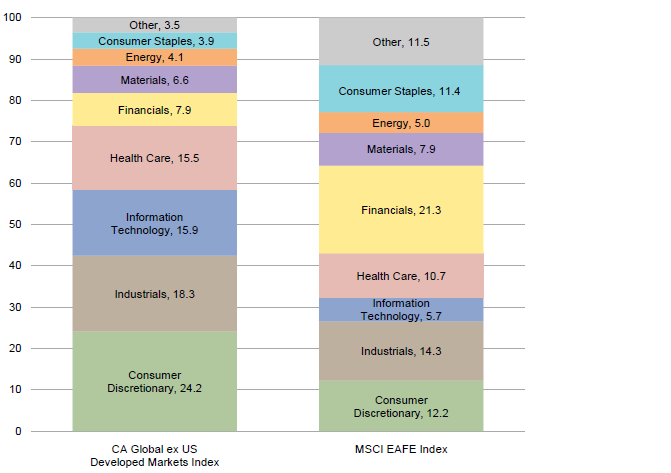
Figure 1. GICS Sector Comparisons: CA Global ex US Developed Markets vs MSCI EAFE
As of March 31, 2017 • Percent (%)
Sources: Cambridge Associates LLC, FactSet Research Systems, and MSCI Inc. MSCI data provided “as is” without any express or implied warranties.
Notes: The Global Industry Classification Standard (GICS®) was developed by and is the exclusive property and a service mark of MSCI Inc. and S&P Global Market Intelligence LLC and is licensed for use by Cambridge Associates. Other includes sectors that make up less than 2% of the CA benchmark.
- All six meaningfully sized sectors earned positive returns for the quarter in both USD and euros, though when measured in euros, performance was lower (Table 3). Among the key sectors, financials earned the highest return and IT the lowest. The 2012, 2010, 2013, and 2006 (in rank order) vintages were responsible for the lion’s share of the write-ups in the financial sector. Write-ups for IT companies were fairly widespread but more muted than in other sectors. The four largest sectors—consumer discretionary, industrials, IT, and health care (in rank order)—represented 74% of the index’s value and, on a dollar-weighted basis, returned 4.4%.
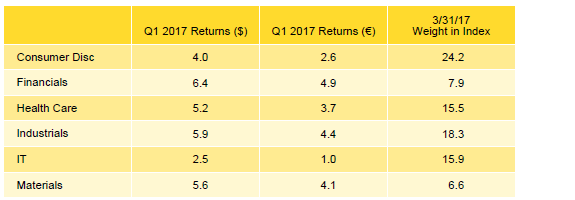
Table 3. Global ex US Developed Markets PE/VC Index Sector Returns:
Gross Company-Level Performance
Percent (%)
Note: Industry-specific gross company-level returns are before fees, expenses, and carried interest.
- Industrials and consumer discretionary companies attracted the most capital during the quarter, together collecting 45% of the capital invested during the quarter (24% and 21%, respectively). Over the long term, the two sectors have garnered about 48% of capital invested (20% for industrials and 28% for consumer discretionary).
- In USD terms, the six largest countries in the index (accounting for 64% of its value) posted positive returns during first quarter (Table 4). Returns among the six countries ranged from 2.5% (Sweden) to 6.8% (the Netherlands). Vintage years 2006 and 2011 were the biggest contributors to the Netherlands’ return and for Swedish companies, write-ups in 2007 and 2013 vintage year funds were partially offset by write-downs in the 2010 vintage. For the quarter, the gross dollar-weighted return for the three largest countries—the United States, the United Kingdom, and Germany—was 3.8%, about 70 basis points lower than the index’s total gross return.[1]Funds in the global ex US developed markets PE/VC index primarily invest in companies in Europe, but occasionally make investments in US companies as well.

Table 4. Global ex US Developed Markets PE/VC Index Regional Returns:
Gross Company-Level Performance
Percent (%)
Note: Geographic region–specific gross company-level returns are before fees, expenses, and carried interest.
- European companies attracted 73% of the capital invested during the quarter, 5% shy of the long-term norm for the region. Investment in US-based companies (about 6% of total) was about half what it has been historically in the global ex US manager index.
Emerging Markets Private Equity Performance Insights
- By the end of first quarter, there were nine meaningfully sized vintage years in the emerging markets index (2006 through 2014) and together they accounted for 91% of the index’s value (Table 5). All nine vintages produced positive returns for the quarter, a much different result from the same period in 2016 when all but one returned less than 1%. Although the index’s performance was strong, quarterly returns for the meaningfully sized vintages were widely dispersed, ranging from 1.4% to 6.5%. Write-ups in consumer discretionary and IT were the main drivers for the best-performing vintage, 2010. The lowest-returning vintage, 2012, had more widespread valuation increases, concentrated largely in industrials and health care companies. By the end of the quarter, 2011 was the largest vintage year, representing almost 17% of the index, and its performance was mostly driven by write-ups in IT.

Table 5. Emerging Markets PE/VC Index Vintage Year Returns:
Net Fund-Level Performance
Notes: Returns in USD terms. Vintage year fund-level returns are net of fees, expenses, and carried interest.
- During first quarter 2017, emerging markets PE/VC funds called $5.9 billion from investors, a 16% decrease from the prior quarter but the seventh highest quarterly amount in the past ten years. Distributions totaled $4.4 billion and represented a 24% decrease from the previous quarter’s total. Since the inception of the index in 1986, quarterly distributions have outpaced contributions in only 14% of the quarters, but in the past five years they have outpaced contributions in 45% of the quarters.
- Managers of funds that were raised in 2011 and 2013–15 called $4.6 billion, or 78% of the total for the quarter; the 2015 managers alone called $1.9 billion. On the distributions front, managers of funds raised in 2006–07, 2009, and 2011–12 each distributed at least $400 million, for a total of $3.5 billion, accounting for 80% of the quarter’s total.
- Figure 2 shows the GICS sector breakdown of the Emerging Markets PE/VC Index and its public market counterpart, the MSCI Emerging Markets Index. The breakdown provides context when comparing the performance of the two indexes. The chart highlights the relative overweights in the PE/VC index, such as consumer discretionary, health care, and industrials, and the underweights in financials, energy, and materials.

Figure 2. GICS Sector Comparisons: CA Emerging Markets vs MSCI Emerging Markets
As of March 31, 2017 • Percent (%)
Sources: Cambridge Associates LLC, FactSet Research Systems, and MSCI Inc. MSCI data provided “as is” without any express or implied warranties.
Notes: The Global Industry Classification Standard (GICS®) was developed by and is the exclusive property and a service mark of MSCI Inc. and S&P Global Market Intelligence LLC and is licensed for use by Cambridge Associates. Other includes sectors that make up less than 2% of the CA benchmark.
- All six of the meaningfully sized sectors posted positive quarterly returns (Table 6); returns ranged from 2.8% for health care to 8.3% for financials. About 64% of the financial company write-ups were attributed to investments made by funds formed in 2007, 2010, and 2011. Write-ups for health care companies were more muted and four vintages, 2007–08, 2010, and 2012, represented nearly all of the sector’s increases for the quarter. Notably, consumer staples is one of the significant sectors in the emerging markets index, the only PE index for which that is true. On a gross, dollar-weighted basis, the three largest sectors by market value returned 4.2% during the quarter, underperforming the return for all companies by 0.5%.
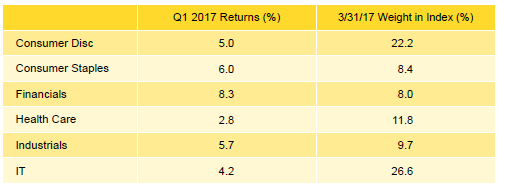
Table 6. Emerging Markets PE/VC Index Sector Returns:
Gross Company-Level Performance
Notes: Returns in USD terms. Industry-specific gross company-level returns are before fees, expenses, and carried interest.
- Consumer discretionary, IT, industrials, and financials companies (in rank order) garnered the most capital during the quarter, in total 68% of the capital invested; consumer discretionary businesses alone attracted 20% of it. Investment activity in first quarter represented an almost 10% decrease from the previous quarter. Over the long term, managers in the emerging markets index have allocated nearly 81% of their capital to the six meaningfully sized sectors.
- Highlighting the index’s geographic concentration, China and India continued to be the only two countries that made up more than 5% of the index by market value, and together they accounted for approximately 54% of the index (Table 7). South Korea fell just shy of the 5% threshold at 4.8% of the total index value. Five other countries—Australia, Brazil, Japan, Singapore, and the United States—represented between 2.5% and 4.2% of the index.
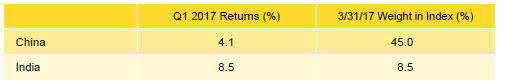
Table 7. Emerging Markets PE/VC Index Regional Returns:
Gross Company-Level Performance
Notes: Returns in USD terms. Geographic region–specific gross company-level returns are before fees, expenses, and carried interest.
- China-based companies continued to receive more capital than any other country. Combined, Chinese, Japanese, and Indian companies attracted almost 60% of dollars invested in first quarter 2017. Due to its size in the index, in dollar terms, write-ups were dominated by Chinese companies. However, the returns for Japan and India were much better in the quarter (Japanese companies returned more than 15% in the quarter). Both Chinese and Japanese companies experienced significant write-ups in vintages 2010 and 2011, while 71% of valuation shifts for India-based companies originated from four vintages, 2007–08 and 2011–12.
- On a gross dollar-weighted basis, when combined, China and India returned 4.8%.
About the Cambridge Associates LLC Indexes
Cambridge Associates derives its Global ex US Developed Markets Private Equity and Venture Capital Index from the financial information contained in its proprietary database of global ex US private equity and venture capital funds. As of March 31, 2017, the database comprised 873 global ex US developed markets private equity and venture capital funds formed from 1986 to 2017 with a value of about $251 billion. Ten years ago, as of March 31, 2007, the benchmark index included 491 global ex US developed markets funds, whose value was roughly $144 billion. The funds in this index invest primarily in developed markets in Australia, Canada, Israel, Japan, New Zealand, Singapore, and Western Europe.
Cambridge Associates derives its Emerging Markets Private Equity and Venture Capital Index from the financial information contained in its proprietary database of global ex US private equity and venture capital funds. As of March 31, 2017, the database comprised 629 emerging markets funds formed from 1986 to 2016 with a value of $184 billion. Ten years ago, as of March 31, 2007, the benchmark index included 296 emerging markets funds, whose value was $30 billion. The funds in this index invest primarily in Africa, emerging Asia, emerging Europe, Latin America & Caribbean, and the Middle East ex Israel.
The pooled returns represent the net periodic rates of return calculated on the aggregate of all cash flows and market values as reported to Cambridge Associates by the funds’ general partners in their quarterly and annual audited financial reports. These returns are net of management fees, expenses, and performance fees that take the form of carried interest.
About the Public Indexes
The MSCI EAFE Index is a free-float-adjusted market capitalization–weighted index that is designed to measure large- and mid-cap equity performance of developed markets, excluding Canada and the United States. As of March 2017, the MSCI EAFE Index consisted of the following 21 developed markets country indexes: Australia, Austria, Belgium, Denmark, Finland, France, Germany, Hong Kong, Ireland, Israel, Italy, Japan, the Netherlands, New Zealand, Norway, Portugal, Singapore, Spain, Sweden, Switzerland, and the United Kingdom.
The MSCI Emerging Markets Index is a free-float-adjusted market capitalization–weighted index that is designed to measure large- and mid-cap equity performance of emerging markets. As of March 2017, the MSCI Emerging Markets Index included 23 emerging markets country indexes: Brazil, Chile, China, Colombia, Czech Republic, Egypt, Greece, Hungary, India, Indonesia, Korea, Malaysia, Mexico, Peru, the Philippines, Poland, Russia, Qatar, South Africa, Taiwan, Thailand, Turkey, and the United Arab Emirates.
The Standard & Poor’s 500 Composite Stock Price Index is a market capitalization–weighted index of 500 stocks intended to be a representative sample of leading companies in leading industries within the US economy. Stocks in the index are chosen for market size, liquidity, and industry group representation.
Footnotes