In the first six months of 2018, in USD terms, the Cambridge Associates LLC Developed Markets ex US Private Equity[1]Throughout this report, “private equity” refers only to buyout and growth equity funds in the benchmark indexes, and does not include energy-focused and subordinated capital funds. The focus on … Continue reading and Venture Capital (PE/VC) Index returned 7.3%, with roughly equal returns in both the first and second quarter (3.7% and 3.5%, respectively). The Cambridge Associates LLC Emerging Markets Private Equity and Venture Capital Index earned 6.0% and, similarly to the developed markets index, it produced about the same returns in each of the first two quarters (2.8% and 3.1%, respectively). Because the indexes’ returns are measured in US dollars, the currency’s value vis-à-vis the euro impacts performance. During first quarter 2018, the US dollar weakened, which helped boost the return in USD terms, while in the second quarter, the US dollar strengthened, which dampened performance measured in USD terms (Figure 1). The developed and emerging markets PE/VC indexes have outperformed their public market counterparts across time (based on modified public market equivalent [mPME] returns).

FIGURE 1 GLOBAL EX US PRIVATE EQUITY AND VENTURE CAPITAL INDEX RETURNS
Periods Ended June 30, 2018 • Percent (%)
Sources: Cambridge Associates LLC, Global Financial Data, Inc., MSCI Inc., and Thomson Reuters Datastream. MSCI data provided “as is” without any express or implied warranties.
Notes: The PE/VC indexes are pooled horizon internal rates of return and are based on limited partners’ fund-level performance; the returns are net of fees, expenses, and carried interest. Because the indexes are capitalization weighted, performance is mainly driven by the largest vintage years. Public index returns are shown as both time-weighted returns (average annual compound returns) and dollar-weighted returns (modified public market equivalent). Returns are annualized, with the exception of returns less than one year, which are cumulative. The CA mPME replicates private investment performance under public market conditions. The public index’s shares are purchased and sold according to the private fund cash flow schedule, with distributions calculated in the same proportion as the private fund, and mPME net asset value is a function of mPME cash flows and public index returns.
First Half 2018 Highlights
- The developed ex US and emerging markets PE/VC indexes outperformed the comparable public equity index (MSCI EAFE and Emerging Markets Indexes), based on mPME returns, for all time periods ending June 30, 2018, listed in Figure 1.
- Based on market values at June 30, 2018, public companies accounted for nearly 7% of the developed markets PE/VC index and about 15% of the emerging markets PE/VC index.
Developed ex US Markets Private Equity and Venture Capital Performance Insights
Vintage Years
During the first six months of 2018, eight of the ten meaningfully sized vintage years (those that represented at least 5% of the index’s value) earned positive returns; the two exceptions were vintages 2010 and 2016. Combined, the ten vintages accounted for more than 93% of the benchmark’s value (Figure 2) and returns ranged from -2.5% (2010) to 11.9% (2007) for the two-quarter period. Write-ups for IT were by far the largest contributor to the 2007 vintage year’s strong return (with consumer staples a distant second). In the 2007 vintage, write-downs were concentrated in the consumer discretionary and industrial sectors. In the index’s largest vintage, 2012, write-ups were fairly widespread with IT and healthcare leading the way; write-downs were dominated by industrials.

FIGURE 2 DEVELOPED MARKETS EX US PE/VC INDEX VINTAGE YEAR RETURNS:
NET FUND-LEVEL PERFORMANCE
As of June 30, 2018 • USD Terms • Percent (%)
Source: Cambridge Associates LLC.
Note: Vintage year fund-level returns are net of fees, expenses, and carried interest.
Compared with the previous six-month period (July 2017 – December 2017), limited partner (LP) contribution and distribution amounts were both lower in first half 2018, more dramatically so for contributions than distributions. Developed markets PE/VC funds called $11.8 billion from investors, a 52% drop, and distributions totaled $29.6 billion, a 9% decline. Distributions continued to outpace contributions, a trend that began in 2011.
Managers of funds raised from 2012 to 2016 called $10.8 billion, or 91% of the total capital called during the first two quarters. Three of those vintages each called more than $2.0 billion (2012 and 2015–16), with the 2015 vintage calling nearly $4 billion. Five vintages, 2006–07 and 2011–13, each distributed at least $2.0 billion for a combined amount of $24.8 billion (84% of total distributions). The 2012 vintage year led the way, distributing almost $9 billion.
Sectors
Figure 3 shows the GICS sector breakdown of the Developed ex US Markets Private Equity and Venture Capital Index and a public market counterpart, the MSCI EAFE Index. The breakdown provides context when comparing the performance of the two indexes. The chart highlights the relative overweights in the PE/VC index, such as consumer discretionary, IT, and healthcare, and the underweights in financials and consumer staples. It is worth noting that Standard & Poor’s redefined GICS sector classifications in September 2018 and, as a result, a large number of companies shifted from one sector to another, which will lead to different GICS sector breakdowns for both the public and private indexes in future analyses.
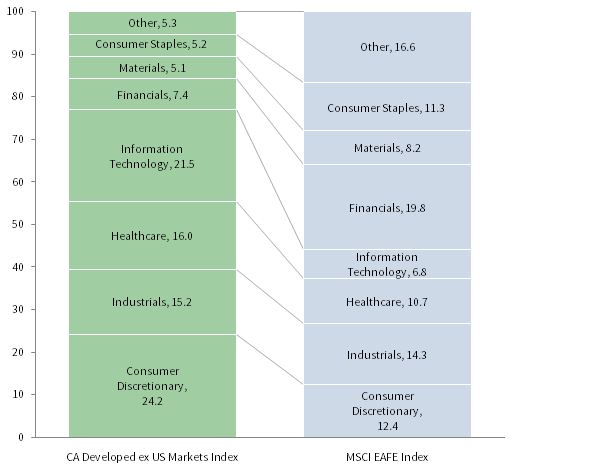
FIGURE 3 CA DEVELOPED MARKETS EX US PE/VC VS MSCI EAFE
As of June 30, 2018 • GICS Sector Comparisons • Percent (%)
Sources: Cambridge Associates LLC, FactSet Research Systems, and MSCI Inc. MSCI data provided “as is” without any express or implied warranties.
Notes: The Global Industry Classification Standard (GICS®) was developed by and is the exclusive property and a service mark of MSCI Inc. and S&P Global Market Intelligence LLC and is licensed for use by Cambridge Associates. Other includes sectors that make up less than 3% of the CA benchmark.
All seven meaningfully sized sectors earned positive returns for first half 2018 in both USD and euro terms, with performance in euros being the stronger of the two (Figure 4). Among the key sectors, IT earned the highest return and financials the lowest. No key vintage year suffered losses in the IT sector; the 2007 and 2012 vintages had the largest increases. The financials sector return was the lowest among the key components of the index, with muted write-ups in most vintages and write-downs in the 2006 group. The four largest sectors—consumer discretionary, IT, healthcare, and industrials (in rank order)—represented 77% of the index’s value and, on a USD-weighted basis, returned 8.7%.
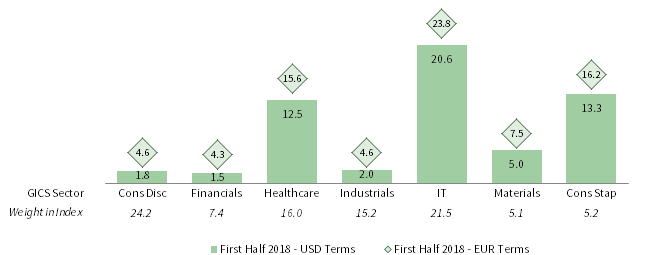
FIGURE 4 DEVELOPED MARKETS EX US PE/VC INDEX SECTOR RETURNS:
GROSS COMPANY-LEVEL PERFORMANCE
As of June 30, 2018 • Percent (%)
Source: Cambridge Associates LLC.
Note: Industry-specific gross company-level returns are before fees, expenses, and carried interest.
Consumer (discretionary and staples combined), IT, healthcare, and industrials companies (in rank order) attracted almost 80% of the capital invested during first half 2018; consumer alone garnered about 30% (roughly two-thirds discretionary, one-third staples).
Countries
In USD terms, three of the seven meaningfully sized countries in the index (accounting for 72% of its value) posted double-digit positive returns during the first two quarters (Figure 5); as with the sectors, returns in EUR terms were higher, helping five of the large countries produce double-digit returns in EUR terms. Companies based in the Netherlands (a top performer in the second half of 2017) were the best performing, with two vintages, 2007 and 2013, contributing the most to returns. For German companies—the worst performers among the large countries—valuation fluctuations were minimal across the vintages, with some seeing small write-downs and some seeing small write-ups. For the six-month period, the gross dollar-weighted return for the three largest countries—the United States,[2]Funds in the developed markets ex US PE/VC benchmark primarily invest in companies in Europe, but occasionally make investments in US companies as well. This is particularly true of “global” … Continue reading the United Kingdom, and Germany—was 8.8%, about 15 basis points higher than the index’s total gross return.

FIGURE 5 DEVELOPED MARKETS EX US PE/VC INDEX COUNTRY RETURNS:
GROSS COMPANY-LEVEL PERFORMANCE
As of June 30, 2018 • Percent (%)
Source: Cambridge Associates LLC.
Note: Industry-specific gross company-level returns are before fees, expenses, and carried interest.
Companies in developed European countries attracted 86% of the capital invested during the first two quarters, about 8% higher than the long-term norm for the region. Businesses in the United States and developed Asia garnered about 11% of the capital invested, more than 6% shy of their long-term allocations (the United States accounted for the entire shortfall).
Emerging Markets Private Equity and Venture Capital Performance Insights
Vintage Years
During the first six months, there were eight vintage years (2007, 2008, 2010–15) that accounted for at least 5% of the emerging markets index’s value; combined, the eight represented 85% of the index’s value (Figure 6). All eight vintages produced positive returns for first half 2018, contributing to healthy year-to-date performance (6.0%). Performance among these vintages was quite varied, with returns ranging from 0.0% (2007) to 13.6% (2014).

FIGURE 6 EMERGING MARKETS PE/VC INDEX VINTAGE YEAR RETURNS:
NET FUND-LEVEL PERFORMANCE
As of June 30, 2018 • USD Terms • Percent (%)
Source: Cambridge Associates LLC.
Note: Vintage year fund-level returns are net of fees, expenses, and carried interest.
Write-ups in IT were the main driver for the best-performing vintage, 2014. The lowest-returning vintage, 2007, was impacted by write-offs in most sectors, primarily financials, healthcare, and industrials, but offset by significant write-ups in IT. At the close of first half 2018, the largest vintage year was 2011, representing over 15% of the index. It posted a 7.0% return in the first half, despite being the only meaningfully sized vintage to post a negative return in the second quarter. Its write-ups were almost exclusively in IT and occurred in the first quarter.
During the first half, emerging markets PE/VC funds called $10.9 billion from investors, an almost 22% decrease from the prior six month period but slightly above the ten-year semi-annual average of $9.4 billion. Managers distributed just over $11.4 billion year-to-date, which represented a 30% decrease from the prior six-month period. Even so, the amount distributed was the fifth largest sum for any six-month period since the inception of the index in 1986—all five occurred in the past four years. Since 1986, distributions have outpaced contributions in slightly more than 15% of the semi-annual periods, but in the past five years they have outpaced contributions in 60% of the semi-annual periods.
Managers of funds that were raised in 2014–16 called the majority of capital in first half 2018, totaling over $7.5 billion and about 70% of all capital called year-to-date. These three vintages, in the heart of their investment periods, called more than $2.3 billion each. On the distributions front, managers in five vintage years (2007–08 and 2010–12) returned at least $1.0 billion to LPs, for a combined total of $8.0 billion, or 70% of the period’s total. Managers with 2007 vintage funds, the oldest vintage of those meaningfully sized, returned the most capital, topping $2.1 billion for first half 2018.
Sectors
Figure 7 shows the GICS sector breakdown of the Emerging Markets PE/VC Index and a public market counterpart, the MSCI Emerging Markets Index. The breakdown provides context when comparing the performance of the two indexes. The chart highlights the relative overweights in the PE/VC index, such as consumer discretionary, healthcare, and industrials, and the underweights in financials, energy, and materials. As mentioned previously, Standard & Poor’s redefined GICS sector classifications in September 2018 and, as a result, a large number of companies shifted from one sector to another, which will lead to different GICS sector breakdowns for both the public and private indexes in future analyses.
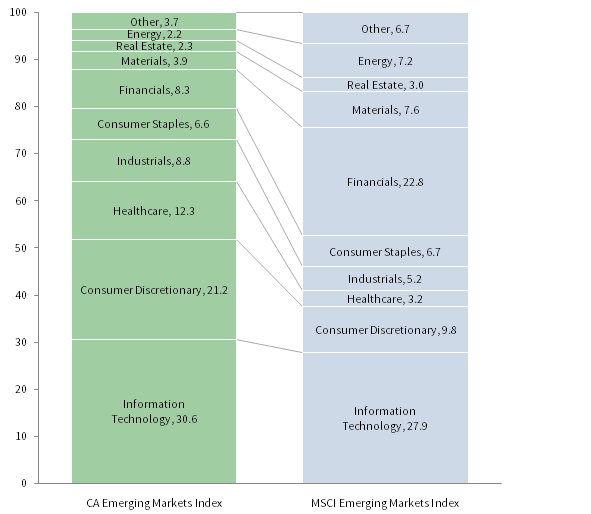
FIGURE 7 CA EMERGING MARKETS PE/VC VS MSCI EMERGING MARKETS
As of June 30, 2018 • GICS Sector Comparisons • Percent (%)
Sources: Cambridge Associates LLC, FactSet Research Systems, and MSCI Inc. MSCI data provided “as is” without any express or implied warranties.
Notes: The Global Industry Classification Standard (GICS®) was developed by and is the exclusive property and a service mark of MSCI Inc. and S&P Global Market Intelligence LLC and is licensed for use by Cambridge Associates. Other includes sectors that make up less than 3% of the CA benchmark.
Five of the six meaningfully sized sectors posted positive first half returns (Figure 8). IT was a runaway leader, returning 21.3% for the period, which represented a marked change from the prior year when IT returned 8.3% in the first half and 13.4% in the second half. In first half 2018, just shy of 80% of the IT write-ups were attributed to investments made by funds formed in 2008, 2010–11, and 2014–15; 2011 vintage funds saw the most appreciation. Returns for the other five sectors were between -2.5% (industrials) and 7.7% (healthcare). On a gross, dollar-weighted basis, the three largest sectors by market value—IT, consumer discretionary, and healthcare—returned 12.0% during the first half, outperforming the return for all companies by over 4.5 percentage points (ppts).
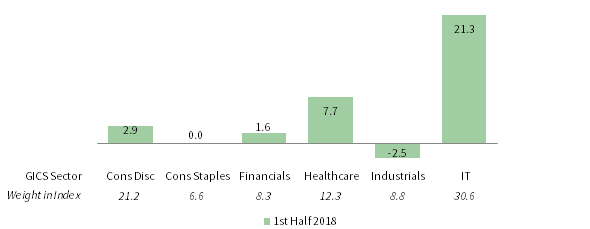
FIGURE 8 EMERGING MARKETS PE/VC INDEX SECTOR RETURNS:
GROSS COMPANY-LEVEL PERFORMANCE
As of June 30, 2018 • USD Terms • Percent (%)
Source: Cambridge Associates LLC.
Note: Industry-specific gross company-level returns are before fees, expenses, and carried interest.
Compared with second half 2017, the investment pace in this period was slightly slower (a decrease of about 12%). Companies across four sectors (in rank order: IT, consumer discretionary, healthcare, and industrials) garnered 80% of the capital invested in the first six months of 2018, with consumer discretionary and IT alone attracting over 50% of all capital. Over the long term, managers in the emerging markets index have allocated 63% of their capital to these four sectors, with IT accounting for the biggest difference between the current six months (28%) and the long-term norm (17%).
Countries
Highlighting the index’s geographic concentration, China remains, by far, the largest country component of the index (Figure 9). India and South Korea continue as constituents in the meaningfully sized group, and the United States is a new addition in 2018, composing 5.5% of the index.[3]Funds in the emerging markets PE/VC benchmark occasionally invest in companies in developed markets regions, as well as the emerging markets regions Five other countries—Australia, Brazil, Hong Kong, Japan, and Singapore—represented between 2.1% and 3.3% of the index.
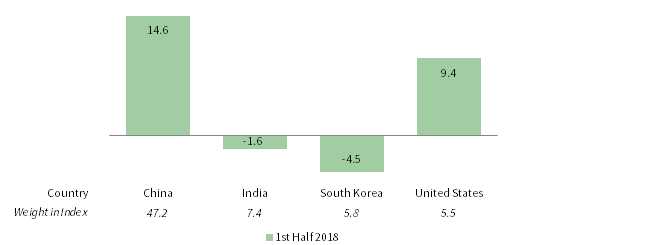
FIGURE 9 EMERGING MARKETS PE/VC INDEX COUNTRY RETURNS:
GROSS COMPANY-LEVEL PERFORMANCE
As of June 30, 2018 • USD Terms • Percent (%)
Source: Cambridge Associates LLC.
Note: Industry-specific gross company-level returns are before fees, expenses, and carried interest.
China-based companies again received more capital than any other country, 31% of invested capital. Surprisingly, the United States received the second highest amount of capital year-to-date, roughly 17% of all invested capital, and about 10% more than the long-term average.
On a gross dollar-weighted basis, when combined, companies based in China, India, South Korea, and the United States returned nearly 10.2%, almost 3 ppts more than the full index in first half 2018.
Caryn Slotsky, Senior Investment Director
Jacob Gilfix, Senior Investment Associate
Sarah Grifferty, Investment Associate
About the Cambridge Associates LLC Indexes
Cambridge Associates derives its Global ex US Developed Markets Private Equity and Venture Capital Index from the financial information contained in its proprietary database of global ex US private equity and venture capital funds. As of June 30, 2018, the database comprised 798 global ex US developed markets buyouts, growth equity, and venture capital funds formed from 1986 to 2017 with a value of about $257 billion. Ten years ago, as of June 30, 2008, the benchmark index included 501 global ex US developed markets funds, whose value was roughly $178 billion. The funds in this index invest primarily in developed markets in Australia, Canada, Israel, Japan, New Zealand, Singapore, and Western Europe.
Cambridge Associates derives its Emerging Markets Private Equity and Venture Capital Index from the financial information contained in its proprietary database of global ex US buyouts, growth equity, and venture capital funds. As of June 30, 2018, the database comprised 650 emerging markets private equity and venture capital funds formed from 1986 to 2017 with a value of about $209 billion. Ten years ago, as of June 30, 2008, the benchmark index included 347 emerging markets funds, whose value was about $54 billion. The funds in this index invest primarily in Africa, emerging Asia, emerging Europe, Latin America & Caribbean, and the Middle East ex Israel.
The pooled returns represent the net periodic rates of return calculated on the aggregate of all cash flows and market values as reported to Cambridge Associates by the funds’ general partners in their quarterly and annual audited financial reports. These returns are net of management fees, expenses, and performance fees that take the form of carried interest.
About the Public Indexes
The MSCI All Country World Index (ACWI) is a free float–adjusted, market capitalization– weighted index designed to measure the equity market performance of developed and emerging markets. As of June 30, 2018, the MSCI ACWI consisted of 47 country indexes comprising 23 developed and 24 emerging markets country indexes. The developed markets country indexes included are: Australia, Austria, Belgium, Canada, Denmark, Finland, France, Germany, Hong Kong, Ireland, Israel, Italy, Japan, the Netherlands, New Zealand, Norway, Portugal, Singapore, Spain, Sweden, Switzerland, the United Kingdom, and the United States. The emerging markets country indexes included are: Brazil, Chile, China, Colombia, Czech Republic, Egypt, Greece, Hungary, India, Indonesia, Korea, Malaysia, Mexico, Pakistan, Peru, the Philippines, Poland, Qatar, Russia, South Africa, Taiwan, Thailand, Turkey, and the United Arab Emirates.
The MSCI EAFE Index is a free float–adjusted, market capitalization–weighted index that is designed to measure large- and mid-cap equity performance of developed markets, excluding Canada and the United States. As of June 30, 2018, the MSCI EAFE Index consisted of the following 21 developed markets country indexes: Australia, Austria, Belgium, Denmark, Finland, France, Germany, Hong Kong, Ireland, Israel, Italy, Japan, the Netherlands, New Zealand, Norway, Portugal, Singapore, Spain, Sweden, Switzerland, and the United Kingdom.
The MSCI Emerging Markets Index is a free float–adjusted, market capitalization–weighted index that is designed to measure large- and mid-cap equity performance of emerging markets. As of June 30, 2018, the MSCI Emerging Markets Index included 24 emerging markets country indexes: Brazil, Chile, China, Colombia, Czech Republic, Egypt, Greece, Hungary, India, Indonesia, Korea, Malaysia, Mexico, Pakistan, Peru, the Philippines, Poland, Qatar, Russia, South Africa, Taiwan, Thailand, Turkey, and the United Arab Emirates.
The MSCI World Index represents a free float–adjusted, market capitalization–weighted index that is designed to measure the equity market performance of developed markets. As of June 30, 2018, 2017, it includes 23 developed markets country indexes: Australia, Austria, Belgium, Canada, Denmark, Finland, France, Germany, Hong Kong, Ireland, Israel, Italy, Japan, the Netherlands, New Zealand, Norway, Portugal, Singapore, Spain, Sweden, Switzerland, the United Kingdom, and the United States.
Footnotes