Overview
During the second quarter, the Cambridge Associates LLC Global ex US Developed Markets Private Equity and Venture Capital (PE/VC) Index rose 4.9% in US$ terms, its eighth consecutive positive quarter. The Emerging Markets PE/VC Index returned 4.6% in US$ terms. The euro weakened slightly in the second quarter and had little impact on returns when measured in US dollars. Non-US public markets bounced back in the second quarter, with the emerging markets index outperforming those tracking stocks in global developed markets. The PE/VC benchmark for developed markets ex US outperformed its public counterpart in the second quarter but the emerging markets PE/VC index fell short of its public market peer. Both the developed and emerging markets PE/VC indexes have beaten the public indexes over the long term.
Performance for the Cambridge Associates LLC Global ex US Developed Markets and Emerging Markets PE/VC indexes is derived from data compiled from institutional-quality funds raised between 1986 and 2014. There are more than 700 funds in the developed markets index and over 500 in the emerging markets index. Funds in the global ex US developed markets PE/VC index primarily invest in companies in Europe, but occasionally make investments in US companies as well.
Second Quarter 2014 Highlights
- The developed markets PE/VC index outperformed the comparable public equity index (MSCI EAFE) in all time periods ending June 30, 2014, with particularly wide spreads in the longer horizons (Table 1).
- With the exception of the most recent quarter, the emerging markets PE/VC index bested its corresponding public markets benchmark (MSCI Emerging Markets Index) across all the periods highlighted in the table. The outperformance was strongest for the one-, three-, and five-year periods.
- Geographic concentration continued to be a theme in both the developed and emerging markets PE/VC indexes. The developed markets index was dominated by Western Europe and only two countries, China and India, represented more than 5% of the emerging markets index. Another five accounted for between 3% and 4% each.
- Based on market values at June 30, 2014, public companies accounted for nearly 15% of the developed markets PE/VC index, a small decrease from the prior quarter. At 19%, public company exposure in the emerging markets PE/VC index was virtually unchanged from the first quarter.
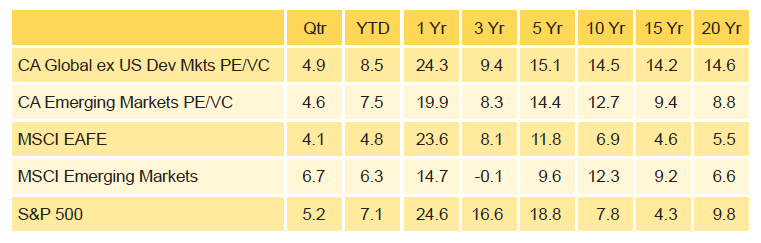
Table 1. Returns for the Global ex US Developed and Emerging Markets PE/VC Indexes vs Public Counterparts
US$ Terms • Percent (%)
Sources: Cambridge Associates LLC, MSCI Inc., Standard & Poor’s, and Thomson Reuters Datastream. MSCI data provided “as is” without any express or implied warranties.
Notes: The global ex US developed markets index includes private equity and venture capital funds that invest primarily in developed markets in Asia/Pacifi c, Europe, and/or the Middle East as well as in Canada. The emerging markets index includes private equity and venture capital funds that invest primarily in Africa and/or Latin America & Caribbean as well as emerging countries in Asia/Pacifi c, Europe, and the Middle East. Because the indexes are capital weighted, performance is mainly driven by the largest vintage years. The PE/VC indexes’ returns are based on limited partners’ fund-level performance; the returns are net of fees, expenses, and carried interest.
Global ex US Developed Markets Private Equity and Venture Capital Performance Insights
- In second quarter 2014 the number of vintage years that represented at least 5% of the index expanded to six—two more than in the previous quarter. Among those six “meaningfully sized” vintages, 2011 earned the quarter’s best return and 2005 the lowest (Table 2). The consumer sector was the largest contributor to performance for the 2011 funds, with smaller, yet sizeable, write-ups coming from health care, manufacturing, and software. For the 2005 vintage, write-ups in consumer, health care, and manufacturing were partially offset by losses in energy and IT.
- The two largest vintages, 2006 and 2007, had strong quarters but the drivers of performance were quite different. The 2006 funds enjoyed large write-ups in the consumer and media sectors while suffering losses in health care and IT. The 2007 vintage saw its largest write-ups in chemicals and manufacturing, with fairly significant write-downs in consumer companies. The top six vintages represented almost 82% of the index.
- Developed markets private equity and venture capital funds called $6.2 billion from investors during the quarter, a 28% decrease from the prior quarter. Distributions totaled $14.7 billion, which represented a 62% increase from previous quarter’s total. Distributions have now outpaced contributions for nine consecutive quarters.
- Managers of funds raised in 2007, 2008, and 2010–12 called $5.5 billion, or 89% of the total capital called during the quarter. All five of those vintage years each called more than $850 million. Vintage years 2005 through 2008 each distributed more than $1.5 billion, with the 2006 vintage leading the way with more than $5 billion of distributions. Combined, these four vintage years accounted for 87% of the total capital distributed in the quarter.
- All seven meaningfully sized sectors earned positive returns for the quarter (Table 3). Once again, the media sector was far and away the top performer with a nearly 19% return, extending the sector’s streak of strong performance that began in 2012. Vintage years 2004 and 2006 were the primary contributors to the sector’s valuation increases. IT produced the quarter’s lowest return, 2.5%, due in part to modest gains in vintage years 2007 through 2010 coupled with write-downs in the 2006 vintage. The three largest sectors—consumer, health care, and IT—represented nearly half of the index’s value and on a dollar-weighted basis returned 4.0%.
- The consumer, financial services, and IT sectors attracted the most capital during the quarter—57% of the total. IT company investments alone represented 24% of the capital deployed in the quarter, which is about 15% higher than the sector’s long-term norm.
- All five of the countries representing the bulk of the index posted positive returns during the second quarter (Table 4). Returns ranged from 1.8% for companies headquartered in Sweden to 10.0% for those based in France. Companies headquartered in Western Europe and in the United States represented about 87% of the index and were responsible for an equal amount of the write-ups during the quarter. Canadian company representation in the index was roughly 2% but accounted for about 5% of the write-ups.
- Western European companies attracted 77% of the capital invested during the quarter, equal to the long-term norm for the region. Similarly, investment in US-based companies (12% of total) was also the same as its historical average.
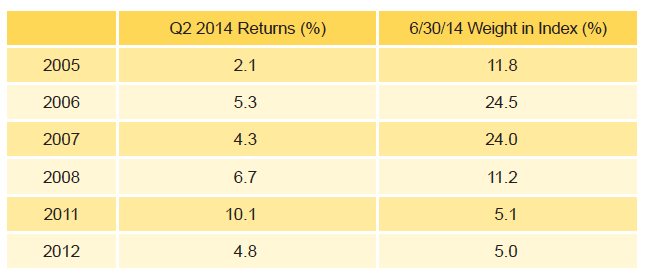
Table 2. Global ex US Developed Markets PE/VC Index Vintage Year Returns: Net Fund-Level Performance
Notes: Returns in US$ terms. Vintage year fund-level returns are net of fees, expenses, and carried interest.
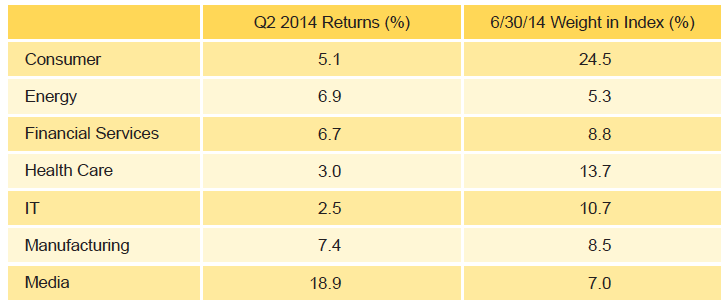
Table 3. Global ex US Developed Markets PE/VC Index Sector Returns: Gross Company-Level Performance
Notes: Returns in US$ terms. Industry-specific gross company-level returns are before fees, expenses, and carried interest.
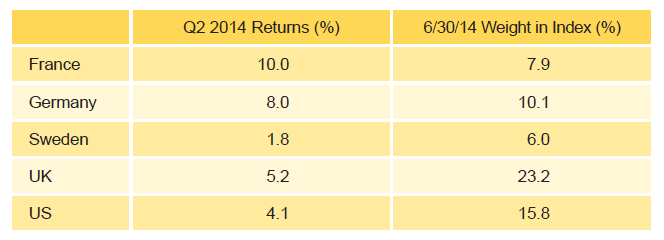
Table 4. Global ex US Developed Markets PE/VC Index Regional Returns: Gross Company-Level Performance
Notes: Returns in US$ terms. Geographic region–specific gross company-level returns are before fees, expenses, and carried interest.
Emerging Markets Private Equity and Venture Capital Performance Insights
- By the end of second quarter 2014, seven vintages accounted for more than 92% of the emerging markets PE/VC index (Table 5).
Funds raised in 2011 earned the best return among the seven vintages, and the IT sector was the primary driver of performance. The 2008 vintage produced the lowest return of the large vintage years, due to only modest gains and losses across all of the sectors. With nearly 32% of the index’s value residing in vintage year 2007, that fund group had the greatest impact on the benchmark’s return. Its return was boosted by healthy gains in six sectors, led by consumer and IT. - In second quarter 2014, emerging markets private equity and venture capital funds called $4.7 billion from investors, a 35% increase from the prior quarter. Distributions totaled $7.1 billion, representing a more than 66% increase from previous quarter’s total, and by far the largest ever quarterly distribution level. This marks the fourth quarter in the past six that distributions outnumbered contributions, which is a bit of an aberration. Over the last ten years, in only nine quarters have distributions been higher than contributions.
- Managers of funds raised in 2011 called the most capital for the quarter, $2.2 billion, or 48% of the total. Vintage years 2006 and 2007 combined to distribute nearly $6.0 billion to LPs, which represented 84% of total distributed in the quarer.
- All six of the meaningfully sized sectors posted positive quarterly returns (Table 6). IT earned the best return at 13.4%, while health care and manufacturing tied for the lowest return at 2.1%. IT sector write-ups were healthy in five vintage years, led by 2006, which accounted for nearly half of the sector’s performance. For health care, write-ups in 2008 and 2009 vintages were largely offset by write-downs in the 2006 group. For manufacturing, only one vintage year, 2007, had a strong positive quarter, all others experienced either modest losses or modest gains.
- On a gross, dollar-weighted basis, the six large sectors by market value—consumer, IT, manufacturing, health care, financial services, and energy—returned 5.6% during the quarter, slightly outperforming the return for all companies.
- Consumer, health care, and manufacturing companies were the top-three recipients of invested capital during the quarter, accounting for about 57% of the total. On a percentage basis, health care attracted just over twice the capital as it has over the long term.
- Highlighting the index’s geographic concentration, China and India were the only two countries that made up more than 5% of the index by market value, and together they accounted for nearly 47% of the index (Table 7). Five countries—Australia, Brazil, Russia, Singapore and South Korea—each represented more than 3% of the index. Concentration was also evident in where capital was directed, with companies headquartered in emerging Asia attracting 61% of the total invested by managers in the index. Companies located in developed Asia attracted about 13% of invested capital, more than those in Africa, emerging Europe, and Latin America, which all garnered less than 10% each.
- On a dollar-weighted basis, China and India returned 5.5%. India earned the best return among the countries representing more than 3% of the index.
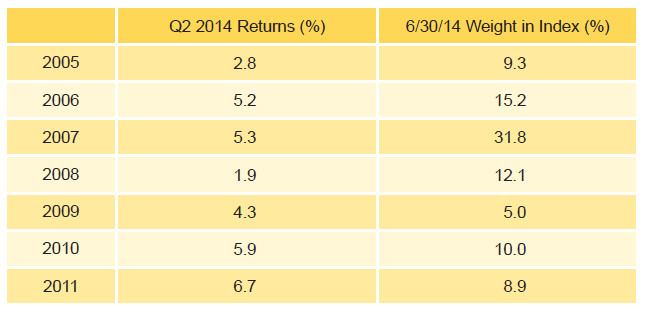
Table 5. Emerging Markets PE/VC Index Vintage Year Returns: Net Fund-Level Performance
Notes: Returns in US$ terms. Vintage year fund-level returns are net of fees, expenses, and carried interest.
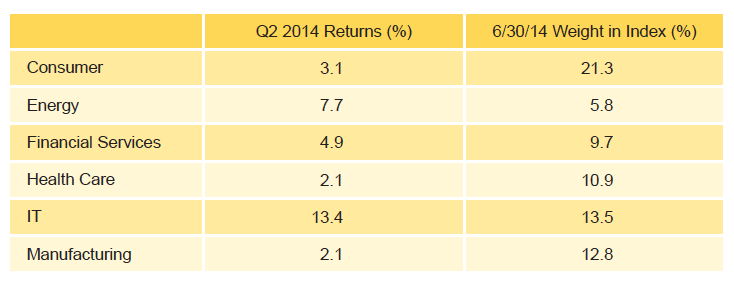
Table 6. Emerging Markets PE/VC Index Sector Returns: Gross Company-Level Performance
Notes: Returns in US$ terms. Industry-specific gross company-level returns are before fees, expenses, and carried interest.
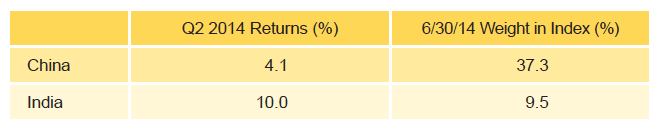
Table 7. Emerging Markets PE/VC Index Regional Returns: Gross Company-Level Performance
Notes: Returns in US$ terms. Geographic region–specific gross company-level returns are before fees, expenses, and carried interest.
About the Indexes
Cambridge Associates derives its Global ex US Developed Markets Private Equity and Venture Capital Index from the financial information contained in its proprietary database of global ex US private equity and venture capital funds. As of June 30, 2014, the database comprised 713 global ex US developed markets private equity and venture capital funds formed from 1986 to 2014 with a value of about $297 billion. Ten years ago, as of June 30, 2004, the benchmark index included 337 global ex US developed markets funds, whose value was roughly $64 billion.
Cambridge Associates derives its Emerging Markets Private Equity and Venture Capital Index from the financial information contained in its proprietary database of global ex US private equity and venture capital funds. As of June 30, 2014, the database comprised 538 emerging markets funds formed from 1986 to 2014 with a value of about $138 billion. Ten years ago, as of June 30, 2004, the benchmark index included 192 emerging markets funds, whose value was $14.5 billion.