Frontier markets burst onto the investment scene a little over a decade ago. Global investors that had previously elevated emerging markets (EM) equities from the fringes into the mainstream wondered if this additional market category could prove similarly fruitful. Then the global financial crisis (GFC) hit. Both markets collapsed by more than 50% in 2008,[1]Both markets were down more than 50% in USD terms. In local currency terms, the MSCI Emerging Markets Index was down 46% in 2008. but frontier markets did not recover nearly as strongly as emerging markets in 2009. Since then, frontier markets have outpaced their emerging markets counterparts.
Investor interest in frontier markets has waxed and waned with performance (both the absolute return of frontier markets (FM) equities and the relative return of FM versus EM equities). This, combined with skimpy liquidity and capacity, has caused the supply of high-quality investment strategies to remain somewhat limited. While investors today have more options to gain access to frontier markets, many institutional investors continue to bypass them.
The low level of institutional interest might stem in part from uncertainties and misconceptions surrounding frontier markets and their role in a well-diversified, global portfolio. Some investors believe that FM countries are at an earlier, faster-growing stage of economic development than EM countries (not necessarily accurate; their equity markets are undeveloped, but their economies may or may not be); others contend that frontier markets are more risky than emerging markets (not necessarily true); and some investors believe that the attractive frontier demographics will drive strong returns (there is scant evidence connecting a country’s growth to its stock market returns).
This publication aims to clear up the confusion and help investors to decide whether and how to integrate FM-listed equities into their portfolios, and how to assess their underappreciated risks. Finally, we detail important implementation considerations for investors interested in adding frontier exposure to their portfolios.
What Are Frontier Markets?
Are frontier markets corrupt, politically driven, and dangerously speculative? Or, are they budding blossoms destined to deliver strong returns? In reality, the “frontier markets” label applies to a diverse collection of economies, as index firms determine classifications by market size and accessibility, not stage of economic development. For instance, Bangladesh has a per capita GDP of about US$1,500, while Estonia has a per capita GDP of about US$20,000; however, because of their market size and accessibility, both are classified as frontier markets by MSCI.
Frontier markets are diverse from one another, but all are marginally investable by a committed and patient global investor. While frontier markets may have restrictions on foreign ownership of listed companies, they won’t have outright prohibitions. The liquidity of a frontier country’s equity market is often thin, but it is typically sufficient to allow patient portfolio managers to move in and out over time. However, countries with no restrictions on global investors and with reasonably deep and liquid capital markets will generally not remain in the FM index for long.
As of June 2019, MSCI tracks more than 80 markets globally: 23 are categorized as developed markets and another 26 as emerging markets. The remaining countries are classified as frontier markets, of which only 20 countries and one economic region[2]The West African Economic and Monetary Union (WAEMU) consists of eight countries. At time of writing, securities from three of these countries—Burkina Faso, Ivory Coast, and Senegal—were included … Continue reading are included in the MSCI Frontier Markets (FM) Index. The remaining 11 countries classified as frontier markets are currently excluded from any index because investors can’t effectively buy or sell shares. The MSCI FM Index launched on December 18, 2007, with backfilled history to May 2002.
Because of the nature of how index providers define frontier markets, the category is quite fluid. When liquidity and capital markets develop within a country, that country may be reclassified as an emerging market, as Pakistan was in 2017. If those same characteristics deteriorate, a country may be demoted to standalone market status, as Ukraine was in 2015. Often, the largest index components get promoted, as was the case with Argentina in 2019, and is expected to happen with Kuwait in 2020. Such promotions force index-tracking funds to sell the shares from the departing market and to replace the missing exposure by purchasing shares in the remaining countries, some of which have very small and illiquid markets. Figure 1 illustrates how frequently these transitions can occur.

FIGURE 1 IMPACT OF MSCI FRONTIER MARKETS INCLUSION/REMOVAL
2008–19 • Free-Float Market Cap in US$M
Sources: MSCI Inc. and Thomson Reuters Datastream. MSCI data provided “as is” without any express or implied warranties.
Notes: Only years in which inclusion or removal occurred are included. Insignificant inclusions and removals are not shown. Each blue column represents the market value at the prior year-end, net of the approximate value of additions or subtractions in the year shown. For example, the 2014 column shows the 2013 year-end market value, net of the 2014 year-end market value of Qatar and UAE. Green bars with up arrows represent promotions to the MSCI Emerging Markets Index, while green bars with down arrows represent demotions from Emerging Markets to Frontier Markets. Red bars represent removal from the MSCI FM index. “Potentially 2020” represents MSCI FM and Kuwait market-cap data through June 30, 2019. Argentina was reclassified to the Emerging Markets Index on May 29, 2019.
To read more about the disruptive impact of one such transition, please see Sean McLaughlin, “New Frontiers: Qatar and UAE Graduate to Emerging Status, Leaving a Less Liquid Index Behind,” Cambridge Associates Research Brief, 2014.
While these transitions ensure that the frontier index does what it says on the tin—that its component countries remain investable but not mainstream—investors should bear in mind that these lumpy transitions are costly and can cause index funds to badly lag their benchmarks. As an example, over the past five years and since inception, the iShares MSCI Frontier 100 ETF has lagged its benchmark by an annualized 2 percentage points (ppts), a much deeper lag than is typical for EM ETFs and index funds.
Characteristics of Frontier Markets
While the small market capitalization and low liquidity of frontier markets are defining features, these markets also have other characteristics that differ from emerging and developed markets.
Sector Exposures are Bank-Heavy, Tech-Light
Many FM economies, particularly those in the Middle East, are structured around the extraction and processing of oil and other natural resources. Countries with dominant energy sectors also built banking sectors to support these capital intensive industries. As a result, the MSCI FM Index currently has a hefty 49% weighting to the financial sector. While energy pricing is very important to FM economies and oil price declines can flow through to currencies and to revenues across many sectors, energy companies across the regions tend to be state-owned. Thus, the index has only a moderate 3% exposure to energy stocks. Technology, which holds a sizable allocation in both the MSCI World and MSCI Emerging Markets Indexes, is nonexistent in the MSCI FM Index. The low allocation to consumer-oriented sectors is one reason investors should not assume that these markets’ superior demographics and promising growth prospects will translate into world-beating returns (Figure 2).
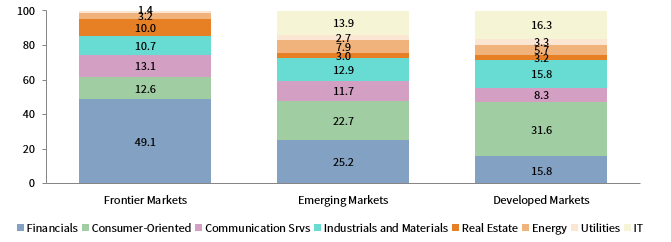
FIGURE 2 INDEX SECTOR BREAKDOWN
As of March 31, 2019
Sources: FactSet Research Systems and MSCI Inc. MSCI data provided “as is” without any express or implied warranties.
Notes: Consumer-oriented includes consumer discretionary, consumer staples, and heathcare sectors. Frontier Markets, Emerging Markets, and Developed Markets data are represented by the MSCI Frontier Markets Index, MSCI Emerging Markets Index, and MSCI World Index, respectively.
Individual Frontier Countries March to Different Drummers
Some frontier countries have more locally and/or regionally focused economic drivers than many developed and emerging economies. While this is not a criterion in their classification, frontier countries generally have less mature economies, with more focus in one or two specific sectors. Moreover, trading in these markets is less globally integrated than in emerging and developed markets. This combination of factors enables FM countries to behave more differently from one another than is the case for EM or DM countries.
As a result, FM countries have low, and in some cases negative, correlations with each other. For the five-year period ended June 30, 2019, the largest five countries by weight in the FM index had an average inter-country correlation of 0.22, compared to 0.51 for the largest five countries within the EM index.[3]The largest five markets for the MSCI Frontier Index are Kenya, Kuwait, Morocco, Nigeria, and Vietnam. The largest five markets for the MSCI Emerging Markets Index are Brazil, China, India, South … Continue reading Low correlations of the underlying FM countries mean that investment returns typically do not move in tandem. The average correlations of FM single-country indexes have been significantly below the average of EM single-country indexes, suggesting that, in the aggregate, frontier markets are more diverse than emerging markets (Figure 3). However, if these markets become substantially more popular with global investors, correlations are likely to increase over time.

FIGURE 3 AVERAGE INTER-COUNTRY CORRELATIONS
January 1, 2008 – June 30, 2019
Sources: FactSet Research Systems and MSCI Inc. MSCI data provided “as is” without any express or implied warranties.
Notes: Correlations are calculated using a basket of the countries currently included in each index. Frontier, Emerging, and Developed markets data are represented by the MSCI Frontier Markets Index, MSCI Emerging Markets Index, and MSCI World Index, respectively.
The flipside of these low correlations is lack of diversification within countries. No single country within the MSCI FM Index has exposure in all 11 GICS sectors. Vietnam has exposure in seven of 11, but 18 countries in the index have exposures in no more than four sectors. By comparison, more than half of the countries in the EM index have exposure in seven or more sectors, and only seven have exposures in no more than four sectors. Thus, the same country-specific nuances responsible for creating very attractive levels of inter-country diversification are also responsible for creating high levels of single country volatility. For the five years ended June 30, 2019, every country in the MSCI FM Index carried a greater standard deviation of returns than the index itself, and more than half had greater volatility than the MSCI EM Index (Figure 4). However, it is worth noting that the level of volatility of individual FM countries is in line with the volatility of individual EM countries.
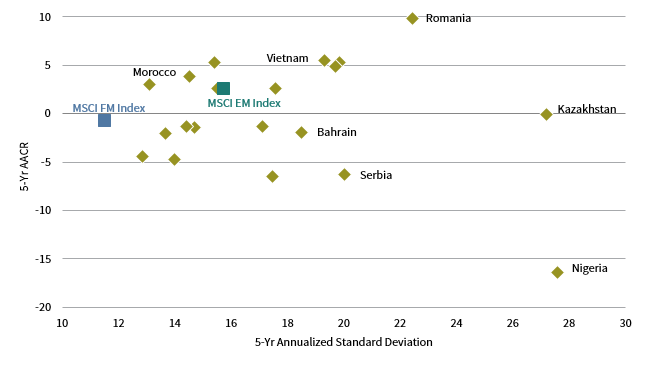
FIGURE 4 ANNUALIZED STANDARD DEVIATION VS ANNUALIZED RETURNS
As of June 30, 2019 • US Dollar • Percent (%)
Sources: MSCI Inc. and Thomson Reuters Datastream. MSCI data provided “as is” without any express or implied warranties.
Notes: Countries that were included in the MSCI Frontier Markets Index for only a portion of the five-year period (including Pakistan, Qatar, and the United Arab Emirates) are not shown. Annualized returns are total returns net of dividend taxes.
Despite individual FM and EM countries having similarly high levels of volatility, the MSCI FM Index has typically been less volatile than the EM index. This stems from the FM index’s lower inter-country correlations, which boosts the impact of diversification at the overall index level.
Currency Exposure Is Muted
While most EM shares are denominated in currencies that are quite volatile, many frontier markets are denominated in currencies that are effectively pegged to the US dollar. Comparing USD-denominated and local currency returns shows that EM returns tend to have a greater disparity between USD and local currency returns than frontier markets (Figure 5). Currency pegs can break, and when a peg is propping up an overvalued currency, the inevitable devaluation can be highly disruptive. But, currency-related volatility has typically been lower for global investors in frontier markets than in emerging markets. The median currency impact (i.e., the USD return less the local return) on rolling one-year returns since 2008 has been -151 basis points (bps) for frontier markets, compared to -276 bps for emerging markets. The discrepancy is more pronounced during periods of turmoil. During the market sell-off in 2015, EM index USD returns trailed local currency returns by as much as 13 ppts on a rolling 12-month basis; the FM index has never had a currency discrepancy of more than 9 ppts during any 12-month period.

FIGURE 5 CURRENCY IMPACT ON NET RETURNS
December 31, 2003 – June 30, 2019 • Rolling 1-Yr Return (%)
Sources: MSCI Inc. and Thomson Reuters Datastream. MSCI data provided “as is” without any express or implied warranties.
Notes: Total return data for all MSCI indexes are net of dividend taxes. Data are monthly.
Volatility Is Structurally Lower than Emerging Markets
Because of the greater intra-index country diversification and lower currency-related volatility, the MSCI FM Index is less volatile than the MSCI EM Index for USD-based investors (and for investors based in many other DM currencies, including the euro and GBP). Looking at rolling 36-month standard deviations, the FM index was less volatile than the EM index in every period since the beginning of 2008 when the index launched (Figure 6). And using daily returns to evaluate the annualized standard deviation of the two indexes over rolling one-year periods, the EM index was more volatile than the FM index in 93% of periods from mid-2002 to the end of 2018.
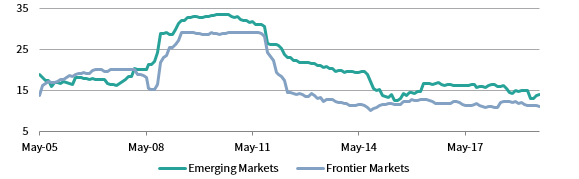
FIGURE 6 ROLLING 36-MONTH STANDARD DEVIATIONS
May 31, 2005 – June 30, 2019 • Percent (%)
Sources: FactSet Research Systems and MSCI Inc. MSCI data provided “as is” without any express or implied warranties.
Note: Emerging Markets and Frontier Markets data are represented by the MSCI Emerging Markets Index and MSCI Frontier Markets Index, respectively.
Returns Don’t Move in Lockstep with Other Equity Markets
FM equities have lower correlations with developed and emerging markets than those two have with each other. This has historically been an attractive investment characteristic for equity diversification purposes. However, as countries grow and develop, economies become more integrated with one another, and the global financial system becomes more fluid. FM correlations with developed and emerging peers have risen as equity markets become more economically and financially integrated.
Prior to the GFC, which also generally coincides with the period of backfilled data in the frontier index, the returns of FM equities were relatively uncorrelated with the returns to DM or EM equities, with average correlations of just 0.11 and 0.16, respectively. From October 2008 to the middle of 2013, correlations rose substantially, nearing an average of 0.81. From May 2013 through June 2019, correlations have ticked moderately lower to averages of 0.61 and 0.60 with developed and emerging markets, respectively (Figure 7).
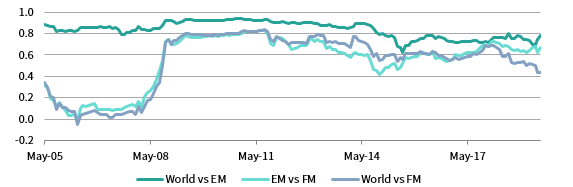
FIGURE 7 ROLLING 36-MONTH CORRELATIONS
May 31, 2005 – June 30, 2019
Sources: FactSet Research Systems and MSCI Inc. MSCI data provided “as is” without any express or implied warranties.
Note: World, EM, and FM markets data are represented by the MSCI World Index, MSCI Emerging Markets Index, and MSCI Frontier Markets Index, respectively.
Structural changes, such as frontier-specific ETFs, have allowed more investors to access frontier markets. As these trends continue to take hold, capital flows into frontier markets may begin to mirror capital flows observed across other parts of the globe.
Favorable Demographics and Growth: Will Returns Follow?
When discussing potential investment opportunities in frontier markets, investors often point to the strong growth potential and favorable demographics of these early-stage economies. At the heart of this investment case is the rise of the FM middle class and the associated rise in consumer spending across these developing frontier countries. However, these factors may not necessarily translate into earnings growth and high-investment returns. FM countries tend to have a large presence of state-owned enterprises, as well as multinational subsidiaries within key sectors. Thus, the windfalls from rapid growth of these sectors may first accrue to these closely held groups before spilling over into the financials-heavy equity indexes. Still, it can be helpful for investors to understand the economic environments of the countries in which they invest.
Growing Economies. The size of FM economies, as measured by GDP in aggregate, is small and, like other metrics, can widely vary. Economies in European frontier markets are among the index’s smallest. Nigeria is the largest economy in frontier markets, with a GDP of $376 billion in 2017. To put this in perspective, the size of Nigeria’s economy is only about 14% of India’s GDP and 3% of China’s GDP.
As a sub-asset class, it is not a surprise that frontier markets share some of the same favorable characteristics as emerging markets. For example, frontier economies are among the fastest-growing economies in the world. The figure below compares the real GDP growth between DM countries, EM countries, and FM countries since 2000.
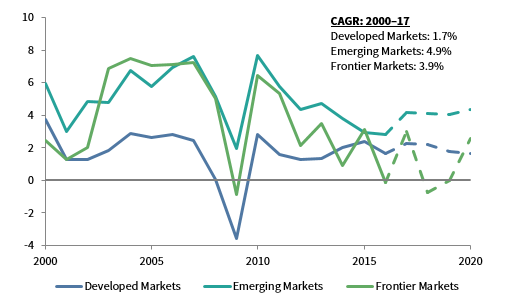
ACTUAL AND ESTIMATED REAL GDP BY WORLD REGIONS
2000–20 • US Dollars • Year-Over-Year Growth (%)
Sources: International Monetary Fund – World Economic Outlook Database and MSCI Inc. MSCI data provided “as is” without any express or implied warranties.
Notes: Regions are defined by MSCI market classifications as of April 30, 2019. GDP data for most countries are estimates after 2017.
Frontier markets are expected to benefit from faster relative productivity growth than that observed in developed markets and to keep pace with EM productivity growth. This is in part because frontier markets have a relatively low base of capital and technology, and, as capital flows increase, new technologies spread, and efficiency gains permeate, frontier markets are expected to realize rapid productivity growth as they “catch up” to their DM and EM counterparts. Ultimately, productivity growth is fundamental to improvements in living standards, consumption, and economic growth.
Favorable Demographics. In general, FM demographics are likely to favor future economic growth, but, much like other characteristics, the demographics within FM countries can vary widely from country to country. For example, increasing life expectancy is often associated with favorable demographic trends, and in aggregate frontier markets have observed terrific gains over the last few decades. But the average life expectancies for countries within frontier markets still span a very wide range: Nigeria falls at the lowest of the range at 55 years, while the populations in Slovenia and Lebanon on average are both expected to live to 81 years. Many social, economic, and country-specific factors can contribute to this wide range of average life expectancies. However, as these FM countries have advanced over the last few decades, they have universally observed increases in average life expectancy.
As with life expectancies, FM population growth rates vary widely, too, from countries with rates of growth nearly double the world population growth rate (Kenya, Kuwait, and Nigeria) to countries whose populations are shrinking (Bulgaria, Croatia, and Lithuania). The average annual population growth rate for the largest five frontier markets over the period 2000 to 2017 was 2.0%, compared to 1.0% for the largest five emerging markets and 0.6% for the largest five developed markets. Higher rates of population growth, if paired with solid productivity (per capita GDP) growth, would translate to attractive economic growth.
Demographics and growth dynamics for FM countries on average are appealing; however, investors should recognize that (1) the averages camouflage diverse circumstances for individual countries, and (2) the levels of economic growth across markets often have low correlations to earnings growth or investment returns for equity indexes in those markets.
Adding Frontier Markets to Emerging Markets Allocations
Risk/Return Impact
Given the diversification benefits associated with combining frontier markets with other equity exposures, it is reasonable to expect improved risk-adjusted returns via the addition of frontier markets to an equity portfolio. However, because of the less developed nature of these markets, combined with lower liquidity and higher transactions costs, we believe it prudent to consider frontier markets as an extension not of global equity exposure (e.g., MSCI All Country World Index), but of EM exposure instead. In fact, many active EM managers are already dabbling in some of the more liquid FM names.
The risk/return impact of including frontier markets with emerging markets is shown in Figure 8. Adding frontier markets to emerging markets had a meaningful impact on reducing the risk of the combination portfolio, based on index exposures with 5% incremental increases in the FM allocation. While adding frontier markets to the portfolio presented a slight reduction to returns over the full period, there was a meaningful risk reduction. For an investor holding an 80% EM/20% FM portfolio[4]Portfolio rebalanced monthly for illustrative purposes. instead of a 100% EM portfolio, the standard deviation of portfolio returns declined by 191 bps on an annual basis, while returns decreased by just 5 bps annually. FM returns have lagged EM over the full period, but there have been instances of outperformance over three-to five-year periods. For example, in the five-year period from 2013 to 2017, the 80% EM/20% FM portfolio outperformed the EM portfolio by 109 bps annually, while also reducing volatility by 146 bps annually. While the inclusion of frontier markets will not always boost returns, it is likely to lower portfolio volatility in most periods and should improve risk-adjusted returns.

FIGURE 8 RISK/RETURN: EMERGING MARKETS VS FRONTIER MARKETS
June 30, 2002 – June 30, 2019 • US Dollar • Percent (%)
Source: MSCI Inc. MSCI data provided “as is” without any express or implied warranties.
Note: Total return data for all MSCI indexes are net of dividend taxes.
Practical Limitations
The decision on how much FM exposure to add to emerging markets has realistic limits associated with it. Most notable would be the large liquidity differences between the two markets. However, for a USD-based investor, the diversity benefit gained by including as little as a 20% allocation to frontier markets may be just as good if not greater than that gained by adding a 50% allocation of developed ex US markets to a US equity portfolio (Figure 9).
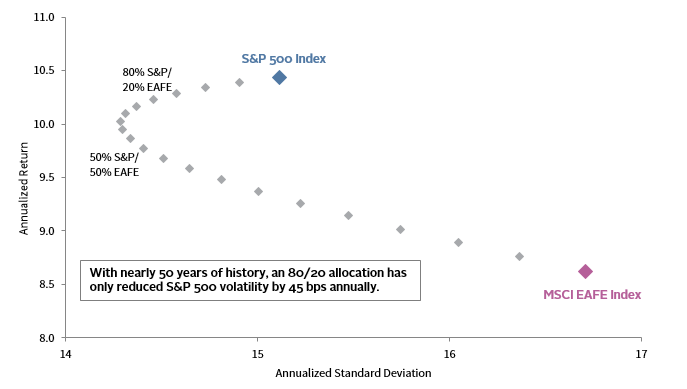
FIGURE 9 RISK/RETURN: US VS NON-US
June 30, 2002 – June 30, 2019 • US Dollar • Percent (%)
Sources: MSCI Inc. and Standard & Poor’s. MSCI data provided “as is” without any express or implied warranties.
Note: Total return data for all MSCI indexes are net of dividend taxes.
FM Valuations
We prefer to assess equity market valuations using normalized price multiples that smooth the volatility in the earnings cycle and have shown a better (though of course not perfect) relationship with future long-term returns than trailing price-earnings (P/E) ratios. Given the limited index history and the frequent turnover of countries in the FM index, assessing normalized FM equity valuations on an index level requires a bit of creativity. We analyze the return on equity (ROE)–adjusted P/E for the aggregate FM index, but also review a time series of median valuations using a fixed basket of the ten largest countries by current market capitalization in the MSCI FM Index. The ten largest countries in the index comprise 90% of the total index market cap, which adequately represents the opportunity set and also avoids skew from the long tail of countries with paltry weights in the index. In addition, the basket approach circumvents misleading historical comparisons against a vastly different opportunity set. For example, the promotions of Qatar and UAE in 2014 and Argentina in 2019 drastically changed the composition of the index, as they were among the largest constituents at the time of promotion. The planned 2020 promotion of Kuwait, which represented 31% of the MSCI FM Index at June 30, will further change the opportunity set.
On the aggregate index basis, frontier markets trade at 13.8 times normalized earnings, which falls in the 82nd percentile versus its post-2008 history and 15% above the historical median valuation multiple. However, frontier markets look more reasonably valued using the fixed basket approach, trading at 11.7 times ROE-adjusted earnings, which is 1% below their historical median multiple.
Risk Factors
Investors should understand and become comfortable with the risks of frontier markets before making investments. Some FM countries generate eye-catching headlines about violent conflicts, political unrest, economic woes, and the like, which understandably give some investors pause. At the root of these troubling events often is the fact that FM countries may lack the same level of political stability, financial infrastructure, and legal and regulatory framework normally associated with more developed countries. In addition to these general country risks, frontier markets may seem impermeable as investors struggle with language and cultural barriers, challenging physical access for due diligence, and issues related to that lack of information and transparency.
While investors are right to be cautious, frontier markets today, like emerging markets 25 years ago, may be unduly discounted by investors due to improper assumptions and misconceptions. A broadly diversified approach to FM investing can help mitigate different kinds of risks. Below, we review some of the key risks investors should consider when evaluating frontier markets. Investors that are considering whether to add FM exposure to their EM exposure should ask themselves whether frontier markets are substantially riskier than the EM exposure they already have.
Political and Sovereign Risks are Substantial
Frontier markets can suffer from civil and political unrest, which may lead to country-specific market disruptions. While often detrimental to local stock markets, they typically remain fairly isolated to their country of origin. For example, in 2013, when Ukraine was part of the FM universe, a surprise eruption of national protests caused the local stock market to fall 3.5% between November 21 and December 17. This fall had almost no effect on equity returns for other FM countries within or neighboring the region—quite the contrary, in fact. During that same period, the broader MSCI FM Index was up 1.4%, and the Ukraine’s closest frontier neighbor, Romania, rose by 1.3%. FM countries often have little in common with each other beyond their early stage of economic development, leading to their low correlations with each other. Further, many investors have already accepted the political risks in EM equities, and those in FM countries, while perceived to be higher, are generally similar in nature.
Volatility Is Less Pronounced than Emerging Markets
On an individual basis, FM countries can be very volatile, but low correlations and high levels of economic diversification help disperse a good portion of country-specific risks at the aggregate level, especially when considering a global basket of FM equities versus a more regional approach to portfolio composition. Additionally, unlike global EM equities, which have suffered from large capital outflows during risk-off periods, to date global FM equities have not been as susceptible to hot money-driven volatility given the relatively low institutional investor penetration across FM securities.
Perceived Corruption Is Similar in Frontier and Emerging Markets
High levels of corruption can tax growth, introduce inefficiency, and undermine the basic rights and laws that hold a functioning society together. Transparency International, a nonprofit organization that focuses on combating global corruption, uses a corruption index to rate the level of perceived corruption present within the public sector in a given country. Scores range from 0 to 100, with a score of 0 indicating a high perception of corruption and a score of 100 suggesting a country is relatively uncorrupted. According to this data, the average FM country has a corruption ranking of 42.2, versus 45.0 and 76.1 for emerging and developed markets, respectively. Thus, the perceived corruption in FM countries is only marginally higher than that of the average EM country. Measuring perceived corruption is of course not the same as measuring corruption directly, and a country’s perception score may have little relationship to the governance quality for listed companies within the country.
Liquidity Is Poor, Which Is Costly to Investors
FM equities are very thinly traded compared to stocks in developed and emerging markets, and are not suited to serve as a daily liquidity source for investors. Bid-ask spreads and market impact (and even brokerage commissions) are substantial, and the low liquidity boosts the cost of handling portfolio asset flows and of repositioning portfolio exposures, both for active and index managers. This lack of liquidity compared to emerging and developed markets is the primary reason investors should be highly critical of any dedicated FM vehicle offering daily entry or exit. Quarterly or at worst monthly liquidity are much more realistic and safer options for investors to target.
Limited liquidity can impede investors from establishing and exiting sizable positions in frontier markets. As of June 30, 2019, the total market capitalization of the MSCI FM Index was $327 billion, but when adjusted for available free-float, the total capitalization drops to $102 billion. To help put this market cap into perspective, the size of the index’s total adjusted free-float was equivalent to that of US company Starbucks (SBUX) on the same date. And, while it has been growing, the average daily volume of the MSCI FM Index is only $154 million per day, as compared to $49 billion for emerging markets (Figure 10). Further, the available liquidity in frontier markets is concentrated in a handful of stocks, while nearly two-thirds of the FM index’s component stocks trade less than $1 million per day.
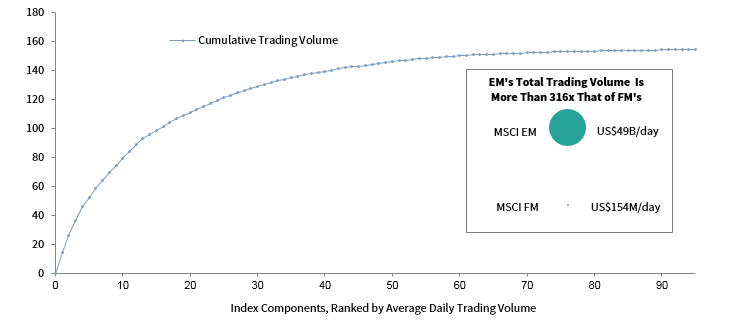
FIGURE 10 AVERAGE DAILY USD TRADING VOLUME OF THE MSCI FRONTIER MARKETS INDEX
As of May 31, 2019 • US Dollar (Millions)
Sources: FactSet Research Systems and MSCI Inc. MSCI data provided “as is” without any express or implied warranties.
Note: USD volume is calculated by using 90-day average daily trading volume of the companies.
Most investment managers that specialize in FM equities try to manage their portfolios so that all individual holdings can be exited within 30 days. Market illiquidity may make it difficult for investors to rebalance or liquidate positions without experiencing significant haircuts, especially during times of extreme downward market pressure. Limited liquidity can cause other potential issues, such as capacity constraints, transactions costs, or portfolio managers motivated to hold certain “anchor tenant” stocks by their available liquidity rather than by their expected return. Institutional investors with significant capital to invest may encounter capital constraints as investment managers struggle to put all of the funds to work.
Operational Frictions Will Weigh on Returns
FM countries routinely lack the same level of market sophistication as developed and EM countries, which can lead to various trading and settlement challenges. Such operational challenges and inefficiencies can contribute to a higher probability for trading errors, less automated settlement processes that are more prone to error, costly currency conversions, complex custodian relationships, ownership restrictions, or additional reporting requirements for foreign investors. In addition to limited liquidity, market inefficiencies can contribute to higher transaction costs, wider bid-ask spreads, and additional trading commissions, processing fees, and custodial costs.
Availability of Data Is Poor, Even Compared to Emerging Markets
Another area of concern is data availability and whether the data are accurate and trustworthy. While the wide adoption of international accounting standards aids the collection and normalization of basic financial data, important details may still remain unavailable. For example, investors analyzing a publicly traded FM company typically do not have access to such nuanced accounting data as short interest and insider trading metrics. An inconsistent application of accounting standards from country to country can make cross-country comparisons harder and may make it difficult for portfolio managers to hold management teams’ feet to the fire.
Implementation Considerations
Investors gain FM exposure through passive or active vehicles or with investment managers that specialize in both EM and FM equities. In the frontier market equity space, the amount invested in active vehicles substantially outweighs that of passive vehicles—to a greater extent than in emerging markets, where passive vehicles have grown in popularity.
Passive Options
Index funds and ETFs may not fully replicate the underlying index, but investors will maintain exposure to a large majority of the underlying companies within the index. Compared to active FM vehicles, fees are low, but, similar to transaction costs, are often much higher than for DM or EM index products. Some of the index products that we follow have badly trailed their benchmarks, due to the combination of massive index turnover and poor liquidity. Be prepared for an index fund to trail the benchmark by 1.5% or more, net of fees. Given the relatively meager performance differentials associated with indexing in developed non-US markets (10 bps–20 bps) and emerging markets (30 bps–40 bps), starting each year in the hole by 1% or greater could be a hard sell, as the low amount of money invested in passive funds suggests.
Active Options
Active managers have the option to avoid the most troublesome areas of the FM investment landscape. Whether market inefficiencies and informational advantages justify the higher fees charged by active funds is, as always, a matter of some controversy. We believe that the deficiencies of frontier indexes tilt the playing field toward competent and reasonably priced active managers, but capacity management and adequacy of liquidity terms become even more important than usual in this space.
Hybrid EM and FM Options
Hybrid EM/FM options can take a passive or active approach. For active options, hybrid EM/FM managers will usually avoid the larger EM country exposures (China, South Korea, Taiwan, India, etc.), concentrating the fund’s EM exposure in the smaller EM countries with good liquidity and then adding FM exposure to increase overall diversification. Hybrid EM/FM options typically maintain a meaningful allocation to EM equities, perhaps 50% of the fund’s total country exposure. Underlying EM holdings will often differ significantly from those held by more traditional EM active managers. Hybrid strategies may be able to minimize the very costly disruptions posed by countries being promoted and demoted back and forth between the FM and EM indexes, in much the same way that a Russell 3000® Index fund avoids many of the transaction costs that would be associated with combined Russell 1000® and Russell 2000® funds.
Benchmarking
When establishing a benchmark, investors should bear in mind the motivating factor for their allocation to frontier markets. If investors accept that the diversification benefits to EM exposure gained from adding frontier markets outweigh the higher trading costs/tracking error associated with trading these markets, then exposure to frontier markets is a purposeful “bet” within EM exposure, and should be benchmarked as such, with the understanding that there may be times when the two regions perform very differently. Said another way, benchmarking FM exposure to an EM benchmark is an acceptable, and even preferable way to judge this particular bet. For investors that allocated to frontier markets for different reasons, benchmarking to a frontier index (such as the MSCI Frontier Markets or S&P Frontier Markets Extended 150) is the obvious choice.
Regional Versus Global Funds
Diversification and liquidity considerations suggest that investors are better served by global FM funds versus regional or country-specific FM funds. Regional and country-specific FM funds may offer investors decent liquidity, since some of these regions may include the largest slices of the FM index, such as Vietnam, Morocco, or Nigeria. However, funds with fewer country and company exposures can be more susceptible to unforeseen illiquidity shocks resulting from country- or regional-specific economic and political events. Regional funds can increase various country-specific risks that would normally be diversified away when looking at the entire FM basket. With a global FM fund, investors could expect a higher level of diversification and lower correlations between FM countries. In addition, the cyclicality of certain performance drivers may mean various FM regions move in and out of favor over time. For example, the cyclicality of the price of oil may cause investors to rotate out of the Gulf Cooperation Council countries during a global recession when the price of oil is falling, only to pile back in as the price of oil slowly recovers during a global expansion.
Currency Hedging
Currency hedging in frontier markets is difficult and generally cost prohibitive; in some markets, it is outright impossible. As a result, FM investors typically must assume currency risk when making investments. Investors with global portfolios are often willing to accept currency risks, and, as previously noted, a number of FM currencies are pegged to DM currencies, which can help dampen currency volatility. However, as investors that owned Nigerian stocks in 2016 learned, pegs don’t always hold, and devaluations can be painful. That year, Nigerian stocks posted local currency returns of roughly 2%, but this translated to a -36% return for USD-based investors. In addition, Nigeria had begun that year as the second-most heavily weighted country in the MSCI FM Index at roughly 14%, which caused a significant drag on returns at the index level. EM countries by comparison have experienced far worse currency translation losses for USD-based investors (Russia, Brazil, Mexico, etc.); however, these losses have never impacted one of the heaviest-weighted countries in that index.
Transaction Costs
Transaction costs when trading FM equities typically come from both commissions and currency trading. Bid-ask spread costs for currencies are highest in frontier markets. By definition, frontier markets are less technically advanced than developed and emerging markets. Thus, trading securities can be challenging as investors cope with market inefficiencies, extra fees and taxes, and a lack of transparency, all of which can contribute to low liquidity and wide bid-ask spreads on thinly traded securities or exotic currencies. In a given year, transaction costs on a typical FM index fund or ETF could lower gross returns (before manager fees) by 80 bps–130 bps.
Investment Vehicles
Commingled funds are often the best structure for fund investments in frontier markets because they are not required to offer daily liquidity. Instead, these funds usually offer liquidity on a monthly or quarterly basis with a notice period of between 15–30 days. Terms vary by provider, but monthly liquidity combined with the aforementioned notice period is usually considered the most appropriate. Commingled funds also usually have lower fees, can keep costs lower, and can position portfolios closer to the investment managers’ preferences since the fund does not have to guarantee daily liquidity. Since frontier markets are highly susceptible to illiquidity shocks, daily liquidity terms (such as in a mutual fund) can cause an investment manager to overweight the most liquid holdings within the investment universe, to have hefty allocations to highly liquid out-of-index “anchor tenants,” and to carry excessive cash positions. Among passive and active FM investment options, many are available in institutional monthly liquidity commingled funds.
Fees
The average annual fee can range from 50 bps to 75 bps for passive products and from 100 bps to 200 bps for active products that we believe are of institutional quality. In some cases, the fees charged by active FM funds are close to or only marginally more expensive than those charged by active EM funds.
Conclusion
Decades ago, investors typically only wanted to invest in the developed markets of the United States, Western Europe, and Japan. The rest of the world was largely considered too risky, too illiquid, too small, or too underdeveloped to be worthy of investor dollars. It’s impossible to say whether today’s frontier markets will act exactly like yesterday’s emerging markets, but we’re doubtful. As designated by the various index providers, the developed markets will always have more investor capacity than emerging markets, and emerging markets will always have more investor capacity than frontier markets. Based on how the index providers define these markets, there is simply no other alternative.
However, we still feel that investors should consider incorporating frontier markets alongside emerging markets. The individual country returns in frontier markets will likely have similar extremes to EM countries, but these returns are expected to remain largely uncorrelated. This correlation characteristic should enable an FM addition to provide a meaningful benefit to an existing EM allocation.
Investment Vehicle. Fees of index products aren’t far below those of active products, and passive managers often have meaningful performance shortfall (150 bps annually is not unusual) due to high transaction costs paired with high index turnover. Because of this, investors should strongly consider active management. We prefer institutional commingled vehicles with monthly or quarterly liquidity terms.
Liquidity Expectations. An investor in this space would be best served to treat frontier markets with the same magnifying glass as any other alternative investment. That is to say, it should not be viewed as a source of liquidity; you should assume it will be your most expensive publically traded global equity investment; and it could deliver unexpected results. Investors willing to accept these risks are choosing the widest opportunity set available.
Sizing the FM Exposure. Given the sheer volume of dollars currently invested in emerging markets, it would be next to impossible for everyone to run a 50/50 allocation (similar to US and non-US developed markets) between emerging and frontier markets. However, we believe that it is feasible to allocate between 10%–20% of an existing EM basket into frontier markets without adversely impacting the portfolio’s return expectations.
Sean Duffin, Investment Director
Index Disclosures
MSCI Emerging Markets Index
The MSCI Emerging Markets Index represents a free float–adjusted market capitalization index that is designed to measure equity market performance of emerging markets. Emerging markets countries include: Argentina, Brazil, Chile, China, Colombia, Czech Republic, Egypt, Greece, Hungary, India, Indonesia, Korea, Malaysia, Mexico, Pakistan, Peru, the Philippines, Poland, Qatar, Russia, Saudi Arabia,South Africa, Taiwan, Thailand, Turkey, and the United Arab Emirates.
MSCI Frontier Markets Index
The MSCI Frontier Markets Index captures large- and mid-cap representation across 28 frontier markets countries. Frontier markets countries include: Bahrain, Bangladesh, Burkina Faso, Benin, Croatia, Estonia, Guinea-Bissau, Ivory Coast, Jordan, Kenya, Kuwait, Lebanon, Lithuania, Kazakhstan, Mauritius, Mali, Morocco, Niger, Nigeria, Oman, Romania, Serbia, Senegal, Slovenia, Sri Lanka, Togo, Tunisia, and Vietnam.
MSCI World Index
The MSCI World Index represents a free float–adjusted, market capitalization–weighted index that is designed to measure the equity market performance of developed markets. Countries included are 23 developed markets country indexes: Australia, Austria, Belgium, Canada, Denmark, Finland, France, Germany, Hong Kong, Ireland, Israel, Italy, Japan, the Netherlands, New Zealand, Norway, Portugal, Singapore, Spain, Sweden, Switzerland, the United Kingdom, and the United States.
Footnotes