US Equities Drove Investment Performance in 2024
Calendar year 2024 was highlighted by robust gains in mega-cap growth stocks in the United States. Strong performance from these stocks propelled the broad market Russell 3000® Index to an annual return of nearly 24%. International equities lagged US markets, with the MSCI EAFE and MSCI Emerging Market indexes both posting returns in the single digits in US dollar terms. Yet, because the US region represents approximately two-thirds of the MSCI All Country World Index (ACWI), this global equity index produced a healthy return of 18% over the past year (Figure 1).
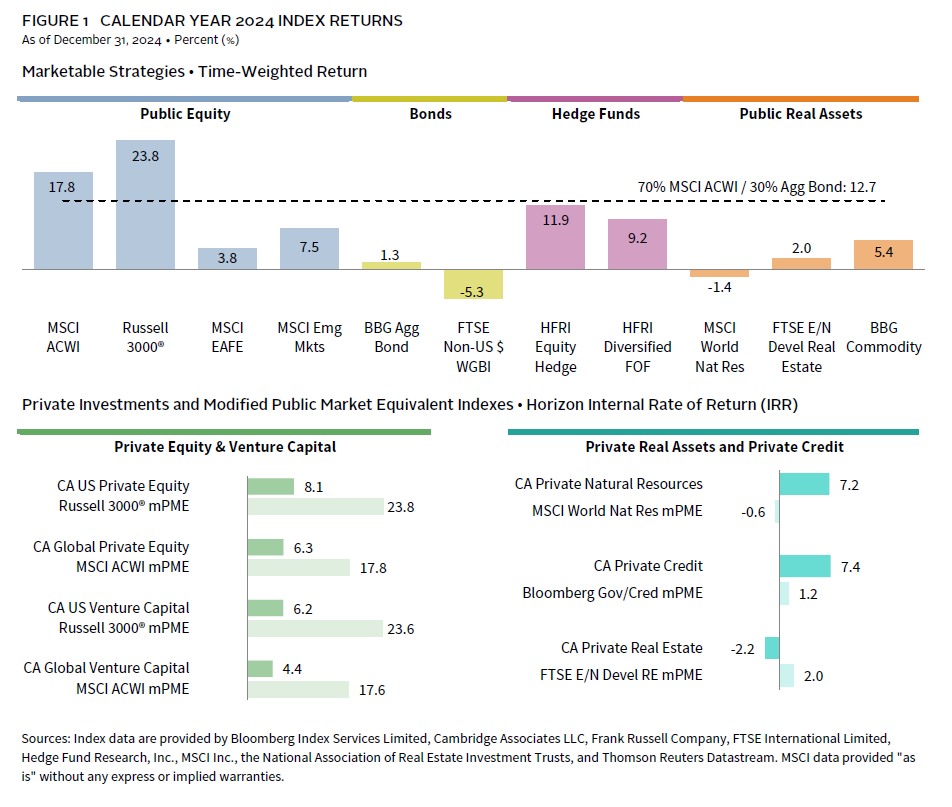
Meanwhile, fixed income markets lagged their 2023 performance. The Bloomberg Aggregate Bond Index returned just 1%, while an unhedged index of sovereign bonds outside of the United States return -5%. Despite the muted performance from bonds, a simple blended index weighted 70% MSCI ACWI and 30% Bloomberg Aggregate Bond still returned almost 13% in 2024.
Performance for most alternative asset classes did not stack up as well with the returns of the simple benchmark in 2024. Hedge funds came close as the Hedge Fund Research® (HFR) Equity Hedge Index, which represents long/short equity hedge funds, returned 12% for the year. Another HFRI index that represents a more diversified basket of hedge funds strategies posted a 9% return. CA Private Equity indexes and the CA Venture Capital indexes significantly underperformed modified public market equivalent (mPME) benchmarks, especially in the US region. On the flip side, the CA Private Credit Index produced a 7% internal rate of return (IRR), which was much higher than what the public bond market offered.
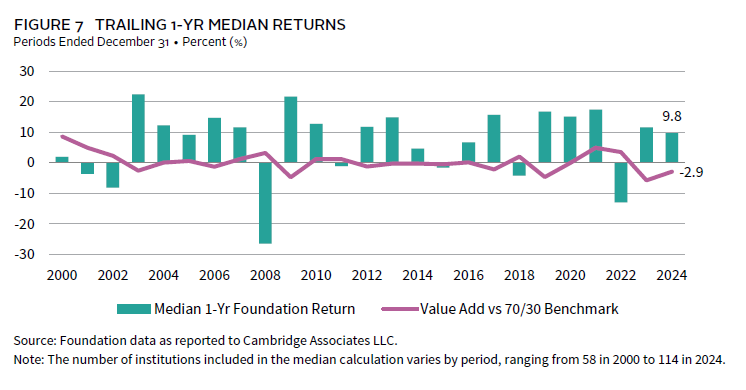
It was a capital market environment where diversified portfolios struggled to match the performance of the simple 70/30 index (Figure 2). Most foundations in the CA peer universe maintain high allocations to alternative assets, with private investments alone accounting for more than one-quarter of the portfolio, on average. This was the main reason that the median foundation return (9.8%) underperformed the simple benchmark by almost 300 basis points (bps) in 2024. Just 18% of participating foundations outperformed the mark for the calendar year.
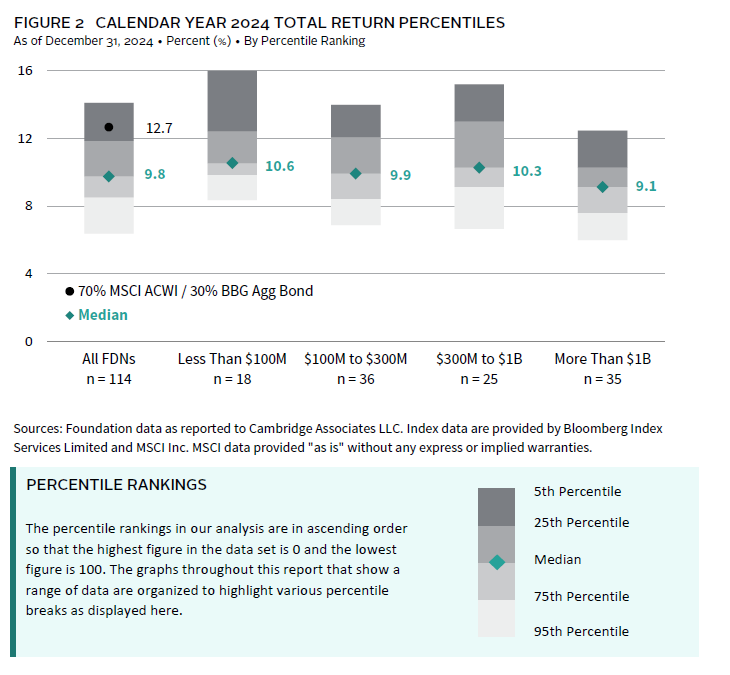
Excluding the top and bottom 5th percentile of performers, foundation returns ranged from a high of 14.1% to a low of 6.4%. This was actually the smallest range of returns reported for the peer universe since 2017. Several notable factors help explain the overall dispersion in performance. When looking at different asset size cohorts, smaller foundations tended to outperform other peers. Foundations with less than $100 million in assets reported the highest median return at 10.6%. Asset allocation structures played a key role in this dynamic, as smaller foundations continued to report public equity allocations in 2024 that were higher than other peers.
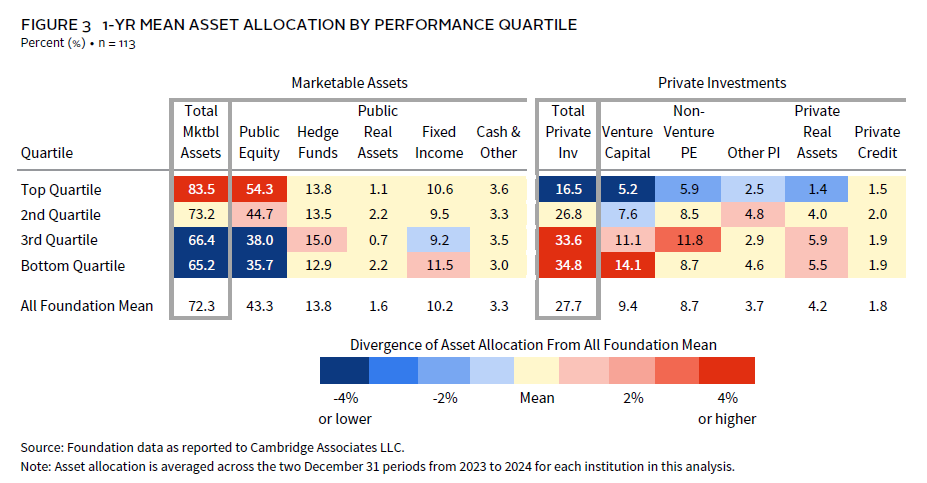
In Figure 3, our heat map analysis highlights the relationship between asset allocation and the dispersion in peer returns. On average, top quartile performers had more than half of their portfolios allocated to public equities and more than 80% of their portfolios invested in marketable strategies. In addition, their average allocation to private investments (16%) was less than half of the average exposure reported by the bottom quartile of performers (35%). The largest differential in peer allocations among the various private investment substrategies was in venture capital.
Our attribution model confirms that differences in asset allocation structures contributed to the return dispersion of peers in 2024 (Figure 4). This analysis estimates that the top quartile performers earned an average return of 12.4% from their asset allocation for the one-year period. This was more than 300 bps higher compared to the average asset allocation return for the bottom performance quartile.
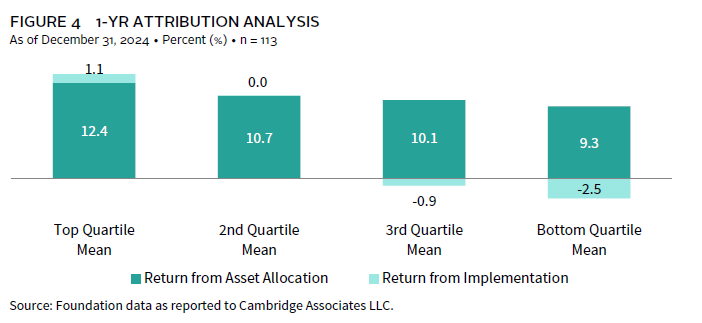
Equally important though was the impact of the implementation of the portfolio. Much of what we consider to be implementation in our model derives from alpha. It also can include the effects of having a portfolio tilt toward a particular style or sector. Our analysis estimates that the top quartile added an average of 110 bps in value to their return through implementation, whereas this detracted from performance for most of the bottom quartile. In fact, the differential in the average implementation return between the top and bottom quartiles was slightly larger than the differentials in asset allocation returns.
Peer-reported data on asset class returns support the notion that top performers stood out from the rest of the universe with regard to implementation in 2024 (Figure 5). The median asset class return for top performers (based on total return) surpassed the overall foundation median in most strategies, including the areas where foundations have high allocations. At the total public equity composite level, the median return for top quartile foundations was 140 bps higher than the full universe median. This is notable, given that more than half of the average portfolio for the top quartile was invested in public equities. Not only did top performers have the highest allocations to the best-performing asset class in 2024, but they also earned returns within those strategies that were higher compared to other peers.
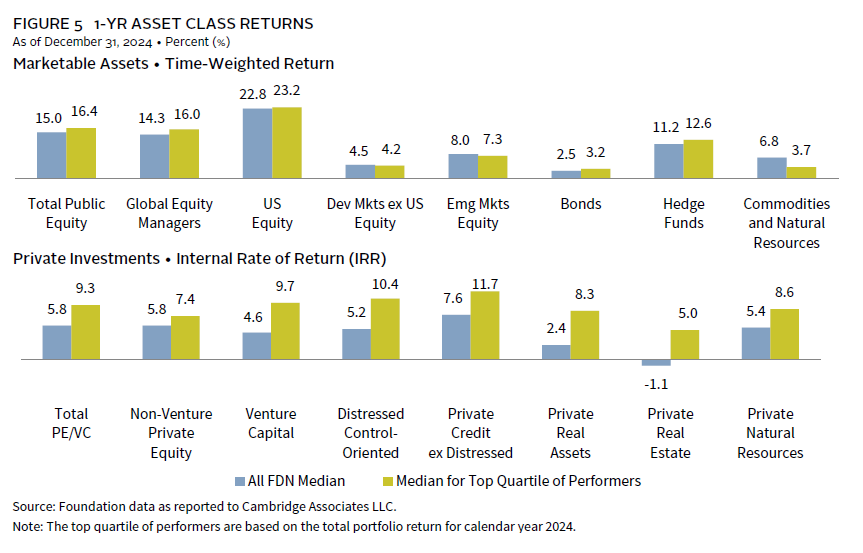
This outperformance was not just contained to public equity—it was prevalent in alternative asset classes as well. In hedge funds, the median return for top quartile foundations was 12.6% compared to 11.2% for the overall universe. The spread in returns was even higher across private investment strategies. For the total PE/VC composite, top performers posted a median return that was 350 bps higher than the overall median. In venture capital alone, the spread was more than 500 bps. Although private allocations generally make up a smaller chunk of the portfolio for this year’s top performers, these foundations clearly found private strategies to be value additive to their overall portfolio return in 2024.
Private Equity Underperformance Has Spanned Consecutive Years
The underperformance of private equity versus the public stock market has been a major theme in the performance narrative of the last couple of years. The fact that private markets have underperformed is not that uncommon. When considering the last 25 calendar years, the CA PE/VC index underperformed the mPME version of the MSCI ACWI in nine instances (Figure 6). In addition, these last two years were not the only multi-year period of underperformance for private markets, with 2012–13 being the most recent example.
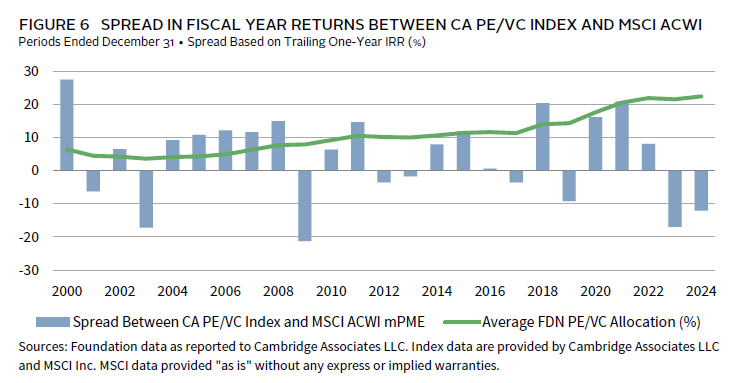
However, the magnitude of the private market underperformance is different this time. The private index trailed the public index by more than 1,200 bps in 2024 and 1,700 bps in 2023. It was the only two-year stretch that resembled this across the historical period in Figure 6. Further, it is notable that this occurred at a time where private investment allocations among foundations have been at or near their all-time highs. The result is the large negative spread between the median foundation return and the simple 70/30 benchmark, although 2024 was an improvement over the 2023 comparison (Figure 7). This was a stark contrast to the years of 2021 and 2022, where foundations’ outperformance of the simple benchmark was among the largest margins that have ever been recorded.
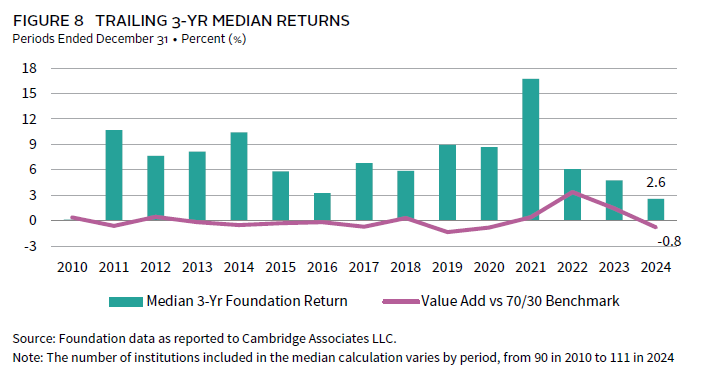
The trailing three-year performance record for foundations has slumped both in absolute and relative terms. With the negative performance of 2022 still in the most recent rolling period, the median three-year median return (2.6%) was the lowest reported since 2010 (Figure 8). This statistic will likely get a significant boost next year as 2022 falls out of the rolling calculation. However, the outlook is not as bright when looking at the value add of a typical foundation’s performance versus the 70/30 index. The median return underperformed the simple benchmark by 80 bps for the most recent three-year period. Looking forward to next year, the three-year period will again contain at least two years of private investment underperformance (2023 and 2024), making it likely that the median will fall short of the simple benchmark again.
Private Investments Continue to Drive Long-Term Performance
While we have chronicled how private investment returns lagged the public equity markets the last two years, the opposite has been true over a longer period of history (Figure 9). Public US equities did have stellar investment returns for the trailing ten-year period, with the Russell 3000® Index mPME earning an annualized IRR just shy of 13%. However, both the Cambridge Associates LLC US Private Equity Index® and the Cambridge Associates LLC US Venture Capital Index® performed even better. Returns were much lower for public equities outside of the United States in US dollar terms. When those non-US regions are factored in, the performance gaps between the MSCI ACWI and the CA global versions of the private indexes were even wider than the US benchmark comparisons.
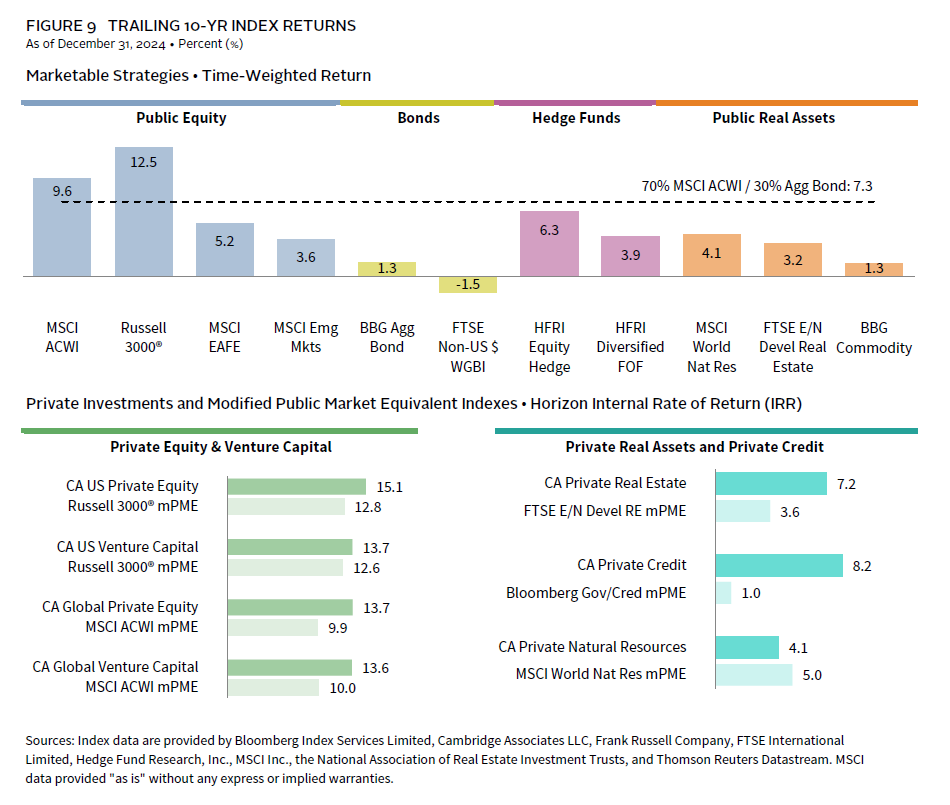
Meanwhile, the past decade has been a dismal return environment for bonds. The US investment-grade bond market, represented by the Bloomberg Aggregate Bond Index, returned just 1% per annum over the past decade. Absolute return hedge fund strategies offered slightly more enhanced returns, while the CA Private Credit Index stood out with an 8% annualized IRR.
Elsewhere, the inflation spike from a couple of years ago provided a short-term boon to inflation-hedging strategies. However, most of the past decade was not a conducive environment for strong returns from natural resources–related investments and commodities. In real estate, the CA Private Real Estate Index produced an annualized IRR of 7% for the decade, but public markets were more muted.
The median foundation return over the trailing ten-year period was 7.2%, which was just a tick below the return of the 70/30 blended index (Figure 10). Splitting the universe into various asset size cohorts shows that larger foundations tended to fare better versus the simple benchmark than smaller peers. The median return for foundations greater than $1 billion was 7.8%, with more than three-quarters of this cohort beating the simple benchmark. On the other hand, the median return for those less than $100 million was just 6.6%.
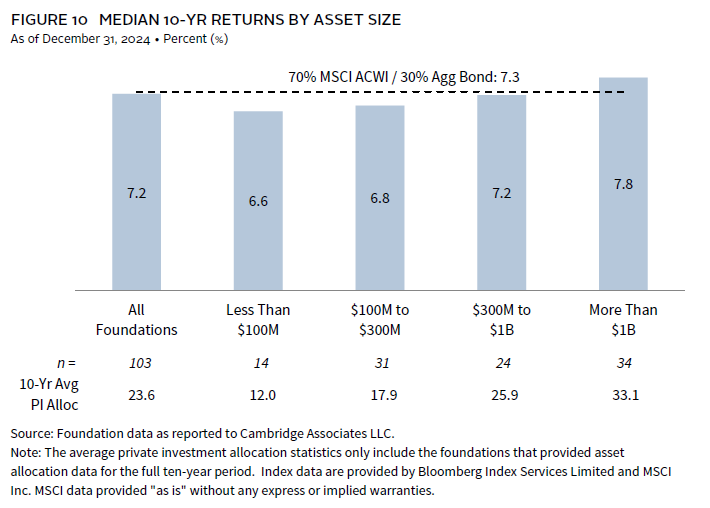
Asset allocation again was a key factor in explaining the return differentials across the asset size cohorts. Foundations with the best returns over the past decade had the highest allocations to the best-performing strategies across this period, namely private investments. When considering the average private investments allocation across the full ten-year period, these assets accounted for 33% of the average portfolio for the foundations greater than $1 billion. Private allocations were smaller when stepping down the asset size scale; the average for foundations less than $100 million was just 12%.
The relationship between private investment allocations and longer-term foundation performance has persisted for many years. Using December 31, 2000, as a starting point, there are 15 rolling ten-year periods that we can analyze using our historical survey data (Figure 11). In every one of those rolling periods, the average private investment allocation for top-performing foundations exceeded the average for the other foundations in the peer universe.
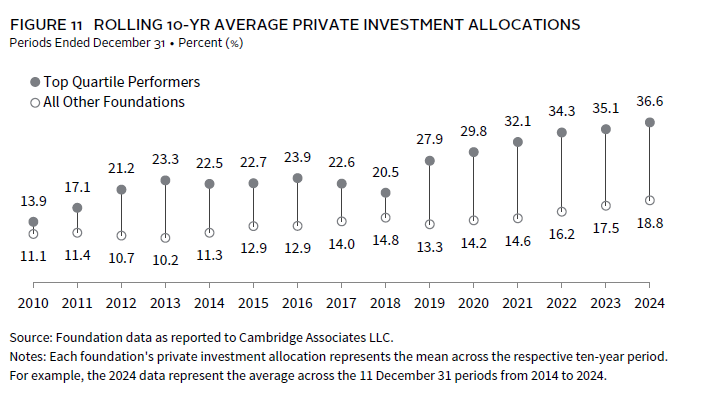
This historical period captures multiple market cycles and includes several individual years where private markets did not match up with public markets in terms of performance. But in more years than not, the PE/VC indexes posted returns that were higher than what could have been earned by investing in the public equity markets instead. The top performers in our foundation universe have been successful in tapping into the enhanced return potential of investing in private markets. And even with the last two years—where public equity performance has far exceeded private investment returns—it has not been enough to offset the comparative performance advantage that private markets offered in earlier years. It would take a few more years of public markets continuing to top private markets in the return comparisons to reverse the trend in Figure 11.