At most foundations, the majority of the long-term portfolio is invested in public equity and PE/VC. On average for the overall peer universe, about 66% of the long-term investment portfolio (LTIP) was allocated across these categories at the end of 2024. The combined average allocation does not vary much across different asset sizes, ranging from a low of 63% for foundations more than $1 billion to a high of 68% for a couple of the smaller asset size cohorts. However, the breakdown of allocations between public and private equities does look quite different when going up or down the portfolio size spectrum.
Generally, smaller foundations continue to have the highest public equity allocations, while larger foundations have higher private allocations (Figure 19). For foundations less than $100 million, public equities made up 56% of portfolios on average, while PE/VC accounted for just 13%. In contrast, the average breakdown was split more evenly across the foundations greater than $1 billion. The largest foundations allocated an average of 35% to public equity and 28% to PE/VC.
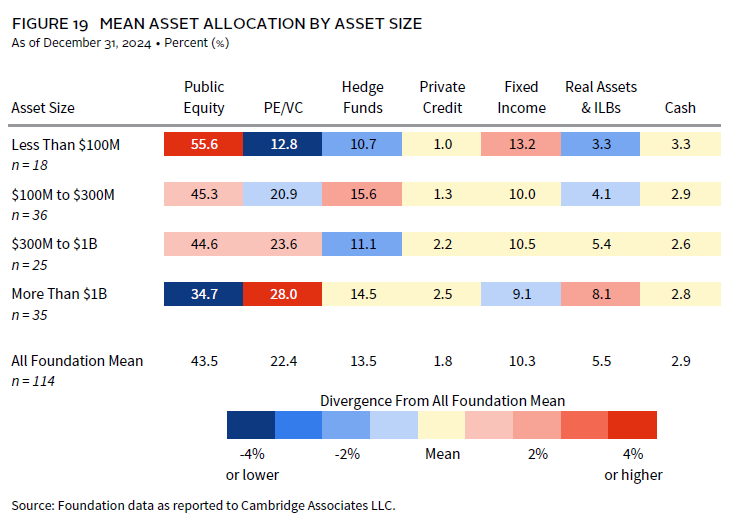
There were also distinct differences elsewhere when comparing asset allocation structures across the asset size groups. Smaller foundations tended to have the highest exposure to bonds, with an average allocation of 13% for foundations less than $100 million. Conversely, the largest foundations allocated more to real assets and inflation-hedging strategies, with an average of 8% invested, compared to 3% for the smallest foundations. The bulk of real assets allocations for larger foundations came from private investment strategies. Hence, the differential in illiquid allocations between large and small foundations is even wider than what is shown in the PE/VC category alone.
Asset Allocation Trends
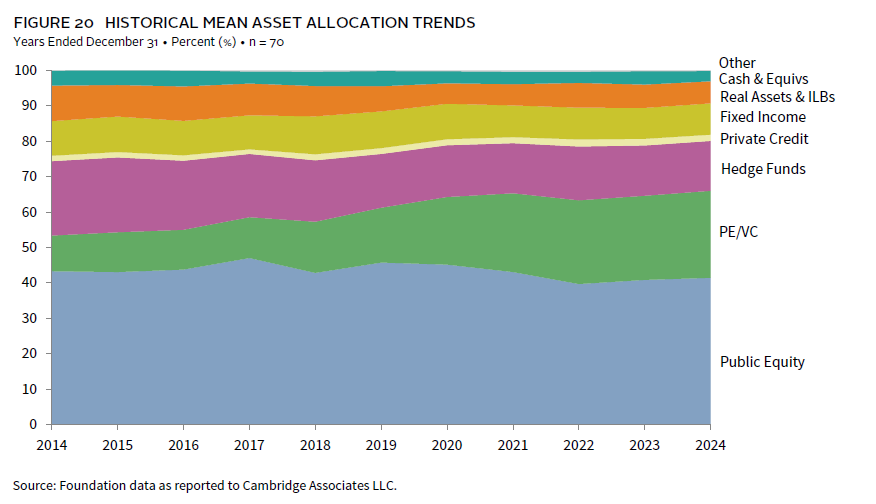
Over the last ten years, the most notable trend in asset allocations has been the increase in private equity allocations. Figure 20 tracks the trend in average portfolio allocations for a group of 70 foundations that provided data over the past decade. The average PE/VC allocation for this constant group has more than doubled, rising from 10% in 2014 to 25% in 2024. Most of the other categories in our summary framework saw decreases in allocations over the same period. The largest decline was in hedge funds, which fell from 21% of the average portfolio in 2014 to 14% in 2024.
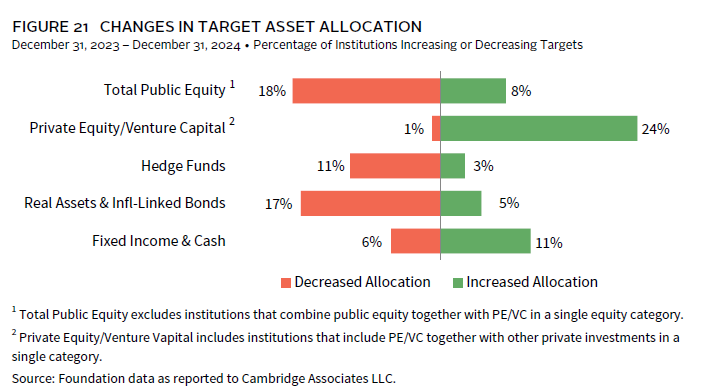
These long-term trends correspond for the most part with recent changes we have seen foundations making to their target asset allocation framework. There continues to be a significant chunk of the peer group increasing their policy allocations to PE/VC, with 24% of respondents doing so in 2024 (Figure 21). Just one respondent decreased their policy allocation to this category in 2024. Meanwhile, in public equity, hedge funds, and real assets, more foundations reported a decrease to their target allocations than those that reported an increase.
Portfolio Liquidity
It is important for institutional investors to be cognizant of liquidity management. The biggest liquidity need for foundations has been meeting their annual payout distributions. More than half of respondents (51%) have formal liquidity policies outlined in their investment policy statements, while another 12% of respondents have informal guidelines for liquidity considerations. Liquidity policies often include requirements for how much of the portfolio can be converted to cash within a specified number of days. Additionally, liquidity guidelines may establish limits on the percentage of the portfolio that can be invested in assets deemed illiquid. It is not uncommon for foundations to include unfunded commitments in these liquidity measures. Unfunded commitments represent capital that has been committed but not yet paid into private investment funds.
The dollar amount of unfunded commitments can be equivalent to as much as 25% or more of the portfolio’s current asset size at some larger foundations (Figure 22). On the other hand, these commitments can be relatively small compared to the size of the investment portfolio at other foundations. The median ratio of uncalled capital–to-LTIP market value was 12% for the overall foundation universe. The ratio gets considerably higher when including actual private allocations in the measure. In fact, for foundations greater than $1 billion, the median for this combined version of the ratio was approximately 50%.

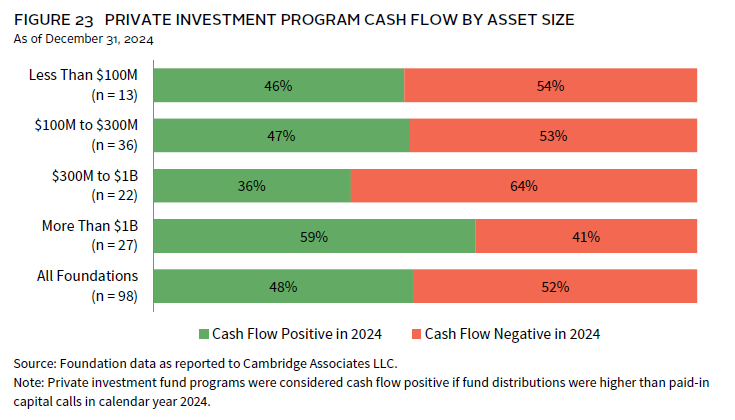
Distributions from existing private investment funds can serve as a source of funding for new capital calls. However, when these distributions fall short, institutions must find additional liquidity to meet new capital calls. Many institutional investors have had to grapple with this issue in recent years. A little more than half of respondents (52%) reported that their private investment programs were cash flow negative in 2024, meaning the amount of distributions from private funds was insufficient to cover the new capital paid in (Figure 23). The funding environment was slightly better than the previous year when 62% of foundations had cash flow negative private programs.
Portfolio Implementation
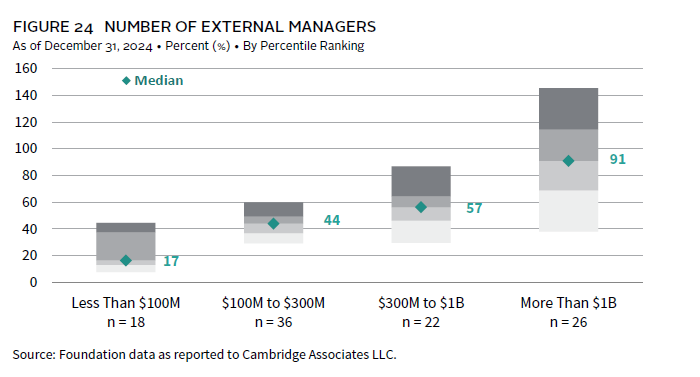
Institutions primarily use external investment managers to implement their portfolio allocations. The number of managers employed is largely influenced by the scale of total assets under management (Figure 24). Larger foundations, which have more capital to deploy, naturally maintain more manager relationships compared to smaller portfolios. In addition, allocations to private managers are typically less concentrated than manager allocations in public asset classes, leading to a greater number of manager relationships for portfolios where private allocations are higher. The median number of managers used by foundations greater than $1 billion was 91 at the end of 2024. In contrast, the median was 17 managers for the subgroup of respondents with assets less than $100 million. Further data on the number of managers used for specific asset classes can be found in the Appendix section of this study.
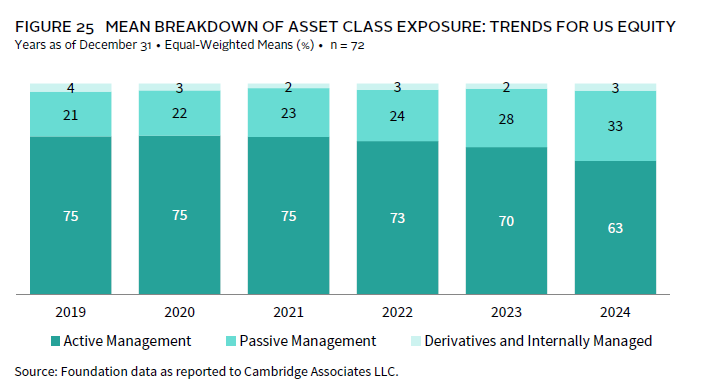
The overwhelming majority of allocations to public asset classes is invested via external managers, while just a small percentage of these strategies are internally managed. Most external allocations are implemented through actively managed funds and strategies, and this experience is mostly consistent across different asset sizes. However, US equity is one asset class where passive management has gained more traction in recent years. Figure 25 shows the average breakdown of US equity exposure for a constant group of 72 foundations that have provided data back to 2019. On average, 33% of US equity allocations were managed through passive vehicles in 2024, notably jumping up from 28% the year prior. In 2019, the average for the constant group was even lower at 21%.
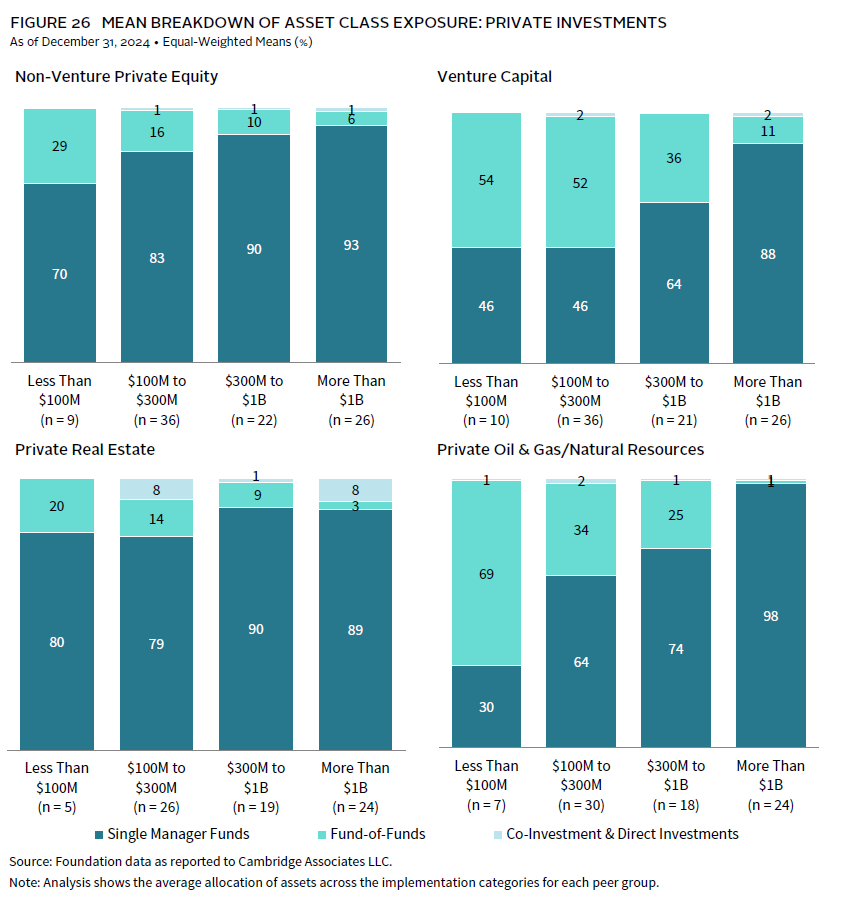
In private investments, institutions also implement most of their allocations through external managers (Figure 26). However, there is more variability in the types of funds used based on the portfolio’s asset size. Smaller institutions tend to rely more on fund-of-funds compared to larger peers, particularly in venture capital and private natural resources. For foundations with assets less than $100 million, fund-of-funds make up the majority of the average allocation to these strategies. In contrast, fund-of-funds represent a much smaller percentage of the average allocations for foundations with assets greater than $1 billion.