Fiscal year 2025 market backdrop
Fiscal year 2025 was marked by strong performance across most major asset classes. Once again, public equities delivered robust returns, with the MSCI ACWI rising 16.5% for the year. The returns of the geographic-based public equity indexes in Figure 1 all fell within a relatively narrow range that was well into the double digits. This broad-based equity rally reflected resilient corporate earnings, moderating inflation in the United States and Eurozone, and policy easing among several of the major central banks.
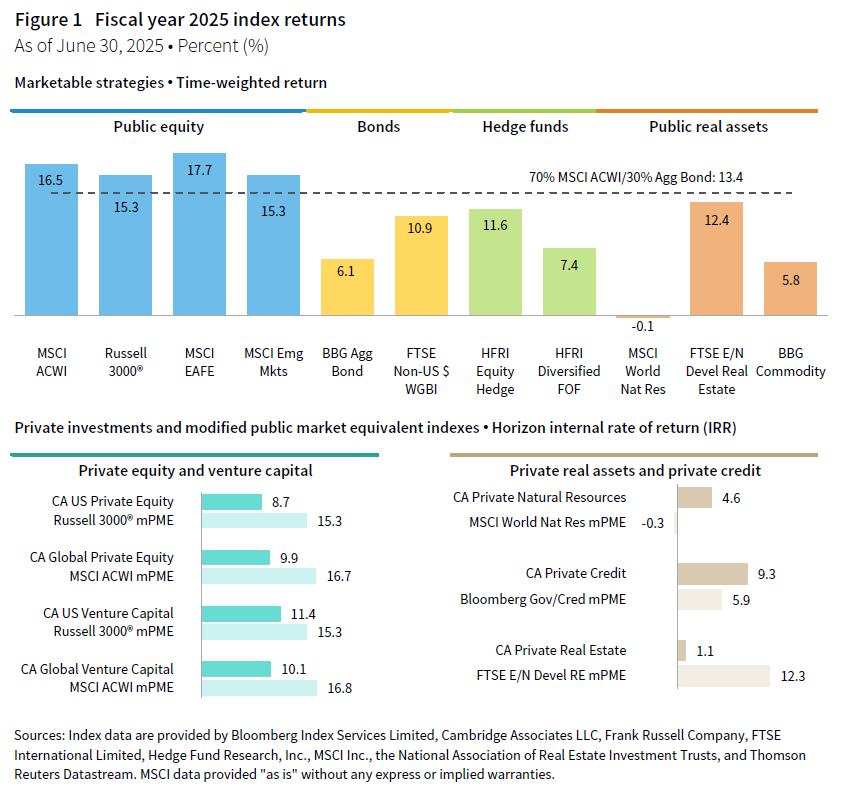
Fixed income markets also contributed positively to portfolio returns and were much improved compared to the previous year. The Bloomberg Aggregate Bond Index returned 6.1%, benefiting from Federal Reserve rate cuts and a modest decline in yields. Investment-grade sovereign bonds outside the United States, as measured by the FTSE Non-US World Government Bond Index, performed even better, returning 10.9% amid currency tailwinds and easing global monetary policy. With both equities and fixed income performing well in fiscal year 2025, a blended index weighted 70% MSCI ACWI and 30% Bloomberg Aggregate Bond Index returned 13.4%.
Many of the indexes representing alternative asset classes also delivered meaningful performance gains for the fiscal year. Exit activity for PE/VC began to show some signs of recovery, which had a positive effect on performance for these strategies. The CA PE/VC indexes produced their best returns since 2021, although they still fell short of the modified public market equivalent (mPME) benchmarks. The asset class indexes representing long/short equity hedge funds and private credit delivered solid performance as well. When considering the overall market landscape, 2025 was a favorable investing environment for endowments.
Peer returns fell within a relatively narrow band in fiscal year 2025
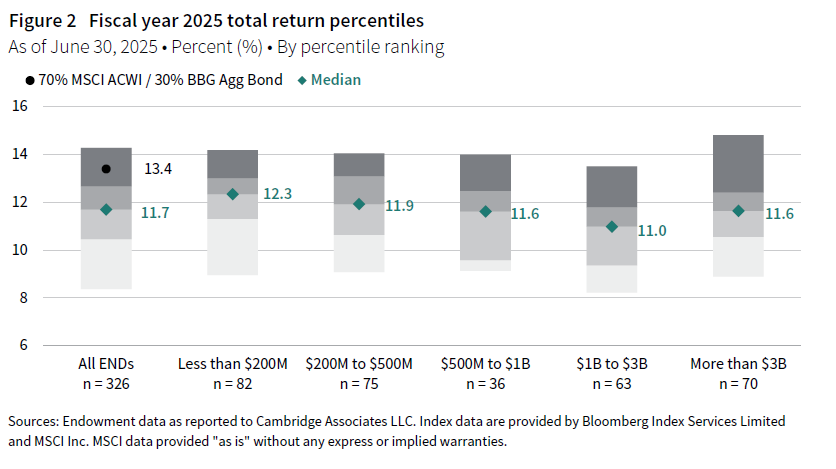
Most endowments reported total portfolio returns in the double digits in fiscal year 2025, with the median landing at 11.7% (Figure 2). This was the highest median return reported for the endowment universe since 2021. The dispersion in returns among endowments was much lower than what we have seen in recent years. The spread between the 5th and 95th percentile of performers was just 590 basis points (bps), which was the third lowest we have calculated in the over four decades of compiling endowment data. There was little variation when breaking the universe up into different asset size cohorts. The median return for all asset size subgroups in Figure 2 was within 70 bps of the median for the overall universe.
There was some correlation between peer allocations and investment performance in fiscal year 2025 (Figure 3). The top quartile of performers had the highest average exposure to public equity, and the bottom quartile had the highest private investment allocations. This makes sense, given the capital market landscape where public equities outperformed. However, the spreads in public versus private market returns were the smallest they have been since the late 2010s. Likewise, the actual differentials in average allocations among the four performance quartiles of peers were the smallest we have seen in several years.
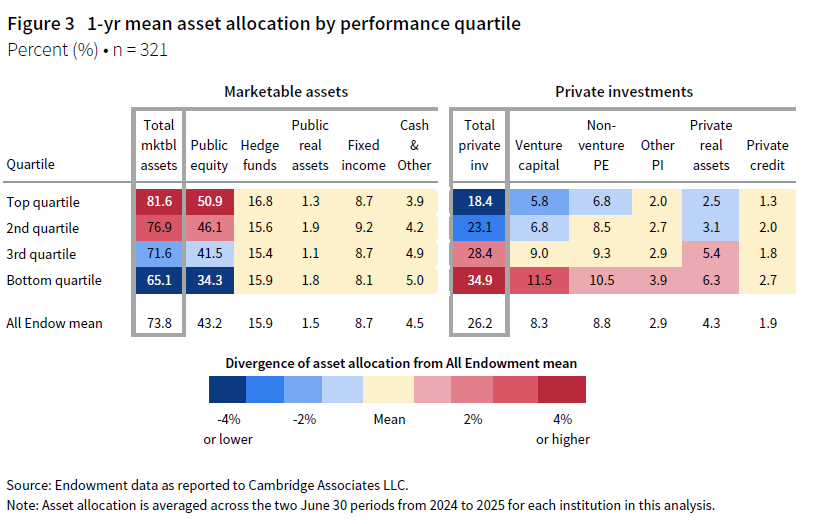
It is also important to note that the allocations presented in these tables are averages and can mask the variation in asset allocation structures that exist even among institutions that earn similar returns. For example, there were stark differences in asset allocations among the endowments that earned the best performance over the past year. Nearly half of the top 20 endowments as ranked by fiscal year return were among the highest allocators to private investments in the peer universe. This suggests that other factors beyond asset allocation played a meaningful role in the comparative performance story of 2025.
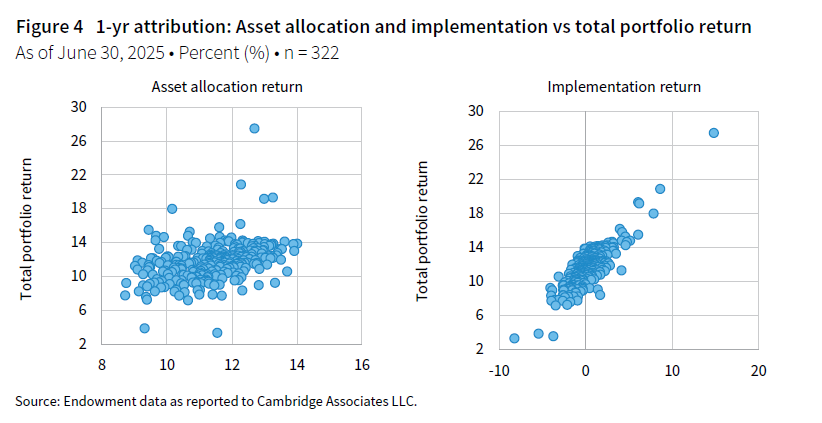
Our attribution model estimates how much of each institution’s return can be explained by its asset allocation. Plotting the estimated asset allocation returns against the total portfolio returns for the endowment universe confirms that the relationship between the two was not particularly strong for the fiscal year (Figure 4). On the other hand, the portion of return that came from implementing the portfolio was a key driver of relative peer performance according to our analysis. This is a departure from the trend of the last few years where asset allocation was the more impactful factor for understanding the dispersion in peer returns.
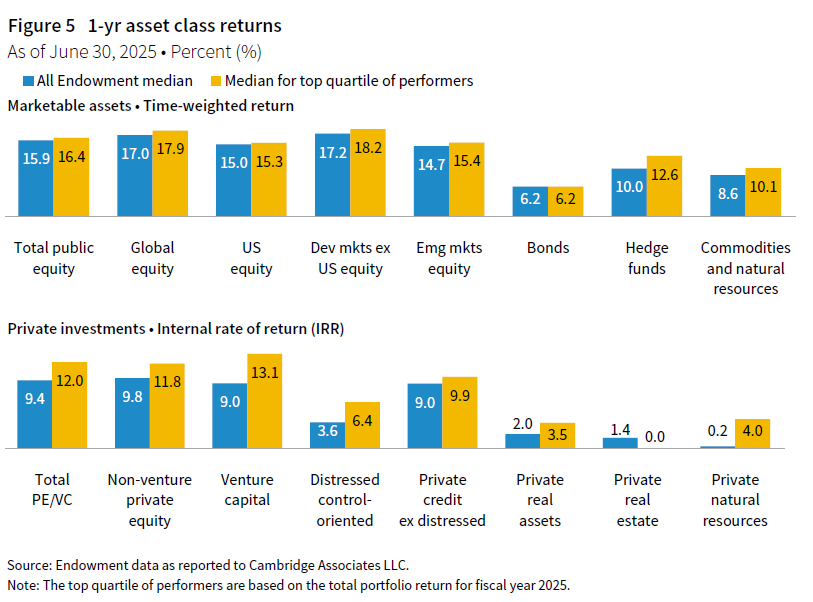
There are multiple things that can influence the implementation return estimated in our model, and it is impossible to precisely attribute every detail, given the level of data we gather in our surveys. However, a primary component is the alpha generated in portfolios. The asset class composite returns reported by endowments provide further insight into this factor. It was mainly alternative strategies where top performers stood out from other endowments in 2025. When comparing the median return for top quartile performers with the median of the overall universe, the largest differential was in venture capital (Figure 5). Top performers also tended to earn returns that were higher than the broad peer group in hedge funds, non-venture private equity, and some of the other private investment strategies.
Diversified portfolios continued the recent trend of underperforming a simple benchmark
A blended index weighted 70% MSCI ACWI and 30% Bloomberg Aggregate Bond Index is included in several of the analyses in this study. This 70/30 reference portfolio has long served as a useful yardstick in the evaluation of endowment performance. The simple portfolio weightings resemble the risk profile of many endowments from the perspective of how much is allocated to equities and equity-like assets. Further, the use of a passive, market-based measure helps contextualize the impact of asset allocation decisions to diversify into alternative asset classes. In years when both equities and bonds perform well, as in fiscal year 2025, the benchmark sets a high bar for diversified portfolios to clear.
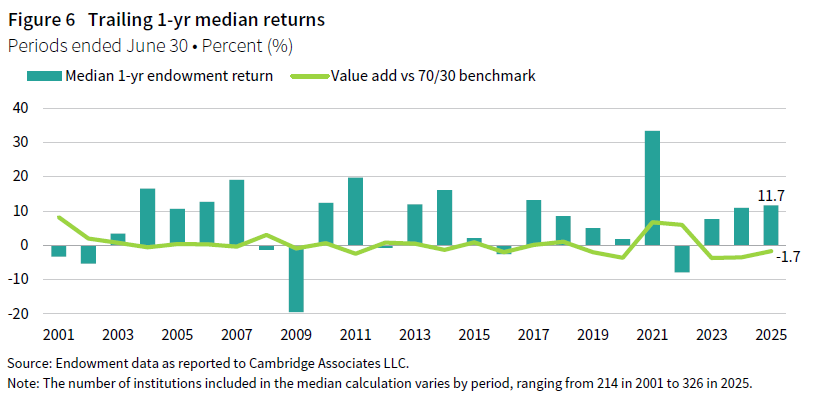
While many of the alternative asset classes delivered solid returns for the fiscal year, they did not quite match up to the simple 70/30 option. Consequently, the endowment median underperformed the simple benchmark by 170 bps in 2025 (Figure 6). This was actually a considerable improvement over the previous two fiscal years when the median’s underperformance were 350 bps and 370 bps, respectively. In fact, the spread between the peer group median and the simple benchmark this past year was the smallest it has been since 2018. The first half of the 2020s has seen volatile swings in both directions in terms of the relative out/underperformance of the median versus the 70/30 benchmark.
The dynamic between public and private equity market returns is usually the most important aspect to understand, as the bulk of endowment portfolios tend to be allocated across these strategies. The differential between the CA PE/VC Index and the MSCI ACWI mPME was as small in 2025 as it has been in several years (Figure 7). While this contributed to the narrowing of the spread between the peer median and the simple benchmark, the degree of underperformance for the median was still quite meaningful. This is because more than 20% of the average endowment portfolio is now invested in PE/VC—twice the allocation seen for most of the previous decade. As a result, even more moderate differentials between public equity and private equity market returns can significantly impact the median return’s value add against the simple benchmark.
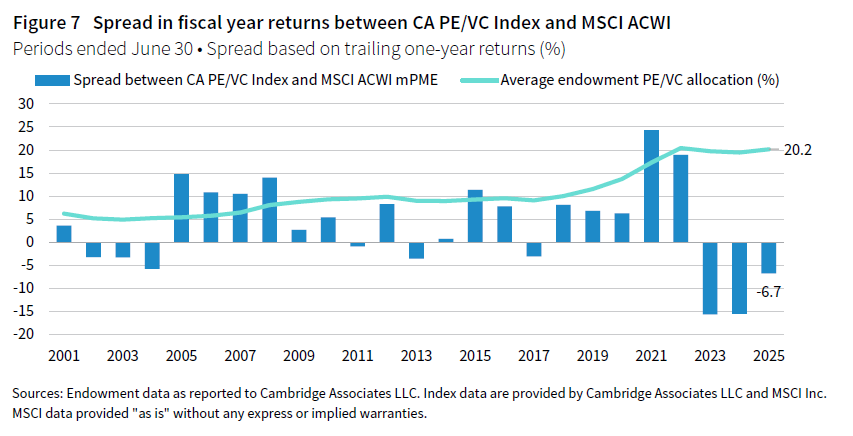
A glaring takeaway from the historical summary in Figure 7 is that the last three years have been a very challenging environment from the perspective of relative performance versus the 70/30 benchmark. The endowment median lagged the simple measure by 300 bps on an annualized basis over this period, which was by far the largest degree of underperformance from the last 25 years (Figure 8). Further, just 8% of peers earned a return that surpassed the benchmark over this most recent trailing three-year period.
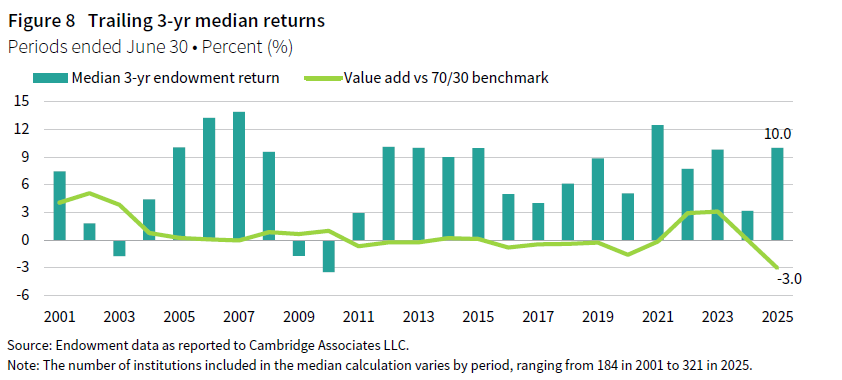
On the other hand, the trailing three-year performance in absolute terms was still robust. The median peer return (10.0%) was a substantial improvement over the figure reported in last year’s study. This year’s figure landed toward the top end of the outcomes since 2001, ranking six out of 25. Further return data on this and other trailing periods are contained in the Appendix section of this report.
The long-term performance story is a repeat of previous years
While simpler portfolios have generally performed best over the last three years, private investments continued to play a defining role when evaluating long-term performance of endowments. The US stock market provided excellent returns over the past decade with the broad market Russell 3000® Index earning 13% on an annualized basis (Figure 9). However, the CA US Venture Capital Index equaled the mPME version of the Russell 3000® and the CA US Private Equity Index performed even better. The outperformance of private markets was even greater when looking at global versions of the benchmarks.
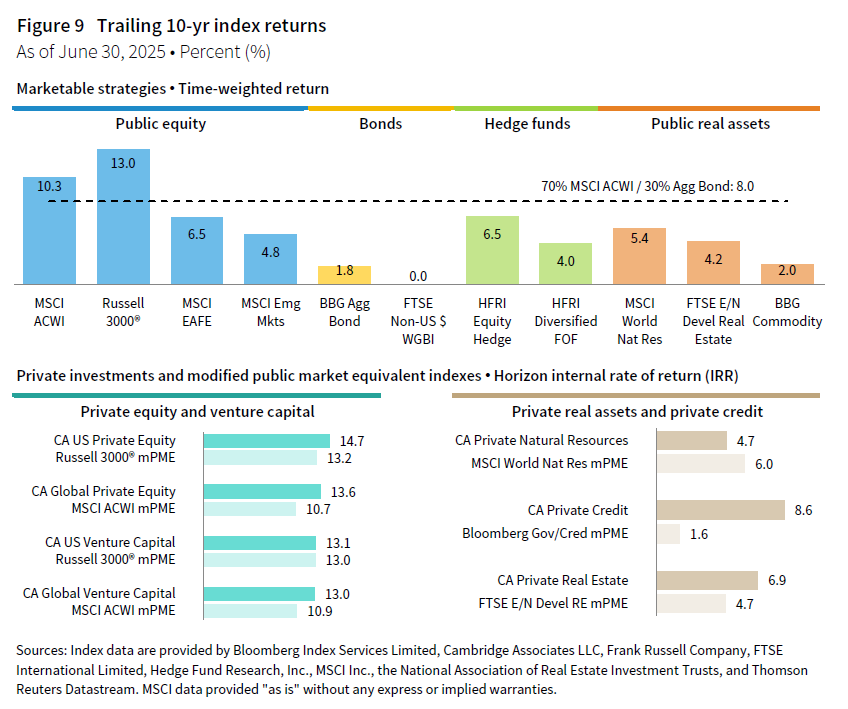
For bonds, the past decade was one of the lower trailing ten-year performance periods on record. The index tracking US investment-grade bonds returned less than 2%, and the index tracking sovereign bonds outside of the United States was flat. Private debt provided much more opportunity for enhanced returns as the CA Private Credit Index produced an internal rate of return (IRR) that was greater than 8%. Results were mixed when it came to real assets strategies, with private real estate outperforming its mPME counterpart and private natural resources strategies underperforming.
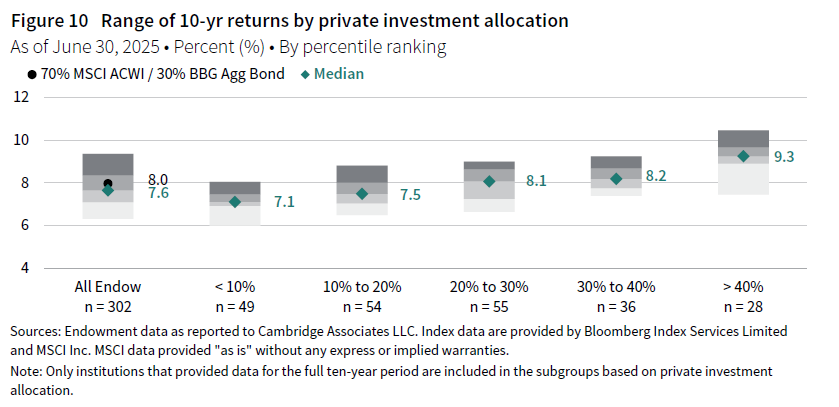
The context from the market overview correlates with the comparative peer results from the trailing ten-year period. Endowments with the highest allocations to private investments generally earned the best returns across this period. The median return for the subgroup of peers with more than 40% allocated to private investments was 9.3%. All except two endowments from this cohort outperformed the median return for the overall peer group (7.6%). In contrast, institutions with less than 10% allocated to private investments lagged in the performance rankings over the ten-year period. Just ten of the 49 endowments in this latter cohort earned a return that outperformed the overall peer group median.
The performance results for endowments in the middle of the private allocation spectrum were grouped more closely together (Figure 10). For example, the distribution of returns for the 30%–40% cohort was higher than those in the 10%–20% range, but not by a huge differential. This provides an important disclaimer that simply having above average allocations to private investments does not guarantee better performance. Past studies have consistently shown that the range of returns earned by managers in private markets was much wider than the range of returns among public managers. These dynamics can be a boon to portfolio returns for endowments whose private investment managers consistently deliver enhanced returns. Conversely, a private investment program with too many poor- or mediocre-performing managers can be a drag on portfolio returns.
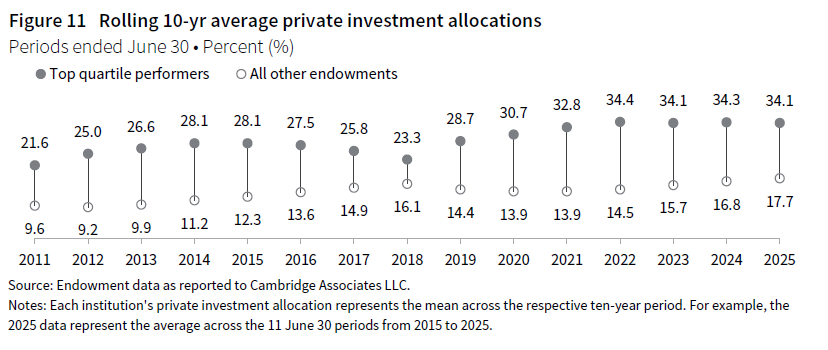
Within the endowment universe, historical trends show that top quartile performers have consistently maintained significantly higher private investment allocations compared to the rest of the peer group. On average, top quartile performers allocated 34% of their portfolios over the most recent trailing ten-year period, which was approximately 16 percentage points (ppts) higher than the average for the remaining endowments in the universe (Figure 11). This is all despite the last three years, where public equity—specifically in the United States—has mostly dominated in the capital market landscape.
It is clear from this analysis that private investing has been a cornerstone in the approach to portfolio construction for the endowments that have earned the best long-term returns. Nevertheless, past success with high private investment allocations should not necessarily be viewed as the exact blueprint for future results. Endowments that can continue to select high-quality private managers and adapt investment strategies in an ever-evolving investment landscape will be the ones that flourish the most going forward.