At most endowments, the majority of the long-term portfolio is invested in public equity and PE/VC. On average for the overall endowment universe, about 64% of the long-term investment portfolio (LTIP) was allocated across these categories at the end of fiscal year 2025. The combined average allocation does not vary much across different asset sizes, ranging from a low of 62% for the greater than $3 billion subgroup to a high of 66% for the $200 million to $500 million cohort. However, the breakdown of allocations between public and private equities does look quite different when going up or down the portfolio size spectrum.
Generally, smaller endowments continued to have the highest public equity allocations, while larger endowments had higher private allocations (Figure 20). For endowments less than $200 million, public equities made up 52% of portfolios, on average, while PE/VC accounted for just 13%. In contrast, the average breakdown was nearly even across the two categories for endowments greater than $3 billion. The largest endowments allocated an average of 33% to public equity and slightly less (29%) to PE/VC.
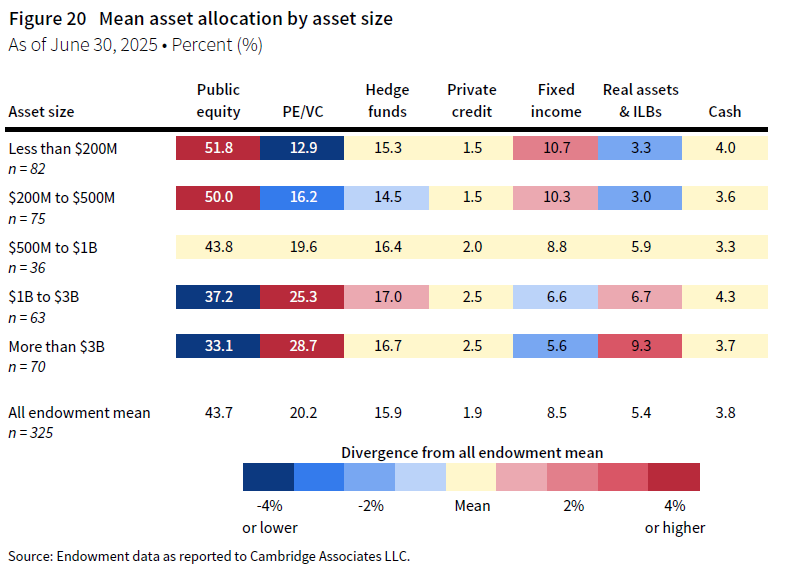
There were also distinct differences elsewhere when comparing asset allocation structures across the asset size groups. Smaller endowments tended to allocate more to bonds, with an average allocation of nearly 11% for endowments less than $200 million. This was almost double what the average fixed income allocation was for endowments greater than $3 billion. Conversely, the largest endowments allocated more to real assets and inflation-hedging strategies, with an average of 9% invested, compared to less than 3% for the smallest endowments. The bulk of real assets allocations for larger endowments came from private investment strategies. Hence, the differential in illiquid allocations between large and small endowments is even wider than what is shown in the PE/VC category alone.
Asset allocation trends
Over the long term, the key trend in endowment investing has been the increase in private equity allocations. Figure 21 tracks the trend in average portfolio allocations for a group of 136 endowments that have participated in each of our annual surveys over the past two decades. The average PE/VC allocation for this constant group has more than quadrupled, rising from 5% in 2005 to 24% in 2025. This shift has largely been funded by diversifying out of public equities, with average allocations declining from 48% in 2005 to 38% in 2025. However, this decrease in public equities alone does not account for the entire increase in PE/VC. Average fixed income allocations have also declined substantially over this period from 15% to 7%. The result is that most endowments’ portfolio risk profiles are more equity-oriented today than they were two decades ago.
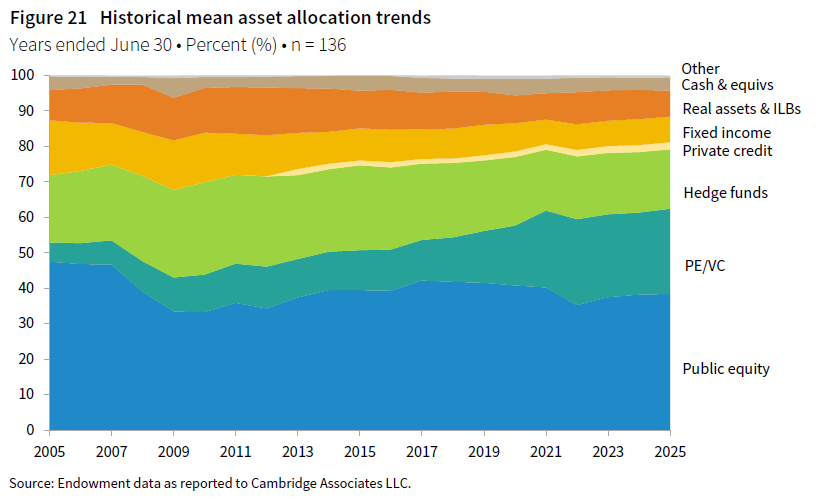
Shifts in trends over the last three years have been relatively muted compared to much of prior history. Public equity allocations have seen the biggest change, with the peer average increasing from 32% to 35%. This was mostly offset by a decrease in real assets allocations (-2 ppts) and hedge funds (-1 ppt). Average allocations in the other categories in Figure 21 have mostly held steady since 2022.
One challenge in analyzing shorter-term asset allocation trends is distinguishing between changes driven by market movements and those resulting from intentional allocation adjustments. For example, public equity outperformance in recent years could naturally shift the weightings of those strategies, as already noted. This is most likely the case as a slightly larger percentage of peers reported a decrease in their public equity target allocations in 2025 compared to those that reported an increase. In fact, the same was true in each of the two prior fiscal years as well. These data suggest that the recent changes in average asset allocations were mostly attributable to market dynamics and the natural effects those had on portfolio holdings.
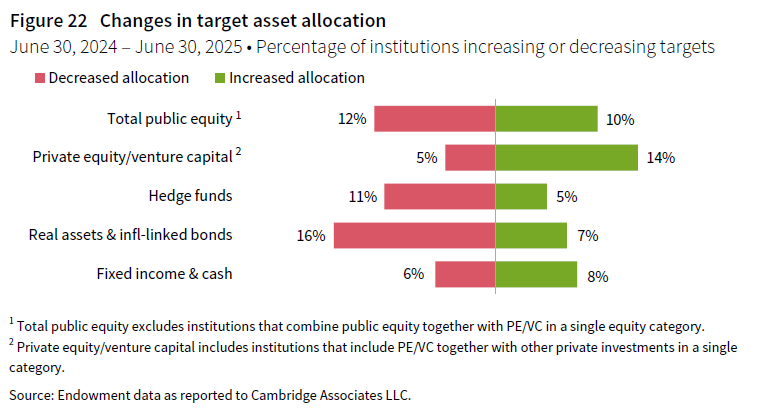
We have produced the exact same analysis in Figure 22 since 2017 and it is noteworthy where this year’s survey responses on PE/VC target allocations fall in line with previous years. The percentage of respondents increasing their target in fiscal year 2025 (14%) was the smallest percentage reported across this entire history. Additionally, the percentage of endowments reporting a decrease to PE/VC in 2025 (5%) was the highest result in the period analyzed. Future responses will reveal whether endowments are reaching a plateau in planned allocations to these strategies.
Portfolio liquidity
Liquidity management is a key issue that endowments need to be cognizant of. Traditionally, the biggest liquidity need for endowment portfolios has been meeting their annual spending policy distributions. The median effective spending rate for endowments tends to be between 4.5% and 5% in most years. While new gifts and inflows can help offset some of this spending from a liquidity management perspective, ensuring adequate liquidity for annual distributions remains a key objective for endowments.
Nearly half of respondents (48%) have formal liquidity policies outlined in their investment policy statements. Another 24% of respondents have informal guidelines for liquidity considerations. Liquidity policies often include requirements for how much of the portfolio can be converted to cash within a specified number of days. Additionally, liquidity guidelines may establish limits on the percentage of the portfolio that can be invested in assets deemed illiquid. It is not uncommon for endowments to include unfunded commitments in these liquidity measures. Unfunded commitments represent capital that has been committed but not yet paid into private investment funds (Figure 23).
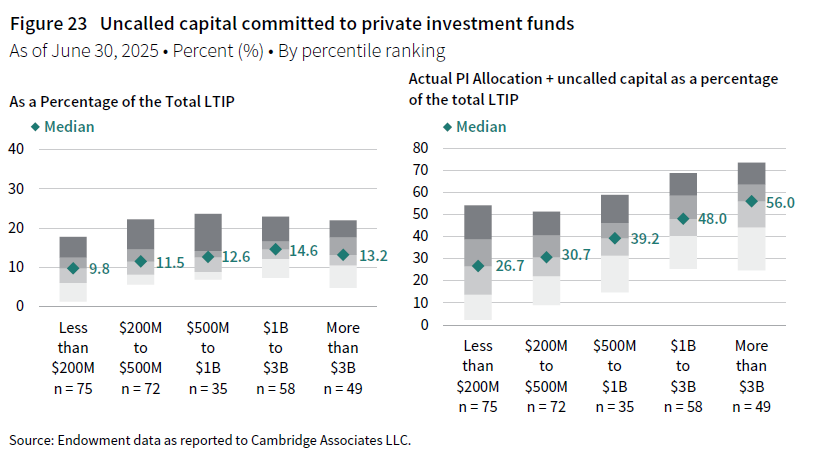
The dollar amount of unfunded commitments can be equivalent to as much as 20% or more of the portfolio’s current asset size at some endowments. On the other hand, at some smaller endowments, these commitments can be relatively small compared to the size of the investment portfolio. The median ratio of uncalled capital–to-LTIP market value was highest for the cohort of endowments between $1 billion and $3 billion (14.6%) and lowest for endowments with assets less than $200 million (9.8%). When considering a measure that combines unfunded commitments with actual private allocations, these ratios were generally much higher at larger endowments compared to smaller peers.
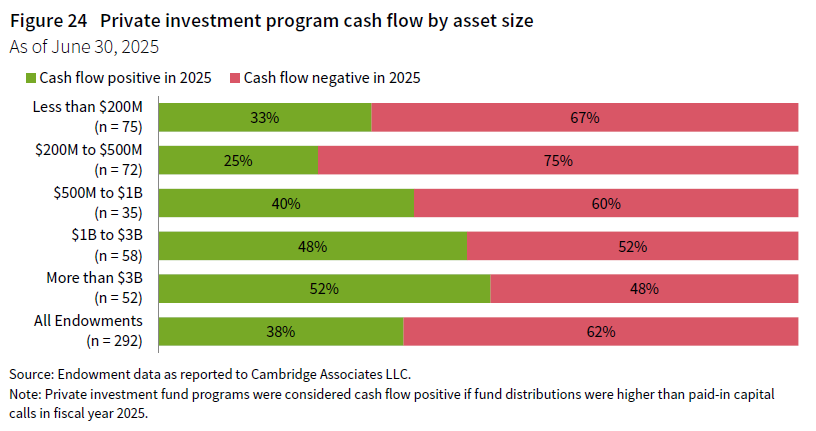
Distributions from existing private investment funds can serve as a source of funding for new capital calls. However, when these distributions fall short, institutions must find additional liquidity to meet new capital calls. This was the case for the 62% of respondents that reported that their private investment programs were cash flow negative in fiscal year 2025, meaning the amount of distributions from private funds was insufficient to cover the new capital paid in (Figure 24). This was a noticeable improvement over the previous year, when 77% of endowments reported cash flow negative private programs.
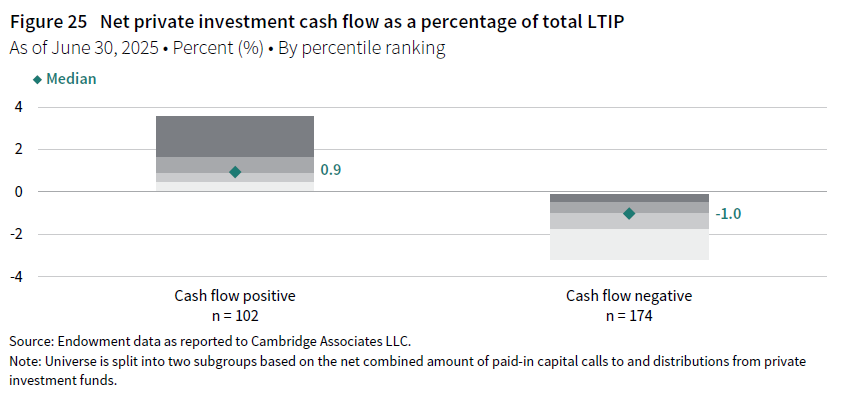
The net private investment cash flow is the amount left over after paid-in capital calls are subtracted from fund distributions. This net amount was equivalent to a relatively small percentage of the total portfolio value at most endowments (Figure 25). For most respondents, this net amount fell within a range of +/- 1% of the total portfolio value in fiscal year 2025. However, there was still a notable proportion of the peer group that reported negative cash flow ratios of -3% or less. This underscores the importance of establishing appropriate liquidity management guidelines and strategies, particularly when it comes to tracking and monitoring the illiquid bucket of the portfolio.
Portfolio implementation
Endowments primarily use external investment managers to implement their portfolio allocations. The number of managers employed by an endowment is largely influenced by the scale of total assets under management. Larger endowments, which have more capital to deploy, naturally maintain more manager relationships compared to smaller portfolios. In addition, allocations to private managers are typically less concentrated than manager allocations in public asset classes, leading to a greater number of manager relationships for portfolios where private allocations are higher. The median number of managers employed by endowments greater than $3 billion was 141 at the end of fiscal year 2025. In contrast, the median was just 31 managers for the subgroup of respondents with assets less than $200 million. Further data on the number of managers used for specific asset classes can be found in the Appendix section of this study.
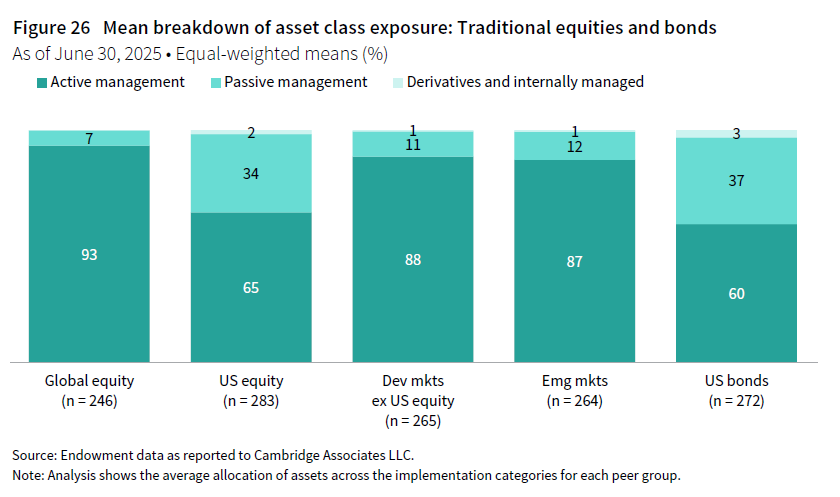
The overwhelming majority of allocations to public asset classes were invested via external managers, while just a small percentage of these strategies were internally managed. Most external allocations were implemented through actively managed funds and strategies, and this experience was consistent across different asset sizes. However, US equity and US bonds are two asset classes where the use of passive management and index funds were more prevalent (Figure 26). On average, 34% of US equity allocations were managed through passive vehicles in 2025. This statistic was only slightly higher compared to the previous fiscal year (33%). Passive management for US bonds accounted for an average of 37% of endowments’ asset class exposure at the end of fiscal year 2025.
In private investments, endowments also implement most of their allocations through external managers (Figure 27). However, the types of funds used can vary based on the portfolio’s asset size. Smaller institutions tend to rely more on fund-of-funds compared to larger peers, particularly in venture capital. For endowments with assets less than $200 million, fund-of-funds made up the majority of the average allocation to this strategy. In contrast, fund-of-funds represented only a small fraction of the average allocations for endowments with assets greater than $3 billion.
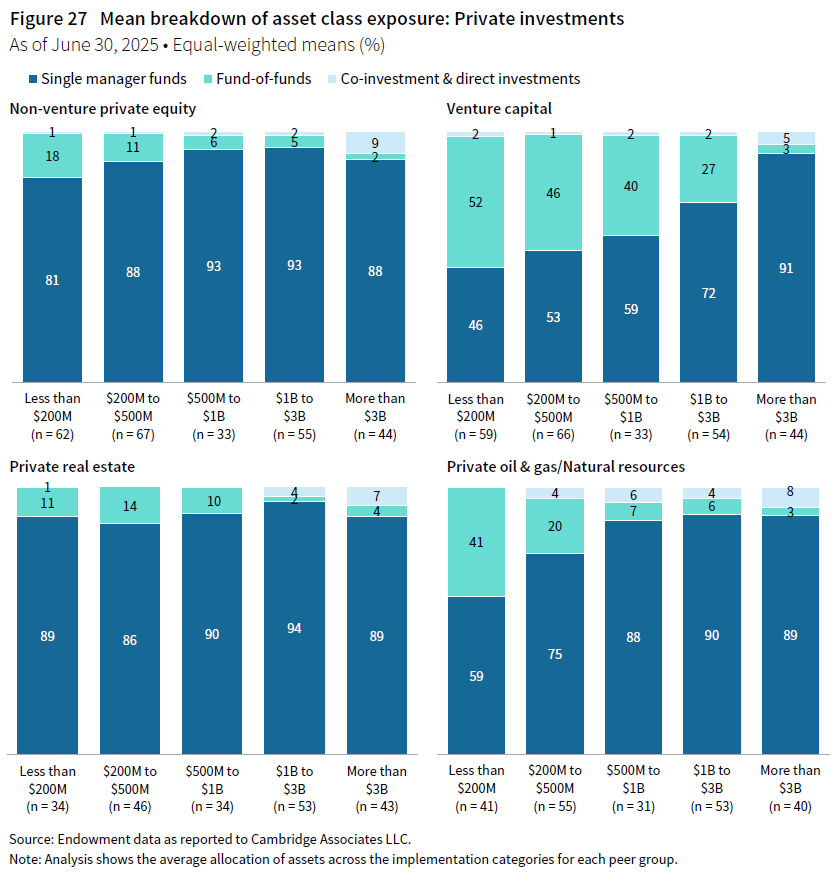
Larger endowments are more likely to have direct private investments, although these typically account for less than 10% of average asset class exposure. Endowments with the resources and expertise to manage direct investments effectively can take advantage of deals they find particularly attractive and save on higher fees that are charged through the traditional limited partner (LP) fund structure. Most direct investments reported by endowments were actually co-investments made alongside a general partner. Some endowments also engaged in direct “solo” investments, where the transaction was originated and managed independently by the endowment itself.