Unit prices have sold off in sympathy with energy-related assets, but higher yields and reasonable fundamentals should translate into strong returns in the long term
- At the end of the third quarter, yield-based valuation metrics were exceptionally high relative to recent history. Valuations at this level typically deliver hefty payouts.
- Fundamentals do not look inconsistent with historical levels. Revenues and cash flows are estimated to decrease in 2015 before rebounding, but leverage ratios are only slightly elevated relative to history and are expected to decrease next year.
- Midstream MLPs, which make up the vast majority of the sector’s market capitalization, appear to be able not only to endure continued volatility, but also to capitalize on growth opportunities.
In August we moved energy master limited partnerships (MLPs) from fairly valued to undervalued, given that yields increased to 7% in July. Since then, yields have continued to move up, topping 8% at the end of September for the first time since November 2009. In our view, the asset class is currently more appealing from a valuation perspective than at any point in recent years, presenting an attractive opening for long-term investors that use active management. Taxable investors, in particular, may be in a position to benefit because of MLPs’ pass-through tax structure. In this research note, we review MLP valuations, fundamentals, and the broader economic backdrop.
Valuations Improve as Energy Markets Sell Off
For more background on the MLP market, please see Sean McLaughlin et al., “Master Limited Partnerships,” Cambridge Associates Research Report, 2011.
Stung by weaknesses in crude oil, MLPs—down 40.1% based on the Alerian MLP Index since its peak in August 2014—have been unable to separate themselves from other energy-related assets, closely following the returns of broad energy and commodity indexes (Figure 1). While those partnerships engaged primarily in upstream activities like the exploration and production of crude oil and natural gas fared the worst, few MLPs were spared from the downturn.[1]Often described as something akin to a toll road, many MLPs own pipelines and other infrastructure assets connecting upstream well operators to downstream refiners and end users.
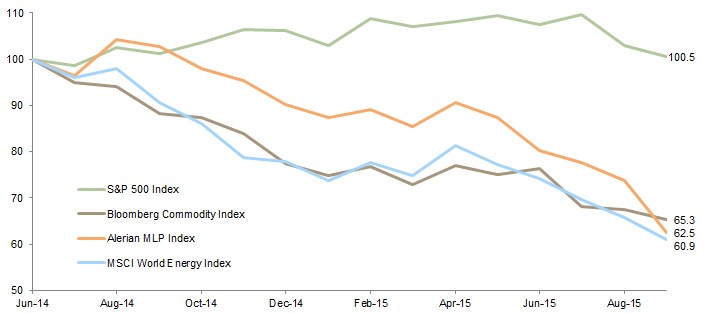
Figure 1. Cumulative Wealth of Alerian MLP Index Versus Other Indexes
June 30, 2014 – September 30, 2015 • US Dollar • June 30, 2014 = $100
Sources: Alerian, Bloomberg L.P., MSCI Inc., and Thomson Reuters Datastream. MSCI data provided “as is” without any express or implied warranties.
Perhaps unsurprisingly, the decline in prices of energy-related assets has been accompanied by an uptick in correlations among those assets, as many investors have indiscriminately sought to exit the sector. While the MLP business model is more volume driven than commodity dependent, the Alerian MLP Index’s rolling three-month correlation with crude oil approached 0.6 on multiple occasions this year, up from 0.2 at the end of September 2014.
Third quarter 2015’s poor performance, which was the worst quarterly result in the Alerian MLP index’s 20-year history, has translated into better yield-based valuations for the asset class. At the end of September, the index yielded 8.3%, nearly 2 ppts above the ten-year median of 6.4% and higher than 89% of these observations (Figure 2). On a relative basis, the yield spreads of the Alerian MLP Index over ten-year US Treasuries and the Barclays US Credit BAA Index are exceptionally high compared to historical data. In fact, both spreads are in the top decile of observations in the last decade, a position that has never been associated with a negative subsequent one-year return and that typically delivers a chunky payout.
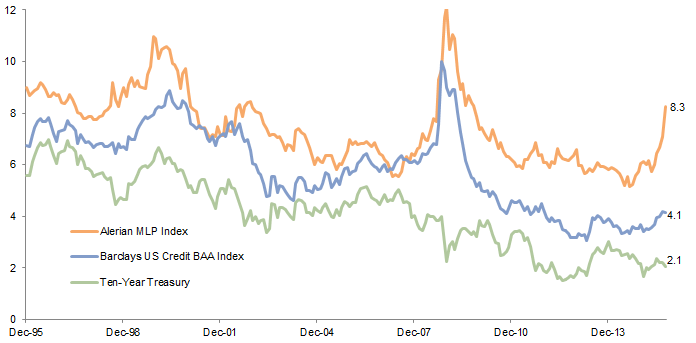
Figure 2. MLP Yields and Bond Yields
December 31, 1995 – September 30, 2015 • Percent (%)
Sources: Alerian, Barclays, and Thomson Reuters Datastream.
Valuations based on EBITDA multiples do not paint as clear a picture. At the end of June, the Alerian MLP Index’s median price-to-EBITDA multiple was broadly similar to historical observations, and its median enterprise value-to-EBITDA multiple was elevated (Figure 3). Looking at just the ten largest partnerships, the multiples worsen slightly. So how do we reconcile the discrepancy in valuation metrics with our view that the asset class is undervalued?
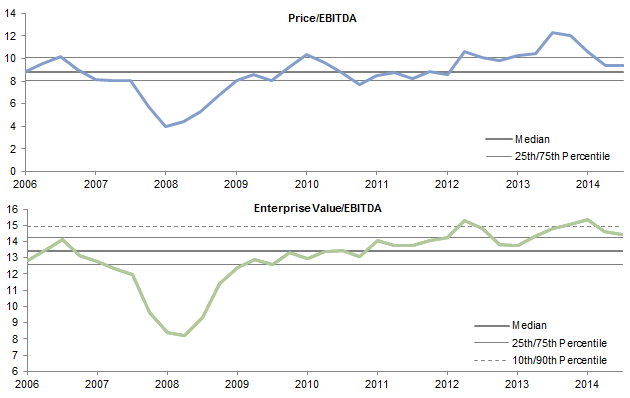
Figure 3. Alerian MLP Index EBITDA-Based Valuation Multiples
December 31, 2006 – June 30, 2015
Source: FactSet Research Systems.
Note: Data are quarterly median values of the Alerian MLP Index.
For MLPs, we tend to give added weight to yield-based metrics because, unlike traditional companies, MLPs generally pay out all of their available cash to unitholders. The yield on the Alerian MLP Index is also calculated on an indicative basis, meaning it relies on the latest-announced distributions and is thus forward-looking. EBITDA multiples can be distorted by restructuring charges, loss-reserve releases, and other transitory impacts, and with multiples sending different signals today, yields-based metrics seem to be more meaningful.
Fundamentals Appear Solid Despite Market Decline
Fundamentals for the broader universe look consistent with historical averages. Revenues and cash flows are estimated to decrease in 2015 before rebounding in 2016, but leverage ratios are only slightly elevated relative to history and are expected to decrease next year. For the most part, partnerships seem to have avoided facing sizable repayments on their long-term debt in the next three to five years, and in the case of the ten largest MLPs, management has been able to lengthen the weighted average years to maturity compared to just three years ago.
Access to capital markets has also not been cut off in the last year. MLPs depend on outside financing to fund growth because they pay out most of their excess cash to unitholders, and the amount of debt capital raised this year may surpass last year’s record total. On an ongoing basis, smaller, more commodity-exposed firms may find it challenging to raise capital, particularly if prospects for a rebound in energy prices dim, but the larger, more diversified partnerships seem positioned to continue to tap markets.
Still, the impact of the energy market supply glut on MLPs has varied, with some partnerships considerably more strained than others (Figure 4). This is perhaps particularly true for upstream players, which tend to have significant exposure to commodity prices, typically owning and operating oil & gas assets in mature basins. As uneconomic wells have been left idle, these partnerships have suffered, with many losing more than 75% of their market value in the last year.
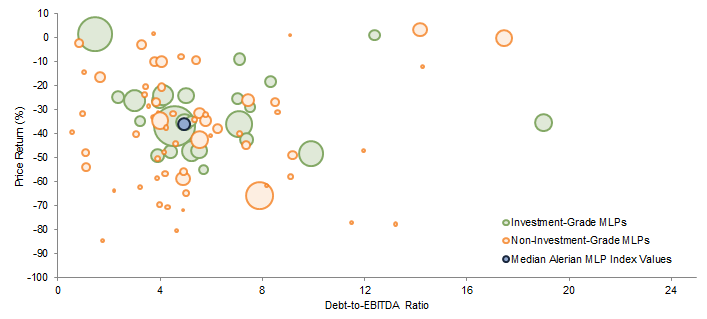
Figure 4. Price Return, Leverage, and Market Cap for MLPs
September 30, 2014 – September 30, 2015
Sources: Alerian and Bloomberg L.P.
Notes: Bubble size reflects relative market capitalization. MLPs with price returns or debt/EBITDA in the top and bottom 5th percentile or missing one of those data points are excluded from data to eliminate outliers.
The energy market’s relentless pressure on these firms has taken a toll on their fundamentals, and their leverage and distribution coverage ratios are among the asset class’s worst. However, upstream exploration and production players account for only a few percentage points of the MLP universe’s market capitalization. After several partnerships cut distributions in recent quarters, their share of the Alerian MLP Index shrank from the high single digits last year to just 0.4% today.
Although the Alerian MLP Index’s distribution stream has declined by nearly 10% in the last four quarters, many partnerships seem poised to grow distributions. Of the ten largest constituents of the Alerian MLP Index (which together account for two-thirds of its market value), forward distribution estimates have not changed materially from estimates made in the middle and end of last year (Figure 5). In fact, analysts expect the median distribution growth rate to be 6% in both 2015 and 2016, a rate not dissimilar to the long-term average. Among the broader index and amid a bout of energy market turmoil unseen in years, around 70% of partnerships in the Alerian MLP Index have raised their payouts in recent months.
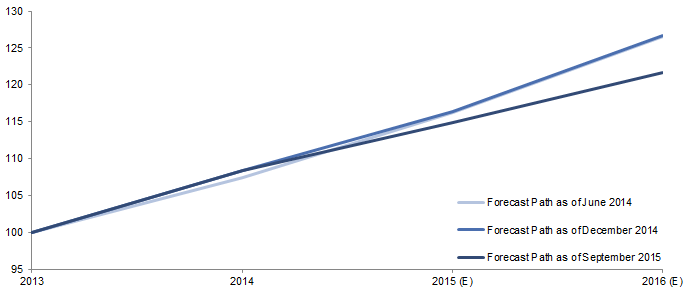
Figure 5. Cumulative Wealth of Large MLPs’ Distributions (Actual and Estimated)
2013–2016 • US Dollar • December 31, 2013 = $100
Sources: Alerian, Bloomberg L.P., and FactSet Research Systems.
Notes: Data are cumulative wealth of actual and estimated median annual distribution growth rates for the ten largest MLPs by market cap in the Alerian MLP Index as of July 31, 2015. The June 2014 path includes estimates for calendar year 2014, while December 2014 and September 2015 paths reflect actual distribution growth in 2014.
Contrary to some beliefs, partnerships are still investing in new infrastructure assets throughout the country, from new crude oil pipelines in the Permian Basin to natural gas projects in the Marcellus and Utica regions. Despite substantial press coverage on capital expenditure cuts among major exploration and production firms, Wells Fargo estimates that among MLPs, aggregate capital invested in growth projects this year will surpass $33 billion, the most in the history of the sector. These current investments will support distribution growth in future years, as these projects come online.
MLPs also have their eyes on new infrastructure projects further down the road. In the next two years alone, one of the industry’s largest partnerships is scheduled to break ground on more than $10 billion in growth projects. Looking at the longer term, by one estimate, over $600 billion of new investments in North American midstream infrastructure will be required to match energy needs in the next two decades. As we’ll explore a bit further in the next section, infrastructure needs tend to be based on long-term supply and demand dynamics, not short-term considerations.
The Broader Backdrop
Questions about commodity prices and interest rates have been central to recent discussions on MLPs, overshadowing to some extent attractive valuations and reasonable fundamentals. To us, long-term commodity supply and demand levels continue to appear supportive of the sector, and fears of a negative slide linked to rate hikes seem overblown.
It’s all about oil. In recent years, MLPs have benefited from the shale oil & gas boom, with hefty growth rates leading to outsized returns for investors. Falling US oil production and low crude oil prices have understandably raised doubts about the sustainability of some energy-infrastructure assets. While some of those doubts are justified, the macroeconomic backdrop seems supportive of growth prospects in the long term.
Low prices have forced supply to adjust. The US Energy Information Administration recently estimated US crude oil production in July fell to 9.4 million barrels per day, down from its April peak of 9.6 million (Figure 6). The government agency forecasts a steady decline continuing into next year before rebounding in the fourth quarter of 2016. This view seems to be broadly consistent with many market observers, suggesting the volumes of crude oil transported by midstream MLPs may not be widely in jeopardy.
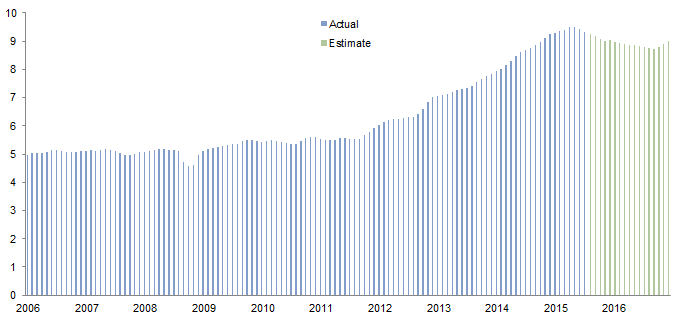
Figure 6. Rolling Three-Month Average US Crude Oil Production
2006–2016 • Barrels per Day (millions)
Source: US Energy Information Administration.
Note: Data after July 2015 are estimates based on EIA Short-Term Energy Outlook.
Even if crude oil production takes longer to rebound, long-term supply and demand dynamics continue to look positive, regardless of whether new supplies (e.g., Iran) hit global markets. The International Energy Agency said this year that the top two sources of capacity growth in the next five years are North America and Iraq, forecasting that production in the former would need to grow by 3 million barrels per day by 2020, as the global demand for crude oil increases by an estimated 1 to 2 million barrels per day annually. They note the North American production forecast could be materially increased by negative political developments in Iraq and other OPEC countries, a not-unreasonable caveat considering the litany of challenges faced by cartel members.
Production levels will also continue to be buoyed by advancements in technologies. Despite the US oil rig count falling from close to 1,600 last September to near 650 today, production has remained relatively robust. Drillers were able to dramatically improve average well recovery rates by tightening wellhead spacing, extending horizontal drilling length, and increasing frac stages per well, changing the economics for many. Anecdotal evidence suggests partnerships are likely to continue to make strides in reducing their break-even points in the next years.
It’s not just about oil. Natural gas production has also grown rapidly in recent years, due in large part to shale formations in the Marcellus and Utica basins. These two adjacent shale plays extend from West Virginia through Pennsylvania and Ohio into New York, and have accounted for nearly 85% of all shale natural gas production growth in the United States since the beginning of 2012 (Figure 7). Less than ten years ago, natural gas producers broadly believed this formation was uneconomical.
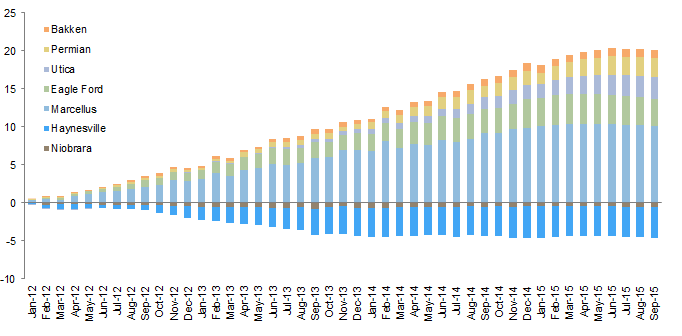
Figure 7. Cumulative Change in US Natural Gas Production
January 31, 2012 – September 30, 2015 • Cubic Feet per Day (billions)
Source: United States Energy Information Administration.
Note: These seven regions have accounted for over 90% of domestic natural gas production growth from 2011–2014.
To a large extent, investments in energy infrastructure are still needed to accommodate a change of this magnitude, and with dry natural gas production expected to increase by roughly 20% and natural gas liquids by 50% from 2013 levels to 2020, partnerships will need to expand. Further, with a large disparity in natural gas prices among many parts of the United States, partnerships that are building infrastructure to connect regions like Marcellus and Utica to major population centers seem positioned to benefit.
What about interest rates? Given the short history of the MLP index and the limited instances of a rate increase during its existence, it’s difficult to use history as a guide for how MLPs will react to a move in interest rates. The period that does exist—June 30, 2004, to June 29, 2006—offers a limited view. In the months prior to this period’s first rate hike, the Alerian MLP Index did dip modestly as it became clear a decision was imminent, but in the two-year period that followed, the index delivered an annual compound growth rate of 17.8%. Expanding the dataset to include periods in which the ten-year US Treasury yield rose by 75 bps or more shows a similar result. In four of the five instances since 2000, the Alerian MLP Index’s total return was positive (Figure 8).
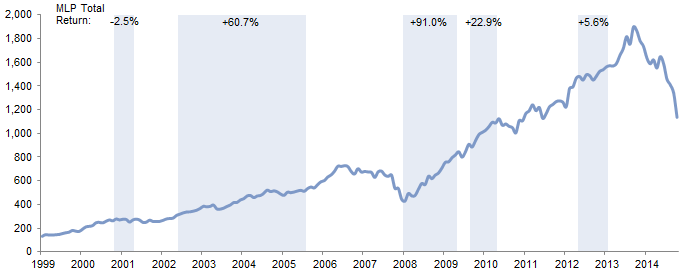
Figure 8. Performance of Alerian MLP in Periods of Rising Treasury Yields
December 31, 1999 – September 30, 2015 • Index Value (US Dollar)
Sources: Alerian and Thomson Reuters Datastream.
Notes: All data are monthly. Shaded area represent periods where Ten-Year US Treasury yield rose by 75 bps or more. Percentages represent the total return of the Alerian MLP Index during the respective rising rate period.
Which partnerships might be most at risk during a rate rise? We tend to think the unit prices of smaller partnerships that have less diversified revenue streams may be under the most pressure. Larger, diversified MLPs primarily have fixed debt with maturities ranging from ten to 30 years, safeguarding them to some extent from immediate changes in interest expense. In contrast, smaller firms not only often have a higher portion of floating long-term debt but they also have a higher share of short-term debt, all of which is rate sensitive. Also, although all partnerships operating liquids pipelines are permitted to increase tariffs each year by the Producer Price Index + 2.65%, smaller partnerships could be stressed to deliver services at low prices and choose not to increase tariffs by that margin.
Still, we would caution investors against making decisions too dependent on rates. Federal Reserve policymakers have been signaling for months they plan to raise rates this year, and while the majority of Federal Open Market Committee members indicated last month that they continue to expect a rise before next year, the projected path of rates has only become shallower in recent meetings. Regardless of when short-term interest rates may move, the market is not expecting long-term rates to move meaningfully, and with economic projections not suggesting a strong pickup in economic activity, it seems reasonable to believe interest rates may not move sharply in the near term, creating less risk for MLP investors.
Conclusion
Energy markets are undergoing a transition period that may continue to rile MLPs in the short term, with small partnerships that are close to the wellhead appearing to be the most at risk. Larger midstream MLPs, which make up the vast majority of the sector’s market capitalization, appear to be able not only to endure continued volatility, but also to capitalize on medium-term growth opportunities. Committing capital to active managers with expertise in the MLP sector is likely to be the best approach for many investors, as the careful evaluation of items including basin economics, contract types, and entity structures may lead to outperformance relative to a broad market index. With current yields and spreads over ten-year Treasuries at exceptionally high levels relative to recent history and a plausible annual distribution growth pace of 3% to 5%, this asset class could deliver chunky relative returns in the longer term.
Kevin Rosenbaum, Investment Director
Nroop Bhavsar, Senior Investment Associate
Footnotes