Emerging markets equities have tested investors’ patience in recent years, but those with a long time horizon should maintain their overweights, as today’s exceptionally low valuations should pay off in higher returns
- Valuations today are similar to levels touched during the Asian financial crisis, the aftermath of the 9/11 terror attacks, the SARS epidemic, and the global financial crisis, in the 4th percentile relative to their 20-year history.
- Macroeconomic headwinds facing emerging markets remain high, and equity markets might take considerable time to rebound, but we are confident that earnings and valuation multiples will bounce back.
- Investors concerned about currency volatility and commodity-price exposure can tilt toward Asia, with the understanding that the lower commodity risks are packaged together with higher China exposure.
Please see Sean McLaughlin, et al., “The Investment Compass Points Due East: Asian Emerging Markets’ Appeal to Investors,” Cambridge Associates Research Note, June 2015.
The patience of emerging markets investors has been sorely tested, as emerging markets underperformed global developed equities by a massive 11% annualized over the past five years in US$ terms (8% in local currency terms). Given the macroeconomic headwinds and the negative headlines, investors may be tempted to cut exposure. For most, we would advise against such a move given today’s low valuations, which clearly price in substantial headwinds already. We acknowledge that for investors that can’t tolerate volatility or the possibility of continued underperformance, cutting exposure may be the only option. For investors with a long time horizon, however, we believe that maintaining an overweight position in emerging markets will pay off in higher returns. Investors that are particularly sensitive to currency volatility or that strongly believe that commodity weakness will continue may prefer tilting to Asian emerging markets, where valuations are nearly as tempting as those of the broad market, and macro risks appear to be somewhat lower. Even these, however, require a long time horizon. In fact, the long time horizon of most institutional investors is a valuable source of comparative advantage. While it can be challenging to maintain in difficult periods, investors have been well served by taking a valuation-based approach to investing and buying in periods when others simply cannot.
Macro Headwinds Galore
Given the many challenges in emerging markets today, long-term investors have many factors tempting them to become short-term investors. While the Federal Reserve in September declined to raise policy rates, most at the Fed still favor an increase this year. Chinese growth is decelerating, yet it has, by one estimate,[1]Please see Diana Choyleva’s “Defusing China’s Debt Bomb,” Lombard Street Research, June 19, 2015. non-financial debt of 240% of GDP. Commodity prices and in some cases demand have come down sharply. Political battles and leadership struggles abound, including in Brazil, Malaysia, and Turkey. And the potential for a dangerous currency war increased last month when China devalued the renminbi.
The problem is, although macroeconomic headwinds and tailwinds can absolutely move markets, investing according to them is often ineffective. Most of the factors discussed above are well known, and it is not always clear the degree to which they are already incorporated into asset prices and currency levels. Valuations data provide more actionable information for investors, but we would advise that investors in these markets at the very least have their eyes wide open about the medium-term risks. To that end, we provide a quick snapshot of conditions in each of the MSCI Emerging Markets Index’s six largest markets, including four Asian markets, Brazil, and South Africa (Figure 1).
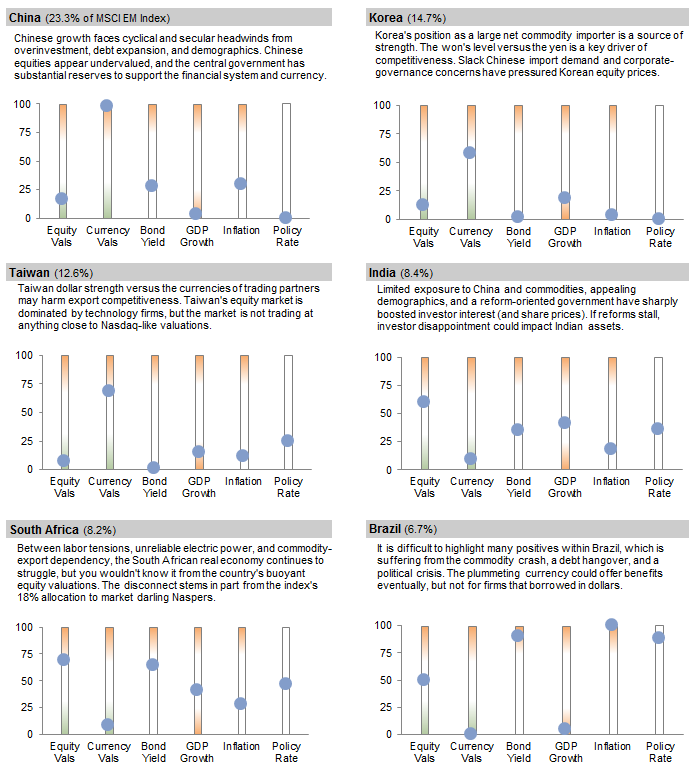
Figure 1. Snapshot of Conditions for the Largest Component Countries of the MSCI Emerging Markets Index
2005–15 • Current Percentile vs Ten-Year Historical
Sources: MSCI Inc. and Thomson Reuters Datastream. MSCI data provided “as is” without any express or implied warranties.
Notes:Equity valuations indicate the market’s current ROE-adjusted P/E ratio versus its post-1995 range. Other metrics compare current levels with the most recent ten years. India CPI data are as of June 30, 2015, for all other countries CPI are as of July 31, 2015.
Clearly, some markets in Asia are in better fiscal and economic shape than those in other regions; however, that comes at the price of even higher China concentration.[2]The allocation to China is about 23% in the broad MSCI Emerging Market Index, 39% in their Emerging Markets Asia Index, and 28% in the All Country Asia ex Japan Index.
Crisis Coming? We Doubt It
While the challenges are significant, we do not believe that conditions today are setting up investors for a 1997–98 emerging markets washout (Figure 2). Current account balances are much improved from 1997, while external debt levels are broadly similar (however, Russian and Brazilian corporate borrowers have significant hard-currency liabilities). And foreign exchange reserves are much higher than they were 20 years ago (though their composition is not always transparent, and some may have limited liquidity—an issue when Chinese reserves dipped by $94 billion in August).
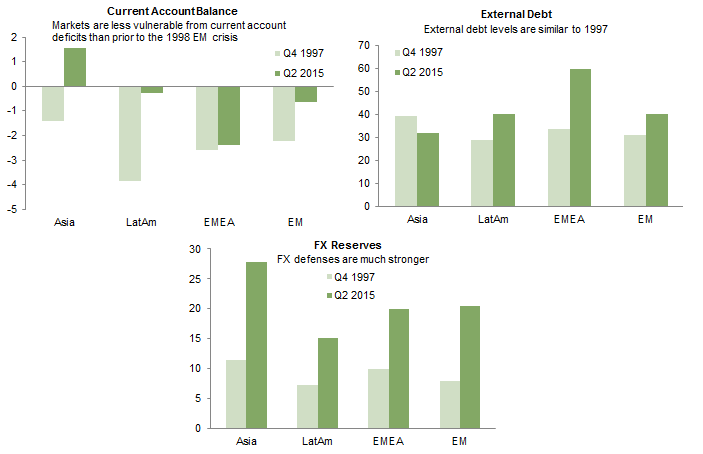
Figure 2. Emerging Markets Macro Indicators
1997–2015 • Percent of GDP (%)
Sources: International Monetary Fund, Oxford Economics, and Thomson Reuters Datastream.
Notes: All data are calculated as the median value for countries in the respective regions. Asia includes China, India, Indonesia, Malaysia, Philippines, South Korea, Taiwan, and Thailand. EMEA includes Czech Republic, Hungary, Poland, Russia, South Africa, and Turkey. Latin America includes Brazil, Chile, Colombia, Mexico, and Peru. Emerging markets includes all of these countries. Q2 2015 figures for Latin America and EM do not include Peru or Colombia.
Valuations Today Echo Prior Crises
Long-time investors in emerging markets equities have likely gotten accustomed to being enmeshed in crisis. In the early 1990s, hyperinflation and currency devaluation wracked Latin America. Emerging markets got hammered (at least briefly) by the Asian financial crisis and Russia’s ruble bond default in 1998. Then, in September 2001, as investors reacted to the 9/11 attacks, valuations plummeted again. They had only partly rebounded by the time the SARS crisis hit Asian share prices. Markets were then relatively steady until 2008, when the global financial crisis walloped all equities, including emerging markets.
Today, valuations are similar to where they stood during the past four crises, at just 11 times normalized composite earnings as of August 31, 2015, compared to a median level of 14.8 times over the past 20 years (Figure 3). And that low valuation appears amid not a crisis, but rather within the confluence of several headwinds, including the potential for Fed tightening, political turmoil in many markets, slowing Chinese growth, and falling commodity prices.
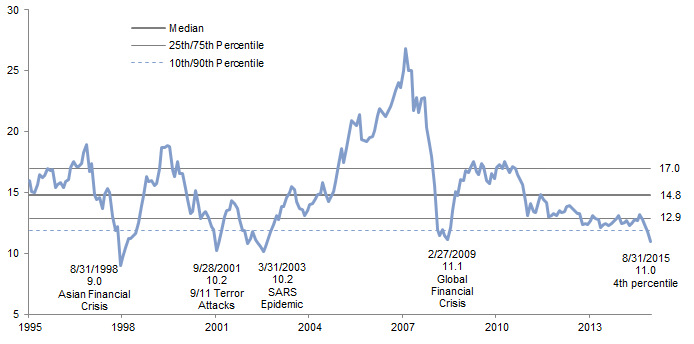
Figure 3. MSCI Emerging Markets Composite Normalized P/E Ratio
September 30, 1995 – August 31, 2015
Sources: MSCI Inc. and Thomson Reuters Datastream. MSCI data provided “as is” without any express or implied warranties.
Notes: The composite normalized price-earnings (P/E) ratio is calculated by dividing the inflation-adjusted index price by the simple average of three normalized earnings metrics: ten-year average real earnings (i.e., Shiller earnings), trend-line earnings (the level of earnings based on a linear regression of real earnings growth), and return on equity (ROE)–adjusted earnings (adjusts current earnings for the ratio of current ROE to long-term average ROE).
Today’s normalized composite P/E ratio is in the 4th percentile of its historical range and is similar to the levels of some of the prior crises just mentioned.
Investors may be wondering whether they will be rewarded for sticking with the asset class, given its clear and present dangers today. After all, the respected analysis firm BCA recently published a 35-page report “The Coming Bloodbath in Emerging Markets.”[3]Marko Papic and Santiago Gomez, “The Coming Bloodbath in Emerging Markets,” BCA Research, August 19, 2015. While the title is hyperbolic, the body of the report argues that emerging markets are “caught in a political, financial, and economic quicksand.” Their arguments are powerful. However, the BCA report also claims that “investors have to eschew valuations as a market selection tool,” and we believe that would be a powerful mistake. Markets rarely get to today’s emerging markets valuation level without seemingly insurmountable challenges. But diversified asset classes typically recover over time, and investors that can stomach the volatility tend to eventually get paid for doing so.
We looked back at prior instances of emerging markets dipping below the 10th valuation percentile and assumed investors held them until they rebounded to the median historical level. In the three such instances in our data history,[4]Recall that the earlier text and chart highlight four crises; however, after the 9/11 attacks, valuations had not yet returned to median by the time SARS hit. Thus, these two crises are viewed as one … Continue reading emerging markets delivered a median absolute return to US$ investors[5]We typically focus in this report on returns experienced by US$ investors rather than on local currency returns, because local currency returns are unachievable, and most investors do not hedge … Continue readingof 49%, and they outperformed developed markets each of the three times. During two of the three crises, valuations returned to median in less than a year, and the other time it took about two and a half years. However, emerging markets data have only been available from 1995 onward, so we added two individual markets—Singapore and Hong Kong—to the mix, because we have data available for these markets and we believe that they might have been included as emerging markets had the term and index been in use prior to 1995. For the dataset we used, returning to the median from valuations in the 10th percentile or below took a median time of 13 months, with the market returning 42% and typically outperforming global developed markets (Figure 4).
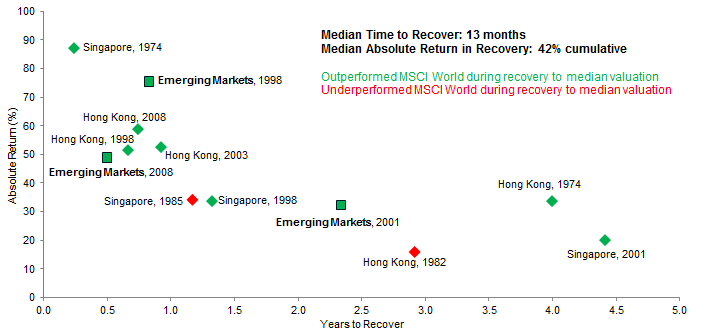
Figure 4. Years to Recover to Fair Value (Median) from a Market Valuation Below the Tenth Percentile
As of August 31, 2015 • US$ Terms
Sources: MSCI Inc. and Thomson Reuters Datastream. MSCI data provided “as is” without any express or implied warranties.
Notes: Performance data are in US dollars and periods longer than one year are annualized. Analysis shown on chart includes three MSCI indexes (Emerging Markets, Hong Kong, and Singapore) with inception dates from 1972 to 1995. In 1974, many other markets (including Australia, Europe, Switzerland, the United Kingdom, and the United States) also went below their tenth percentile of valuations. Recovery periods for these markets (not shown on this chart) were substantially longer, ranging from 11 to 19 years. Singapore and Emerging Markets’ valuations have been below the 10th percentile since October 31, 2008, and July 31, 2015, respectively, but have not recovered to fair value yet and are therefore not included.
While individual markets may fail to recover from crises such as war, hyperinflation, or nationalizing of private entities, we believe that there is a low risk of the broad emerging markets universe failing to recover from today’s skimpy valuations.
Can We Trust the Valuation Signals?
As is always the case when markets come under pressure, investors become concerned about whether valuation metrics truly reflect enhanced opportunity in the asset class. This time is no different. Investors (rightly, if perhaps belatedly) are asking whether distortions such as (1) the drift of country weights in the index over time, (2) the sector tilts of the emerging markets index, or (3) the time period available for our study are causing emerging markets valuations to appear cheaper than they actually are. Let’s examine the concerns one at a time.
Changing country mix. Some investors highlight that the MSCI Emerging Market Index of 2015 is much different than the index of 1995 and question then whether the 20-year history accurately represents the distribution of valuations for today’s mix of countries. It is true that today’s China-heavy MSCI Emerging Markets Index is much different than the country makeup in prior periods. In 1987 for example, close to one-third of the index was devoted to Malaysia, and in 1992, 26% was Mexico. To test this, we looked at the historical valuations of today’s emerging markets equity basket, and compared them to current valuations (Figure 5).
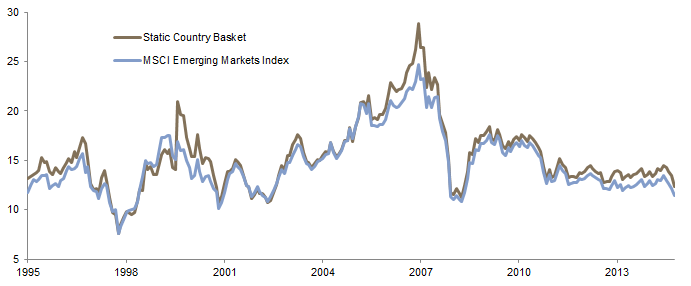
Figure 5. ROE-Adjusted P/E Ratio of MSCI EM Index and of Static EM Country Basket
November 30, 2015 – August 31, 2015
Sources: MSCI Inc. and Thomson Reuters Datastream. MSCI data provided “as is” withough any express or implied warranties.
Notes: The return on equity (ROE)–adjusted price-earnings (P/E) ratio multiplies the current trailing P/E multiple by the ratio of current ROE to historical ROE for each market. The static country basket is capitalization weighted and holds constant the weights of the eight largest EM components as of today back in time. These markets collectively compose 83% of the MSCI Emerging Markets index; because the basket is not identical to the index, the final P/E ratios of the basket and index differ.
The results were similar to our primary approach of valuing the index: current valuations for today’s China-centric basket are in the 14th percentile of historical valuations for that basket, not quite as cheap as the index valuation relative to its history, but certainly close.
Shifting sector tilts. The index’s sector weights have also shifted over time, as companies became publicly listed and as market values of particular sectors rose and fell. Does that distort the historical valuation series? Similar to the prior country-basket exercise, we extended today’s sector basket back over time, and then calculated the weighted price-to-book (P/B) multiple for that sector basket each month back to 1995. The current P/B multiple for that static sector basket is in the 10th percentile of values over the past two decades; clearly the changing sector tilts are not biasing the results in a meaningful way. A few of the smaller sectors are richly valued today, but that is not unusual: during each of the prior three crises enumerated above, at least one sector had above-median valuations.
And do sector weights impact relative valuations for emerging versus developed markets? Some analysts have pointed out that emerging markets indexes are tilted toward sectors that are particularly challenged today, even going so far as to produce sector-adjusted valuations that indicate emerging markets are not particularly cheap relative to developed markets once these sector tilts are neutralized. We believe that this impact accounts for some, but by no means all, of the attractive relative valuations in emerging markets relative to developed markets. Rather than building a sector-neutral index, here we simply compared sector valuations like-for-like for emerging markets versus developed markets. The weighted average emerging markets sector is trading at a 28% discount to developed markets, and most sectors are trading at steeper discounts than they typically have (only utilities, consumer staples, and health care are trading at premium relative valuations versus their history) (Figure 6).
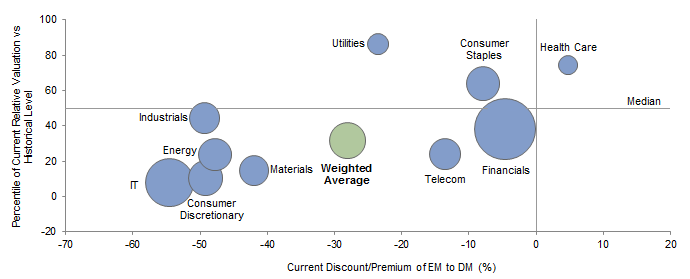
Figure 6. Relative Valuations of EM Sectors vs DM Sectors
September 30, 1995 – August 31, 2015
Source: MSCI Inc. MSCI data provided “as is” without any express or implied warranties.
Note: Size of bubble represents sector weight in EM Index.
Not enough history. Other investors point (correctly) to the slimmer volume of data history underlying our assessment of emerging markets equities, compared to the 45 years of data that we use for most developed markets. This is a valid concern. Valuations for developed markets spent a considerable time at very low levels during the inflationary late 1970s and early 1980s. Our valuation data for emerging markets unfortunately begins only 20 years ago, thus bypassing this period (as well as the hyperinflationary currency crashes in Latin America during the early 1990s). While we would prefer to have a longer history, the two decades that we do have include the four crises mentioned above (the Asian financial crisis, SARS, 9/11, and the global financial crisis). It is possible that, if our valuation series included the 1970s and 1980s, we would not consider current valuation multiples to be in the 4th percentile. But the current level is roughly on a par with the three prior crises over the past two decades.
But What About the Currency Risk?
Investors may find the valuations for emerging markets equities appealing, but they remain concerned that additional currency depreciation seems likely.
Emerging markets and currency risk are inseparably twinned. Many investors are interested in the asset exposure but would prefer not to take on the currency exposure. This reluctance is understandable—emerging markets currencies have generally fallen versus the US dollar and other developed currencies over the past two decades, as the higher inflation of emerging markets has devalued those currencies at a faster rate than developed currencies (sometimes a much faster rate). For developed markets investors, hedging out currency exposure is reasonable and solves the dilemma. For emerging markets investors, however, hedging currency exposure out of equity or bond portfolios is uncommon. The interest rate differentials tend to discourage it (for example, today, the level of reverse “carry” baked into a full hedge of the MSCI Emerging Markets Index currency basket versus the US dollar is about 3% annualized), as do transaction costs.
See Aaron Costello, et al., “Assessing the Likelihood of Another EM Currency Crisis,” Cambridge Associates Research Note, September 2015.
So investors that want the emerging markets assets are generally stuck with the currency exposure as well. While at today’s levels, emerging markets currencies are not particularly richly valued, they remain vulnerable. To the many investors that are reluctant about the currency exposure, we offer two potential considerations: first, consider tilting your emerging markets exposure to Asia, or second, recognize that from current levels of currency and equity valuations, the long-term total return on emerging markets investments could be quite appealing. Over the past 20 years, periods that started out with equity and currency valuations both below average delivered primarily appealing returns over the next five years (Figure 7). In fact, the median five-year annualized return in these periods has been 17% in US$ terms, compared with a median 8% for periods that started out with a cheap currency but above-average equity valuations, and -1% for periods where both valuations were above average.
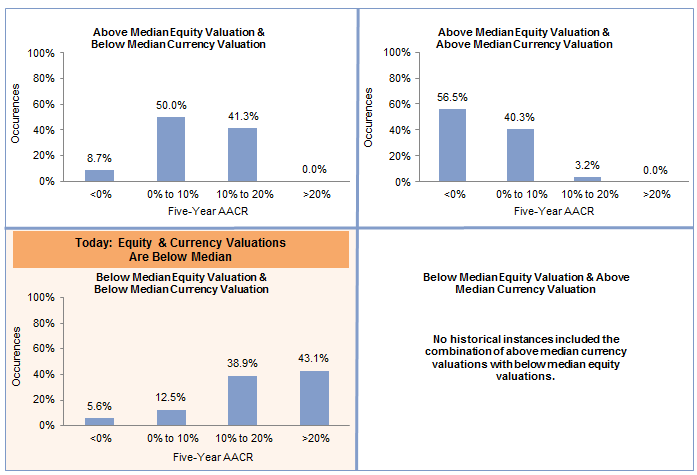
Figure 7. Historical Distribution of Subsequent Five-Year Returns for Emerging Markets Equity Given Initial Valuation Conditions
September 30, 1995 – August 31, 2015 • US$ Terms
Source: MSCI Inc. MSCI data provided “as is” without any express or implied warranties.
Emerging markets currencies today are not yet undervalued (rather, we consider them to be at the low end of the fair value range). Their valuations have improved substantially since April 2011, when the dollar’s current rise versus emerging markets currencies started (Figure 8).
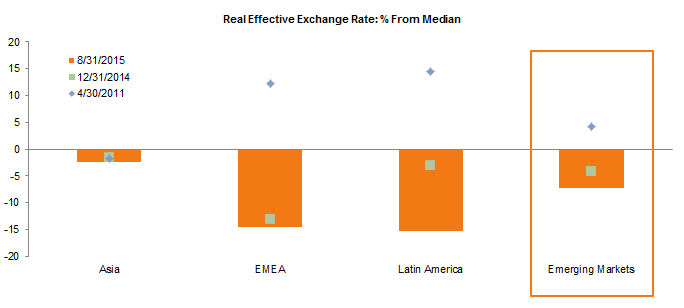
Figure 8. Emerging Markets Currency Valuations
As of August 31, 2015
Sources: Bank for International Settlements and MSCI Inc. MSCI data provided “as is” without any express or implied warranties.
Notes: Real effective exchange rate (REER) is the trade-weighted basket of a country’s currency relative to other currencies, adjusted for relative inflation levels. REER deviations are calculated based on BIS data for the post-1994 period. The Asia and broad emerging markets universes shown do not include the significant Hong Kong dollar exposure that stems from the index’s MSCI China holdings (34.1% and 23.3%, respectively); the HK$ is pegged to the US$.
The chart does not include the index’s sizeable exposure to the Hong Kong dollar (the currency of denomination for the MSCI China index), because it is pegged to the US dollar. But these regional and broad baskets (which are weighted to reflect equity market capitalization) have generally seen real effective exchange rates fall substantially since April 2011, around the time when commodity prices were peaking and the US dollar was beginning its ascent versus emerging markets currencies. The real effective exchange rate (REER) is based on trade-weighted baskets; thus, the weakness in the yen and euro substantially understates the decline versus the US dollar. At least a dozen emerging markets currencies have fallen more than 30% versus the US dollar since April 2011.
Conclusion
Emerging markets are today at a crossroads. Many investors that embraced emerging markets equities are now questioning their decision in the wake of currency volatility, shrinking multiples, and challenged fundamentals. Investors that can afford medium-term pain if it comes with the expectation of long-term profit, on the other hand, should remain overweight these volatile, vulnerable, but very cheap assets.
Sean McLaughlin, Managing Director
David Kautter, Senior Investment Associate
Footnotes