The Federal Reserve is poised to continue lifting interest rates this year, given risks posed by inflation. Many investors tend to view tightening Fed policy as a headwind for emerging markets (EM) equity performance and may be tempted to dial back exposure to the bloc. In this paper, we explore the reasons behind this prevailing market narrative. While there is a basis for thinking higher US rates pressure EM equities, the historical record isn’t consistent. The unclear takeaways from prior episodes imply that the Fed raising rates should not be the only factor investors consider when assessing the outlook for EM stocks; understanding the underlying environment is also key. Given today’s risks, we believe investors should maintain exposure as part of a well-
diversified global equity allocation.
The Case Against EM Stocks When the Fed Is Tightening
Many investors assume tighter US monetary policy will challenge EM equity performance. For one, EM economies tend to have outsized foreign capital exposure relative to developed peers through USD–denominated debt issuance and foreign investment flows. Rising US interest rates can create problems for vulnerable EM economies if investors pull out capital in search of higher yields in relatively safer US assets. EM countries with high debt levels, large foreign exchange exposures, and wide current account deficits are particularly at risk of capital flight. Rising US interest rates tend to be associated with a strengthening US dollar, which further exacerbates these issues as hard currency debt and other foreign exchange obligations become more difficult to service. A stronger US dollar also presents issues for USD-based investors from currency translation effects, particularly given the high costs of hedging EM exposures.
Please see Joe Comras, “Tighter US Monetary Policy May Limit Upside Potential of Risk Assets,” Cambridge Associates LLC, February 2022.
Indeed, EM equities have been inversely correlated with US financial conditions in recent years. Fed hiking cycles tend to tighten broader US financial conditions, which doesn’t bode well for EM shares. Over the past ten years, changes in US financial conditions have explained nearly 80% of the variability in EM equity returns, all else equal. That is a significant and tight relationship (Figure 1).

And this association has strengthened over time, particularly since the late 1990s. Several financial crises roiled EM economies in that decade—including the Mexican (1994), Asian (1997), and Russian (1998) crises—which were in part catalyzed by Fed tightening. Based on the experience during these periods, markets now tend to focus on US financial conditions when evaluating EM equities. It wasn’t always this way, however. The average correlation between EM equities and US financial conditions over rolling five-year periods was just -0.27 from 1993–2007, versus -0.87 from 2008 to today (Figure 2).

History Is Fickle
Performance during prior Fed tightening cycles appears to contradict the expectation that EM equities will underperform. The median inflation-adjusted return in USD terms for EM stocks was 29% cumulative during five tightening cycles since 1987, registering gains in three of those periods. The range of outcomes was wide, with the worst performance at -16% and the best at 148%. Performance outcomes relative to developed markets (DM) shares were split: EM outperformed and underperformed DM during two cycles, respectively, and matched DM in one cycle (Figure 3).

Among regions, Latin America (LatAm) has outperformed broader EM stocks by a median 17%, whereas Asia and emerging Europe, the Middle East & Africa (EMEA) tended to underperform the broader EM index. Historically, commodity prices have risen by a median 23% cumulative when the Fed raised rates, and LatAm equities have been the most reactive to changes in commodity prices among the EM regions. From a market composition standpoint, LatAm and EMEA have had similar weightings to the energy and materials sectors. But net commodity exports tend to be a greater proportion of overall LatAm economic output, which has the added kicker of benefiting consumption growth, public finances, and currency valuations. As net commodity importers, higher commodity prices pose a headwind for EM Asia.
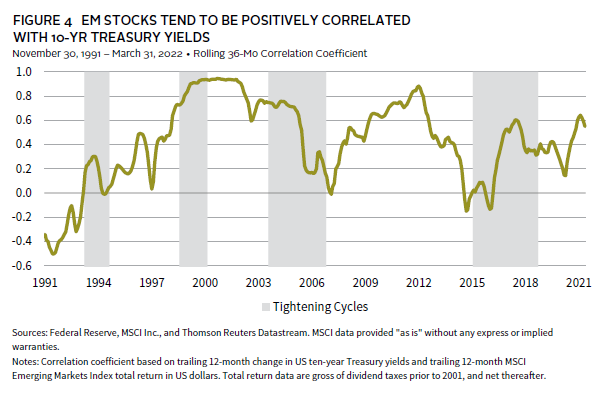
Historically, EM equity performance has been positively correlated with changes in ten-year Treasury yields. This relationship holds during periods when the Fed is lifting rates as well; correlations are in-line with the long-term average since 1991. Remember that the Fed typically raises rates when the economy is strong to avoid economic overheating, and these periods are marked by diminished risk aversion in asset markets. EM stocks are a primary beneficiary of “risk-on” environments as one of the riskier equity segments. In addition, rising US bond yields reflect higher inflation and economic growth expectations. Commodity prices are an important component of inflation expectations, while global trade is bolstered by robust economic growth. Given both are key factors influencing EM equity performance, it stands to reason that rising US bond yields would be a positive for EM stocks more often than not (Figure 4).
Starting USD-EM bond spreads reflect the macro backdrop and may offer some information value as to how EM stocks could perform during tightening cycles. EM equities’ worst performance in both absolute and relative terms came when starting USD-EM bond spreads were more than 700 basis points (bps), which is wider than 90% of historical observations and indicates heightened market stress levels. Starting USD-EM spreads were lower at the start of subsequent cycles when EM delivered superior results.
Comparing Today Versus the Late-1990s
Given the dubious record, investors may be tempted to make comparisons against the most similar historical period. We would caution against this, as looks can be deceiving.
On the surface, the equity market of the late-1990s/early-2000s appears the most like today. EM was in the midst of a multi-year underperformance cycle vis-à-vis DM counterparts and traded at a steep valuation discount. This was, in part, due to elevated US valuations during the “dot-com” period, and US valuations are nearly identical today. Relative return on equity (ROE), a measure of profitability, was another factor influencing the EM valuation discount and underperformance. At that time, DM ROE was almost double that of EM. While the ROE gap is narrower, EM ROE also lags DM today (Figure 5).

But there are key differences between now and then. EM economies appear less prone to balance-of-payments crises, one of the main channels through which economic and foreign exchange exposures can impact equity markets. As shown in Figure 5, EM countries generally have sufficient foreign exchange reserves to cover existing current account deficit and external debt obligations. Average external debt as a percentage of GDP among the ten largest EM equity index countries has fallen to 30% versus 40% 20 years ago. However, foreign exchange reserves as a percent of GDP have more than doubled from 14% to 30% over the same time period. Finally, fixed-rate currency regimes are less prevalent today, which were key features of the Mexican, Asian, and Russian financial crises of the 1990s. These crises broadly coincided with the two Fed tightening periods in that decade when EM equities underperformed. Current tight USD-EM bond spreads reflect these differences in the macro backdrop.
We’d be remiss to not mention China as another primary difference. China dominates the EM index today, commanding roughly one-third of index market cap, but the country made up less than 1% of the index throughout the 1990s. China is also vital from an economic standpoint. The EM index today derives one-third of its revenues from China versus roughly 20% in 2005 (the earliest period for which we have data). From both a market composition and revenue exposure lens, China plays a much more prominent role in driving overall EM outcomes.
Looking Beyond the Fed
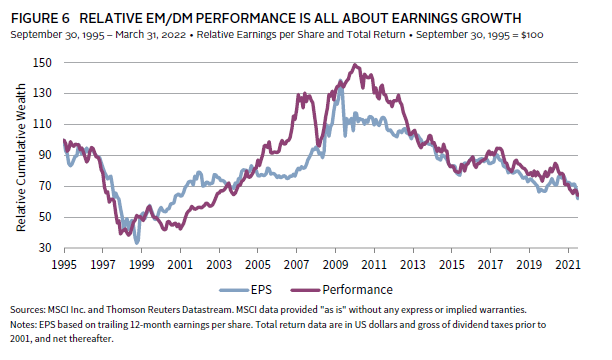
The Fed aside, EM equities face several challenges today. Economic growth in China is slowing, which, as a major revenue source and consumer of raw materials, pressures the outlook for the rest of EM. Recent Chinese regulatory and geopolitical tensions are another important factor worth watching and have arguably increased the risk premium on Chinese shares. Indeed, Chinese equities have underperformed so far this year, declining nearly 14%. The broader EM domestic growth outlook also appears tenuous as central banks expect to continue raising policy rates. Brazil, for example, raised rates by 875 bps over the past 12 months and has seen 2022 GDP growth expectations slashed by nearly 2 percentage points (ppts) over that span. These risks are largely reflected in analyst expectations, where current forward 12-month earnings growth of 10.0% has been lower only 12% of the time since 1987. The anticipated earnings growth spread versus DM is also weak, standing more than 60% below average. Taking a longer view, EM stocks ultimately require superior earnings growth to outperform DM peers (Figure 6).
Still, EM exposures could prove to be diversifying in the current environment. Chinese policy is easing—which stands counter to the global tightening stance—and higher commodity prices have boosted prospects for LatAm and EMEA. Easing Chinese policy typically bolsters credit growth, which in turn supports broader EM economic and earnings growth. And recent weak Chinese equity performance has pushed valuations relative to global peers to all-time lows. This combination of policy easing and undemanding valuations support the case for a Chinese equity rebound, as policy makers have shifted focus to ensuring economic and market stability. Sanctions against Russia, one of the world’s preeminent commodity exporters, have increasingly isolated the country economically. This may yet benefit EM stocks in two ways. First, demand for Russia’s energy, agriculture, and metals commodities is likely to shift to some of the major EM producers in LatAm and EMEA. Second, higher prices would support export revenues, economic growth, and government finances. In fact, EM has outperformed DM by 11%, on average, when commodity prices advanced 20% or more over 12-month periods. LatAm tends to be one of the primary beneficiaries of this dynamic, having already gained more than 27% year-to-date through March 31, outperforming all other major DM and EM regions.
Recent aggressive monetary tightening by EM central banks may ultimately warrant a more sanguine outlook. EM rate setters acted well before the Fed and other major developed central banks to fight inflation. This provides more flexibility to ease policy should the economic outlook deteriorate, particularly if the Fed fails in manufacturing its hoped-for “soft landing” and Chinese growth disappoints. Highlighting this relative maneuverability, real interest rates across major emerging economies are more than five ppts above those in major developed peers. Higher policy interest rates should also support currency valuations as the Fed hikes. This runs counter to the typical historical experience, where EM central banks have had to react to Fed policy to fight potential inflation from a currency depreciation transmission standpoint.
Conclusion
Market history is an inconsistent guide when gauging how EM equities will perform during Fed rate hiking cycles. There are many other factors that influence performance. While EM stocks face several risks today, external macro vulnerability to tightening US financial conditions is relatively less pronounced than in prior periods. We have outlined several reasons EM exposures could prove to be diversifying as the Fed tightening cycle plays out—namely Chinese policy easing and strong commodity prices. Taken together, we believe investors should not be tempted to reduce exposure to EM stocks at this time.
Stuart Brown, Investment Director, Capital Markets Research
Index Disclosures
Goldman Sachs US Financial Conditions Index
The Goldman Sachs US Financial Conditions Index is a weighted average of riskless interest rates, the exchange rate, equity valuations, and credit spreads, with weights that correspond to the direct impact of each variable on GDP.
J.P. Morgan Emerging Markets Bond Index (EMBI) – Global Diversified
The J.P. Morgan EMBI Global Diversified Index is an unmanaged, market capitalization–weighted, and total-return index tracking the traded market for USD-denominated Brady bonds, Eurobonds, traded loans, and local market debt instruments issued by sovereign and quasi-sovereign entities.
MSCI Emerging Markets Index
The MSCI Emerging Markets Index represents a free float–adjusted, market capitalization index that is designed to measure equity market performance of emerging markets. Emerging markets countries include: Argentina, Brazil, Chile, China, Colombia, Czech Republic, Egypt, Greece, Hungary, India, Indonesia, Korea, Malaysia, Mexico, Pakistan, Peru, the Philippines, Poland, Qatar, Saudi Arabia, South Africa, Taiwan, Thailand, Turkey, and the United Arab Emirates. MSCI Russia was removed from the MSCI Emerging Market Index after close on March 9, 2022.
MSCI World Index
The MSCI World Index represents a free float–adjusted, market capitalization–weighted index that is designed to measure the equity market performance of developed markets. It includes 23 developed markets country indexes: Australia, Austria, Belgium, Canada, Denmark, Finland, France, Germany, Hong Kong, Ireland, Israel, Italy, Japan, the Netherlands, New Zealand, Norway, Portugal, Singapore, Spain, Sweden, Switzerland, the United Kingdom, and the United States.