At most foundations, the majority of the long-term portfolio is invested in public equity and PE/VC. On average for the overall peer universe, about 66% of the long-term investment portfolio (LTIP) was allocated across these categories at the end of 2025. While the combined average allocation does not vary much across different asset sizes, there is a stark contrast when looking at the exact breakdown of exposures. Generally, smaller foundations continue to have the highest public equity allocations, while larger foundations have higher private allocations (Figure 21). For foundations less than $100 million, public equities made up 53% of portfolios, on average, while PE/VC accounted for just 15%. The average breakdown was split more evenly across the foundations greater than $1 billion. The largest foundations allocated an average of 34% to public equity and 29% to PE/VC.
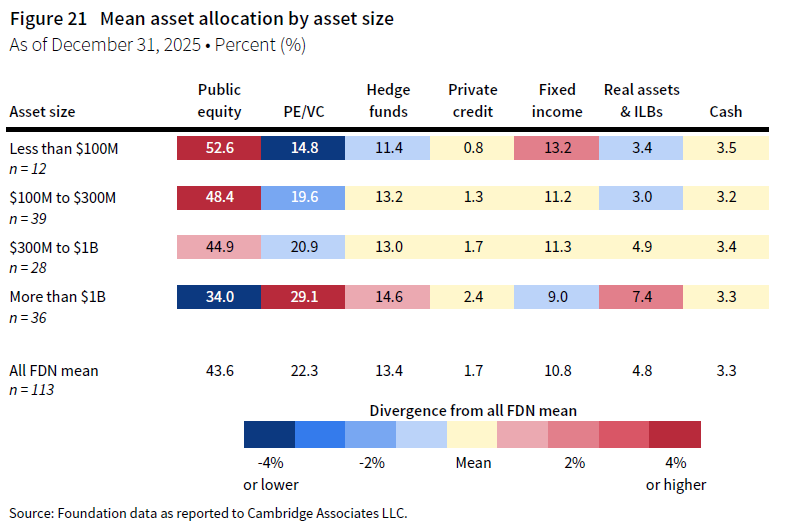
There are also differences elsewhere when comparing asset allocation structures across the asset size groups. Smaller foundations tend to have the highest exposure to bonds, with an average allocation of 13% for foundations less than $100 million. Conversely, the largest foundations allocate more to real assets and inflation-hedging strategies, with an average of 7% invested, compared to 3% for the smallest foundations. The bulk of real assets allocations for larger foundations came from private investment strategies. Hence, the differential in illiquid allocations between large and small foundations is even wider than what is shown in the PE/VC category alone.
Asset allocation trends
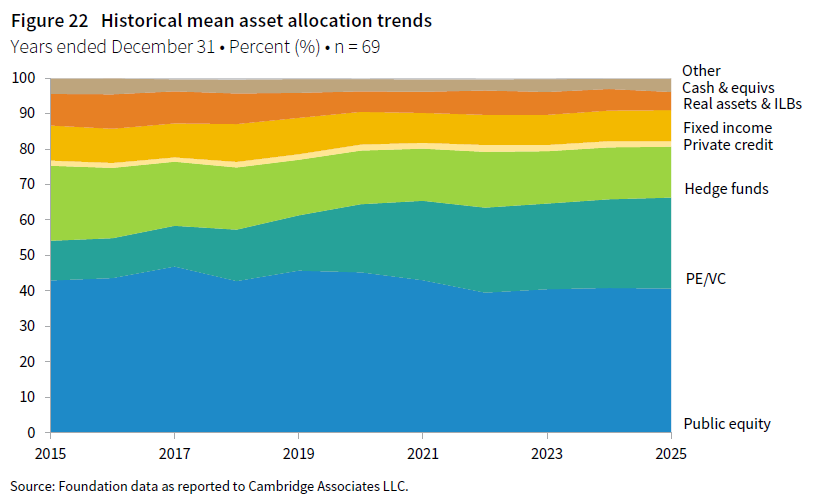
Over the last ten years, the most obvious trend in asset allocations has been the increase in private equity allocations. For a group of 70 foundations that provided data over the past decade, the average PE/VC allocation more than doubled from 11% in 2015 to 26% in 2025 (Figure 22). Most of the other categories in our summary framework saw decreases in allocations over the same period. The largest decline was in hedge funds, which fell from 21% of the average portfolio to 14%. The biggest changes across the allocation framework occurred in the years leading up to 2022. There have been only minor shifts in allocation trends over the last three years.
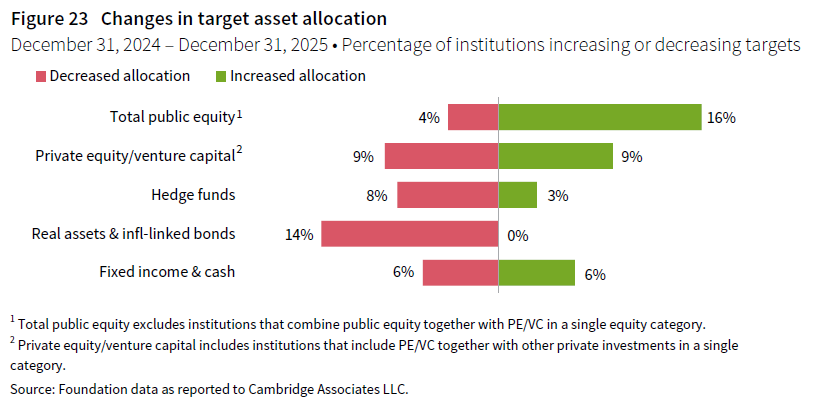
From an asset allocation policy perspective, public equity was the category where foundations were most likely to increase their targets in 2025. Approximately 16% of foundations raised their target allocation to public equity, while just 4% lowered their target (Figure 23). Some interesting trends emerge when it comes to target allocations to PE/VC. The percentage of the universe that reported an increase (9%) was the lowest it has been over the past decade. An equal percentage of respondents reported a decrease to PE/VC, and this figure was the highest seen over the last ten years. These responses indicate that future changes in private allocations could be more muted than what was experienced over the first part of the last decade.
Portfolio liquidity
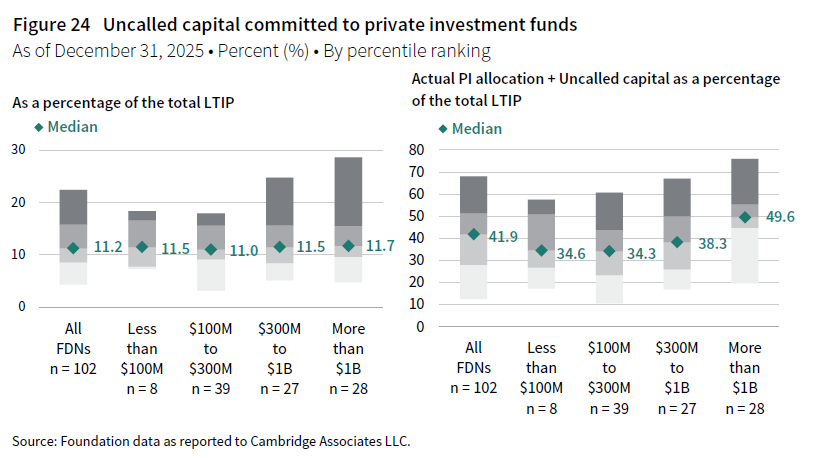
Liquidity management is an important issue that institutional investors need to understand. The biggest liquidity need for foundations has been meeting their annual payout distributions. More than half of respondents (60%) have formal liquidity policies outlined in their investment policy statements or informal guidelines for liquidity considerations. Liquidity policies often include requirements for how much of the portfolio can be converted to cash within a specified number of days. Additionally, liquidity guidelines may establish limits on the percentage of the portfolio that can be invested in assets deemed illiquid. It is not uncommon for foundations to include unfunded commitments in these liquidity measures. Unfunded commitments represent capital that has been committed but not yet paid into private investment funds.
The dollar amount of unfunded commitments is equivalent to more than 10% of the portfolio value at most foundations. The median rate was practically the same across the various asset size groups. However, there are some larger foundations where unfunded capital represents 25% or more of the portfolio’s current asset size. The ratio gets considerably higher when including actual private allocations in the measure. In fact, for foundations greater than $1 billion, the median for this combined version of the ratio was approximately 50% (Figure 24).
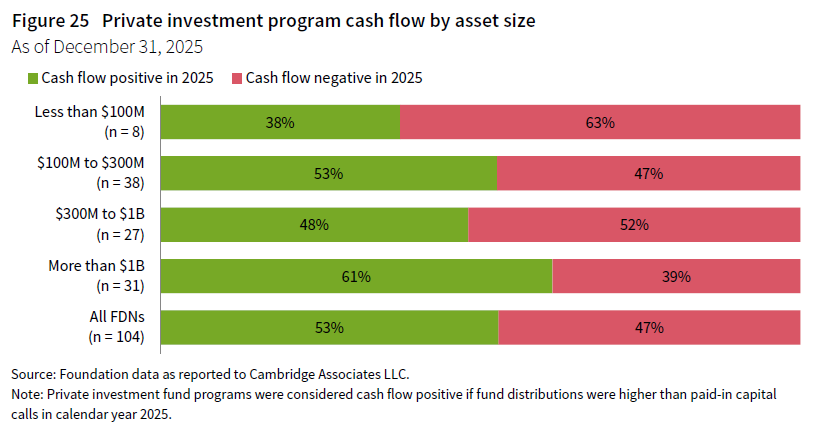
Distributions from existing private investment funds can serve as a source of funding for new capital calls. However, when these distributions fall short, institutions must find additional liquidity to meet new capital calls. This has been an issue that many institutional investors have had to grapple with in recent years. Experiences were somewhat improved in 2025, as slightly more than half of respondents (53%) reported that their private investment programs were cash flow positive (Figure 25). The largest foundations tended to fare best, with 61% reporting cash flow was positive. This makes sense given this group is more likely to have mature private programs, whereas many smaller foundations are in a phase of ramping up private allocations.
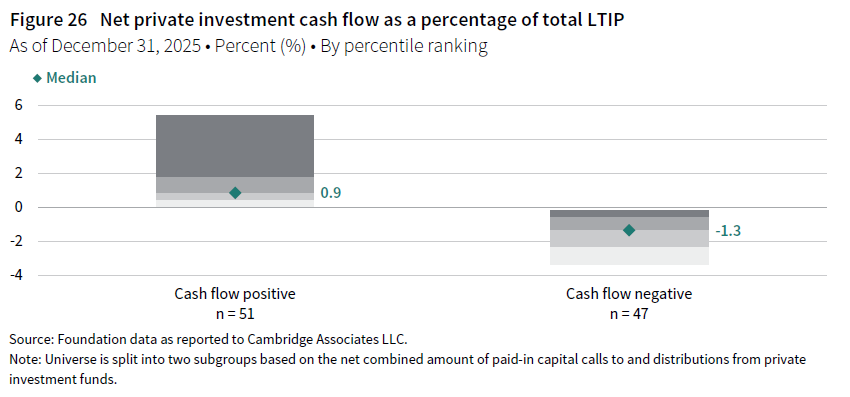
The net private investment cash flow is the amount left over after paid-in capital calls are subtracted from fund distributions. This net amount was equivalent to a relatively small percentage of the total portfolio value at most foundation (Figure 26). For most respondents, this net amount fell within a range of approximately +/- 1% of the total portfolio value in 2025. However, there was still a notable proportion of the peer group that reported negative cash flow ratios of -2% or lower. This underscores the importance of establishing appropriate liquidity management guidelines and strategies, particularly when it comes to tracking and monitoring the illiquid bucket of the portfolio.
Portfolio implementation
Institutions primarily use external investment managers to implement their portfolio allocations. The number of managers employed is largely influenced by the scale of total assets under management. Larger foundations, which have more capital to deploy, naturally maintain more manager relationships compared to smaller portfolios. In addition, allocations to private managers are typically less concentrated than manager allocations in public asset classes, leading to a greater number of manager relationships for portfolios where private allocations are higher. The median number of managers used by foundations greater than $1 billion was 97 at the end of 2025. In contrast, the median was 18 managers for the subgroup of respondents with assets less than $100 million. Further data on the number of managers used for specific asset classes can be found in the Appendix section of this study.
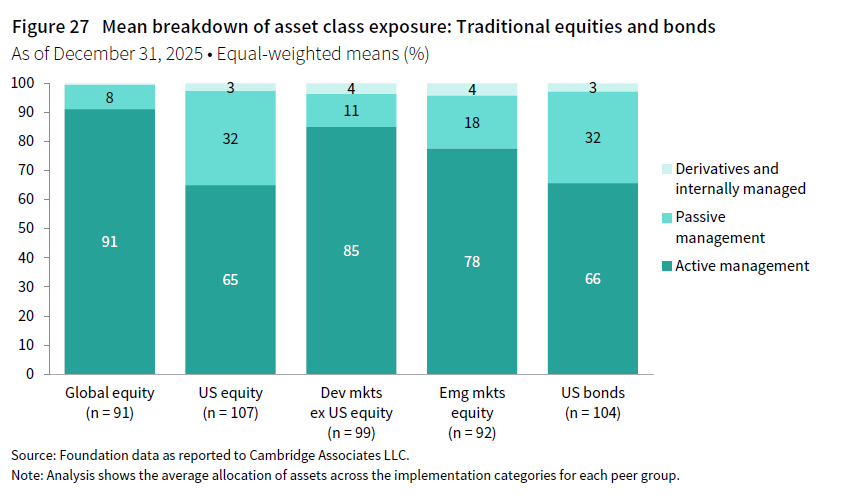
The overwhelming majority of allocations to public asset classes are invested via external managers, while just a small percentage of these strategies are internally managed. Most external allocations are implemented through actively managed funds and strategies, and this experience is mostly consistent across different asset sizes. However, US equity and bonds are two asset classes where passive management has gained more traction in recent years. On average, 32% of allocations for these categories were managed through passive vehicles in 2025 (Figure 27).
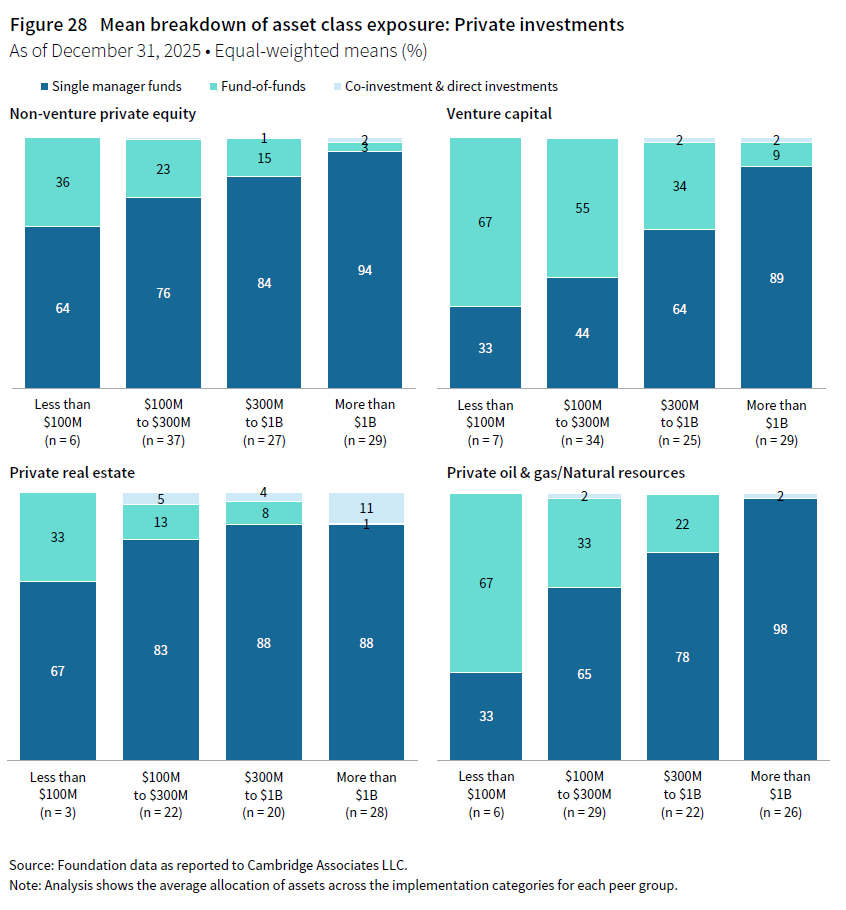
In private investments, institutions also implement most of their allocations through external managers (Figure 28). However, there is more variability in the types of funds used based on the portfolio’s asset size. Smaller institutions tend to rely more on fund-of-funds compared to larger peers, particularly in venture capital and private natural resources. For foundations with assets less than $100 million, fund-of-funds make up the majority of the average allocation to these strategies. In contrast, fund-of-funds represent a much smaller percentage of the average allocations for foundations with assets greater than $1 billion.
Return to the Foundation Annual Investment Pool Returns: Calendar Year 2025 landing page to read other sections of this report.
Notes on the Data
The notation of n denotes the number of institutions included in each analysis.
Returns for periods greater than one-year are annualized.
The simple portfolio benchmark consisting of 70% MSCI ACWI/30% Bloomberg Aggregate Bond Index is calculated assuming rebalancing occurs on the final day of each quarter.
The MSCI indexes contained in this report are net of dividend taxes for global ex US securities unless otherwise noted.
Private indexes are pooled horizon IRRs, net of fees, expenses, and carried interest.
Hedge Fund Research data are preliminary for the preceding five months.
Profile of respondents
This report includes data for 115 foundations. The breakdown is as follows: 95 private nonoperating foundations, five private operating foundations, and 15 community foundations. All participants provided investment pool return and asset allocation data as of December 31, 2025.
The 115 participants in this study reported long-term investment portfolio (LTIP) assets as of December 31, 2025, totaling $255 billion. The mean LTIP size was $2.2 billion, and the median was $422.1 million.
12 participants have an LTIP size less than $100 million, while 36 have an asset size greater than $1 billion. The remaining 67 participants have an LTIP size between $100 million and $1 billion. The participants with LTIP sizes greater than $1 billion controlled 91% of the aggregate LTIP assets.
Modified public market equivalent indexes
Under Cambridge Associates’ modified public market equivalent (mPME) methodology, the public index’s shares are purchased and sold according to the private fund cash flow schedule, with distributions calculated in the same proportion as the private fund and mPME NAV is a function of mPME cash flows. The mPME analysis evaluates what return would have been earned had the dollars invested in private investments been invested in the public market instead.