Top-Performing Endowments in Fiscal Year 2024 Were Led by Public Equities
Public equities dominated the capital return environment in fiscal year 2024 (Figure 1). The global equity market as represented by the MSCI All Country World Index (ACWI) returned nearly 20%. The US stock market was the standout among the broad geographic regions, with the Russell 3000® Index returning 23%. Performance in global ex US regions was not quite as robust, but still landed in the double digits. Bond returns were more subdued, with the Bloomberg Aggregate Bond Index yielding less than 3%. Still, the strong performance from equities led a simple portfolio weighted 70% in global equities and 30% in US bonds to a healthy 14% return for the year.

Alternative asset classes did not keep pace with the performance of the simple index for the fiscal year. While indexes representing long/short hedge funds and public natural resource equities delivered double-digit returns, they still fell short of the 70/30 portfolio’s performance. Private investments lagged farther behind, with the CA Private Equity Indexes and the CA Venture Capital Indexes significantly underperforming a passive investment in the public stock market. Similarly, private real assets strategies trailed the modified public market equivalent (mPME) versions of their benchmarks for the fiscal year.
In this market environment, endowments that diversified into alternative assets struggled to match the performance of the simple 70/30 portfolio. Most institutions in the CA C&U universe maintain high allocations to alternative assets, with the private investment portion representing one-third of the entire portfolio for the average endowment. The substantial allocations to private investments across this universe and the weaker performance from these strategies in 2024 are the main reasons that that median fiscal year peer return underperformed the simple benchmark by more than 400 basis points (bps). In fact, only seven out of the 159 participating endowments in this study outperformed the mark in 2024 (Figure 2).

The median return for the C&U universe landed at 10.1% for the fiscal year. The dispersion in returns from top to bottom peer performance was not as wide as in recent years, but there were still noticeable differentials when comparing returns across subgroups based on portfolio asset sizes. The cohorts of smaller endowments had higher median returns compared to endowments greater than $1 billion, and the overall range of returns tended to scale higher for smaller endowments as well. Asset allocation structures played a key role in this dynamic as the largest portfolios—which were early adopters of private investments decades ago—continued to report private allocations in 2024 that were considerably higher than their smaller counterparts.
Our heat map analysis illustrates the effect of different asset allocation structure on returns of the overall peer universe (Figure 3). Top quartile performers in 2024 had half of their portfolios invested in public equities, nearly double the exposure of the bottom quartile of performers. The opposite was true when it came to private investment allocations. The average private investment allocation for top performers at 22% was just more than half of what the average was for the bottom quartile.
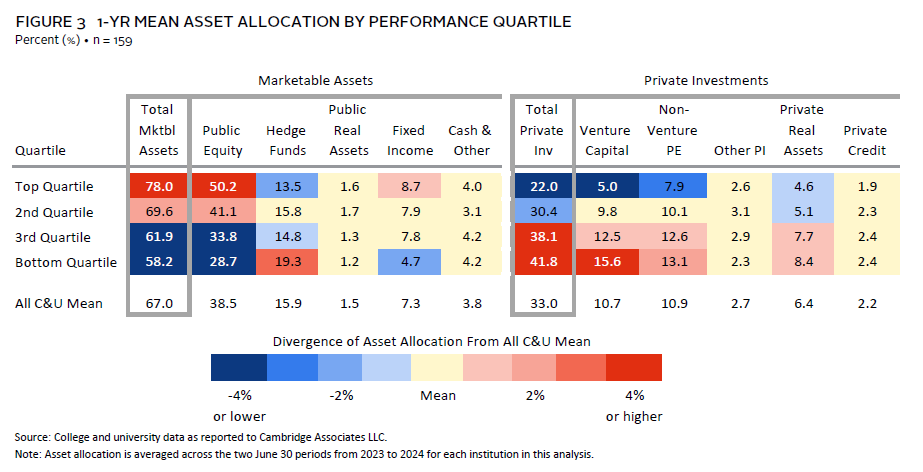
Venture capital allocations stood out most among the individual private strategies. The bottom performance quartile had more than 15% of their portfolios invested in venture capital, on average. For top performers, the average was just 5%. Results were similar for non-venture private equity and private real assets strategies, although the magnitude of differentials across the performance quartiles was smaller than what was reported in venture capital. This contrast in allocations between top and bottom performers ties back to the underperformance of private investments versus public markets over the past year.
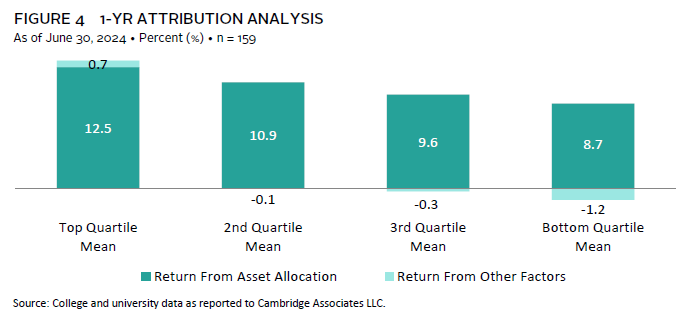
Our attribution analysis confirms that differences in asset allocation structures were the primary factor driving the dispersion in peer returns in fiscal year 2024 (Figure 4). On average, top performers earned nearly 400 bps more than bottom performers due to asset allocation. Other factors such as portfolio implementation played a smaller—but still meaningful—role in the variation in returns. Our model estimates that the top quartile added an average of 70 bps to their return through implementation, whereas it detracted from the total portfolio return for most of the bottom quartile of performers.
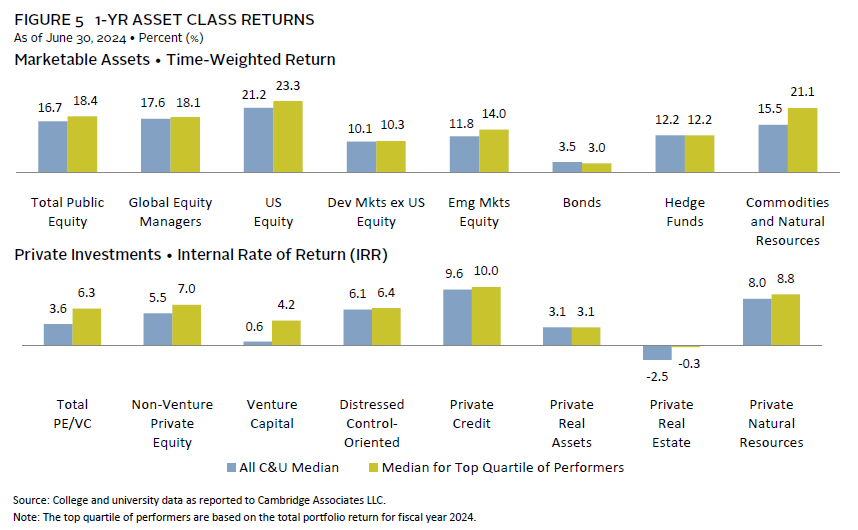
Data on asset class returns support the notion that top performers stood out from the rest of the universe with regard to implementation in 2024 (Figure 5). The median asset class return for the top quartile of performers (based on total return) surpassed the overall C&U median across nearly all strategies. Most notable was the extent of outperformance within equity categories. At the total public equity composite level, the median return for top performers was 170 bps higher than the median for the full universe. This significance is magnified by the fact that half of the average portfolio for top performers was invested in public equities.
Underperformance for Diversified Portfolios Has Now Spanned Consecutive Years
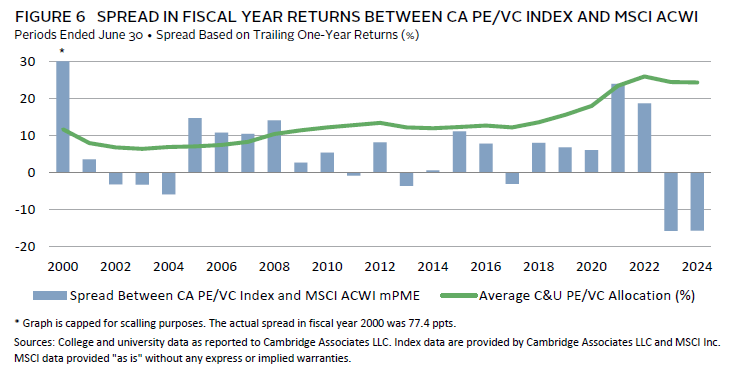
In recent years, the performance gap between private equity and public equity has fluctuated significantly. The return environment in 2024 mirrored the previous fiscal year, with the global public equity market outperforming alternative asset classes and strategies. The CA Private Equity and Venture Capital Index has underperformed the mPME version of the MSCI ACWI by more than 1,500 bps in each of the last two years (Figure 6). These have been by far the largest margins of underperformance for the private benchmark over the last 25 years. The performance story was the opposite in fiscal years 2021 and 2022 when extraordinary outperformance by private investments was the key theme.
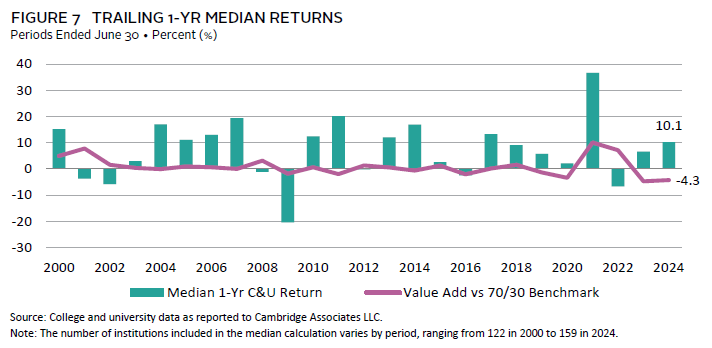
The divergence in private equity and public equity performance has occurred during a period where private investment allocations among C&Us have reached an all-time high. Consequently, the spread between diversified portfolios and the simple 70/30 benchmark has also reached historically high levels (Figure 7). The C&U median return was 430 bps lower than the benchmark in 2024, which was just slightly better from a comparative standpoint than the outcome of the year before. Conversely, in 2021 and 2022, endowments’ outperformance of the simple benchmark was among the largest margins recorded over this past generation.
The banner year of 2021 left a lasting impact on endowments’ multiyear performance track records both in absolute terms and relative to the simple benchmark. However, the 2021 results dropped out of the calculation for the most recent three-year period and this statistic has slumped dramatically compared to recent history. The median three-year C&U return of 3.0% as of June 30, 2024, was the lowest reported since the early 2010s, when trailing returns were still being weighed down by the depths of the Global Financial Crisis.
Similarly, the median peer return has slumped versus the 70/30 index as this year’s results replace 2021 in the rolling calculation. The median return underperformed the simple benchmark by 10 bps for the most recent three-year period. This was the first time since 2020 that the median return fell below the benchmark. Looking forward to next year, the three-year period will again contain at least two years of private investment underperformance (2023 and 2024), making it likely that the median falls short of the simple benchmark again.

Private Investments Continue to Drive Long-Term Performance
The outperformance of public equity versus private equity has been the primary theme of comparative return analysis from the last two fiscal years. However, the opposite has been true looking back over a longer period of history (Figure 9). Although public US equities did have stellar investment returns over the past decade, PE/VC performed even better. The mPME version of the Russell 3000® Index earned a little more than 12% on an annualized basis over the last ten years, while the US versions of the CA PE/VC indexes both posted internal rates of return (IRRs) of approximately 15%. Returns were much lower for public equities outside of the United States in US dollar terms. When those non-US regions are factored in, the performance gaps between the MSCI ACWI and the CA global versions of the private indexes were even wider than the US benchmark comparisons.
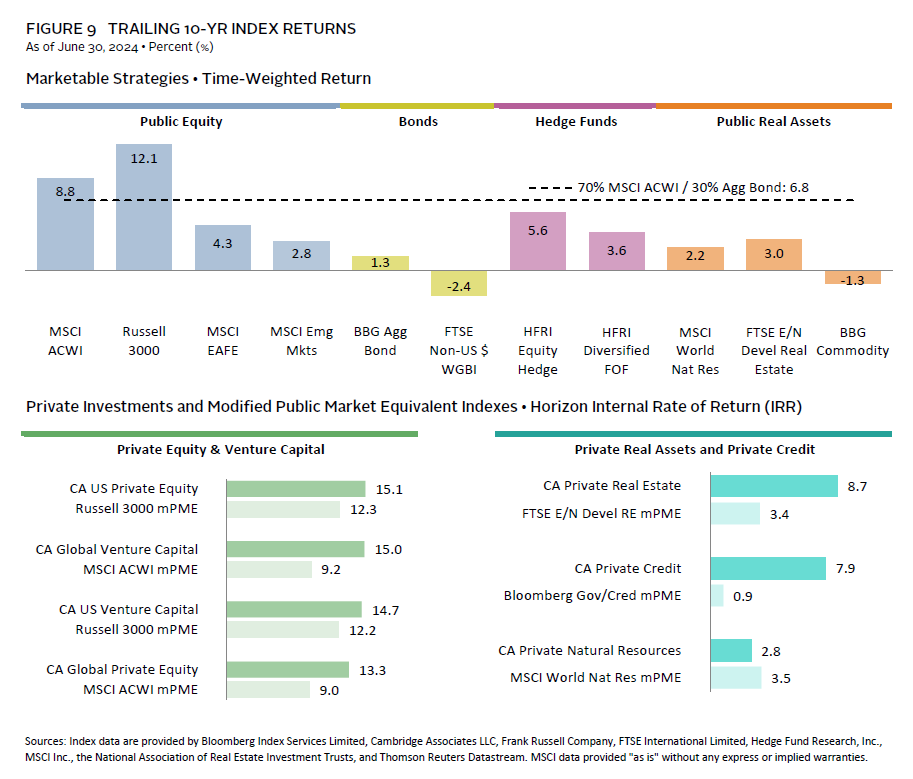
Meanwhile, the past decade has been a dismal return environment for bonds. The US investment-grade bond market, represented by the Bloomberg Aggregate Bond Index, returned just 1% per annum over the past decade. Absolute return hedge fund strategies offered slightly more enhanced returns, while the CA Private Credit Index stood out with an 8% annualized IRR.
Elsewhere, the inflation spike from a couple of years ago provided a short-term boon to inflation-hedging strategies. However, most of the past decade was not a conducive environment for strong returns from natural resources–related investments and commodities. In real estate, the CA Private Real Estate Index produced an annualized IRR just shy of 9% for the decade, but public markets were muted.
The median endowment return over the trailing ten-year period was 7.2%, which was 40 bps higher than the return of the 70/30 blended index (Figure 10). Notably, two-thirds of participating endowments (99 out of 151) outperformed the blended index. Splitting the universe into various asset size cohorts shows that larger endowments tended to fare better versus the simple benchmark than smaller portfolios. The median return for endowments greater than $3 billion was 7.8%, while the median for those less than $200 million was just 6.4%.
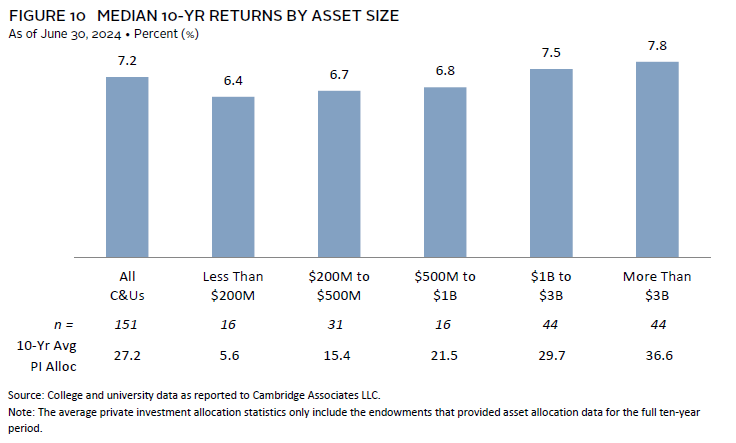
Asset allocation helps explain the return differentials across the asset size cohorts. Endowments with the best returns over the past decade had the highest allocations to the best-performing strategies across this period, namely private investments. When considering the average private investments allocation across the full ten-year period, these assets accounted for more than one-third of the average portfolio for the endowments greater than $3 billion, which was a key reason that most large endowments were able to outperform the passive portfolio option of the 70/30 benchmark. Private allocations were smaller when stepping down the asset size scale; the average for endowments less than $200 million was just slightly above 5%.
The relationship between private investment allocations and longer-term endowment performance has persisted for many years. Using July 1, 2000, as a starting point, there are 15 rolling ten-year periods that we can analyze using our historical fiscal year survey data (Figure 11). In every one of those rolling periods, the average private investment allocation for top-performing endowments exceeded the average for the other endowments in the peer universe. The closest differential in allocations was for the ten-year period ending in 2018, when the average for top quartile of performers was approximately 6 percentage points (ppts) higher than the average for the rest of the universe. For all other years, the differential was in double-digit ppts.
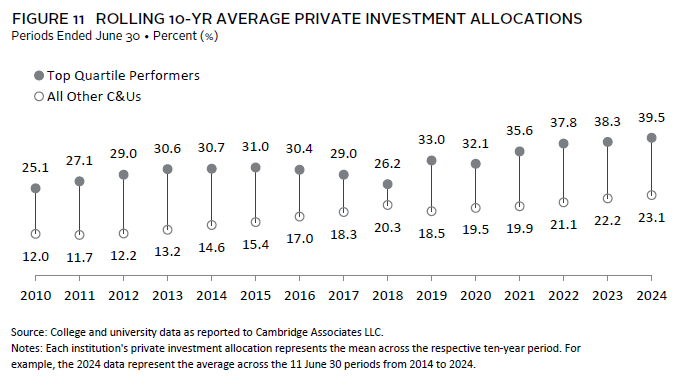
This historical period captures multiple market cycles and includes some individual fiscal years where private markets did not match up with public markets in terms of performance. But in more years than not, the PE/VC indexes posted returns that were higher than what could have been earned by investing in the public markets instead. The top performers in our C&U universe have been successful in tapping into the enhanced return potential of investing in private markets. And even with the last two years—where public equity performance has far exceeded private investment returns—it has not been enough to offset the comparative performance advantage that private markets offered in 2021–22. It would take a few more years of public markets continuing to top private markets in the return comparisons to reverse the trend in Figure 11.