Endowment Dependence
The endowment plays an important funding role at most C&Us. Institutions depend on endowment distributions to supplement operating revenues, since tuition, gifts, patient revenue, auxiliary, and research revenue do not fund all their costs. The endowment support–to-operating budget ratio measures an institution’s dependence on endowment funding (Figure 27). The median endowment dependence for private colleges and universities was 17.0% in fiscal year 2024, although experiences vary widely across peers. Some private institutions rely on the endowment to cover as much as half or more of annual operating expenses. For others, endowment support represents just a tiny fraction over the overall budget.

In addition to student and research revenue, public institutions receive financial support from state appropriations, and, as a result, endowment distribution generally funds less of the operating budget compared to private institutions. For the public institutions, the median endowment dependence was just 3.4% in fiscal year 2024. The range of data reported by public universities was much more concentrated compared to the private cohort. There was not a single public university respondent that reported an endowment dependence ratio greater than 9%.
Effective Spending Rates
The annual effective spending rate tells us how much of the endowment was drawn on to deliver support from the endowment to the operating budget. Some universities also have recurring administrative expenses or other special assessments that also get funded by endowment spending. The effective spending rate is calculated as the total annual spending distribution as a percentage of the beginning market value of the LTIP. The median effective spending rate in fiscal year 2024 was 4.6% (Figure 28).

The median spending rate in 2024 was a slight increase from the previous fiscal year and significantly higher than the median from 2022. Deconstructing the effective spending rate formula gives us deeper insights into this trend. When the growth rate in spending outpaces the growth rate in the asset base of the portfolio, the effective spending rate increases, which is exactly what has occurred over the last three years for almost every endowment in this universe. From 2022 to 2024, the median change in spending was a cumulative increase of 19%. On the other hand, the median portfolio size (beginning year value) has actually declined by 4% over the same period.
Why has the growth in spending exceeded the growth in portfolio values in recent years? The answer lies mainly in the dynamics of the market value–based spending rule, which is used by the majority (70%) of our study’s participants. The market value–based rule calls for spending a percentage of the endowment’s average market value from a smoothing period that typically spans across multiple years. By incorporating a smoothing period, this delays the timing of when the full effect of changes in endowment values is felt on annual spending. The market values at the beginning of fiscal year 2022 were supercharged by record high returns in 2021 and have continued to factor into the smoothing periods of the last couple of years. As those historical values cycle out of smoothing periods, there will likely be more muted annual growth rates in spending dollars.
Administrative Fees
In addition to supporting the annual operating budget, some institutions may assess a fee on the endowment and other assets under management that goes beyond the spending policy distribution. The assessment, known as an administrative fee, covers internal investment management costs and, in many instances, can also pay for fundraising expenses. In the case of a separate management company or affiliated foundation, the administrative fee funds the cost of operating that organization. Of the 40 institutions that reported an administrative fee in 2024, 34 were public universities or affiliated foundations and six were private universities (Figure 29).
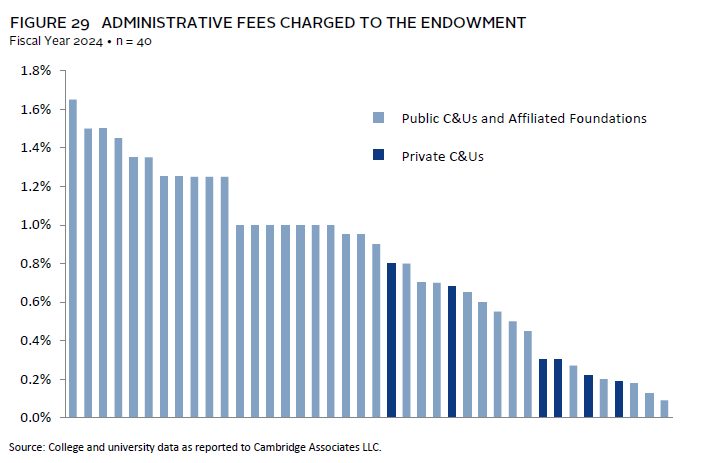
The wide range of fees reported among respondents can be attributed to the level of services provided as well as the amount of assets under management. In instances where the fee covers both internal investment management costs and fundraising expenses, the rate will be higher compared to other instances where the fee solely covers investment costs. When it comes to comparing similar organizations like affiliated foundations, our data show that larger asset pools tend to charge lower fees than smaller asset pools. While the median fee for public universities and affiliated foundations was 1.0%, the actual rates ranged from 0.1% on the low end to 1.65% on the high end. The median administrative fee for the six private universities that provided data was 0.3% and ranged from 0.19% to 0.8%.
Real Returns After Spending
To maintain the purchasing power of each endowed gift entrusted to the institution, investment performance must keep pace with total spending and inflation over the long term. Spending plus inflation is the return hurdle because investment performance needs to replenish spending dollars and meet the increasing cost of delivering the program, position, or scholarship that the endowment is committed to funding in perpetuity.
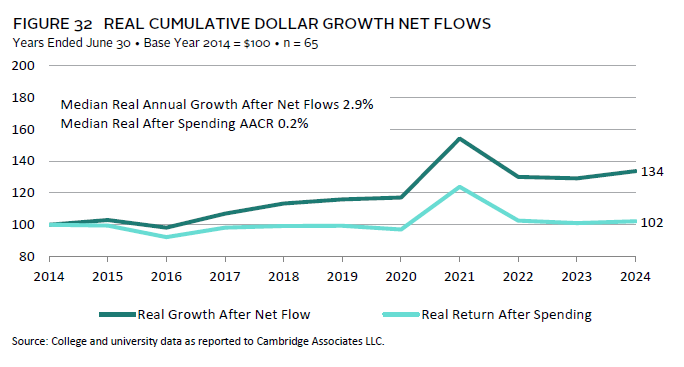
The median return after spending and inflation was 0.2% for the trailing ten-year period (Figure 30). This means that most endowed funds have seen at least modest growth in their purchasing power over the past decade, even despite the high inflation from recent years. Looking at annualized figures, the median endowment delivered a 7.9% nominal return, which slightly outpaced the combination of the inflation rate of 2.8% and spending rate of 4.7%. In real (inflation-adjusted) terms, a fund starting at $100 in 2014 would have increased to $102 in 2024 if it grew at the median after spending rate.

Net Flow Rate
Institutions often expand programs and facilities so that budgets grow at a faster rate than inflation, thus necessitating additional growth to maintain the endowment portfolio’s role in the enterprise. In addition to maintaining purchasing power, many institutions seek to augment their growing enterprises with new funds. Endowed gifts and transfers to a board-designated endowment increase the value and purchasing power of the endowment portfolio by adding additional funds to spend from.
The combination of the total outflows (spending and other appropriations) and inflows (gifts and other additions) for the portfolio constitutes the net flow rate (Figure 31). Like the effective spending rate, the net flow rate is calculated as a percentage of the LTIP market value at the beginning of the fiscal year. Net flow can lend insight into the liquidity needs of the portfolio. As is typically the case, the average net flow rate among participants was negative (-2.4%) in fiscal year 2024, meaning the amount of withdrawals from the portfolio surpassed the amount of additions for most respondents. The average outflow rate was -4.8%, while the average inflow rate was 2.4%.
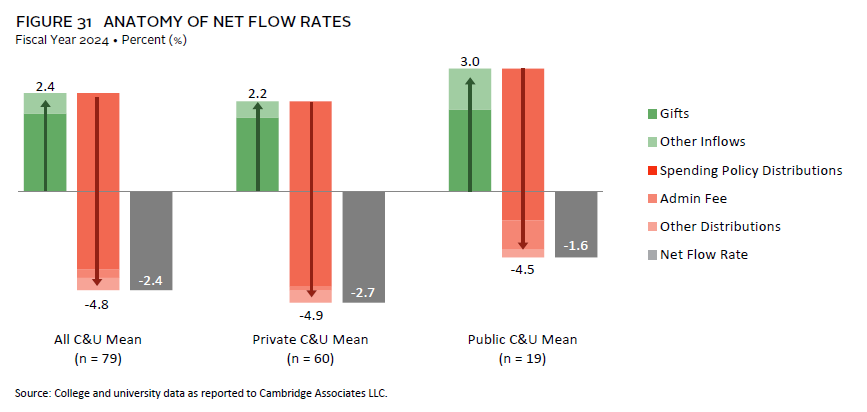
Public colleges and universities had a higher average net flow rate in fiscal year 2024 compared to private institutions. This was mostly attributable to the higher average inflow rate for public institutions (3.0% versus 2.2%). Despite administrative fee withdrawals for many public institutions, on average the cohort had a slightly lower average outflow rate (-4.5% versus -4.9%) compared to private institutions.
Based on the median real return after spending of 0.2%, an existing endowed gift would have grown its purchasing power slightly compared to ten years ago. However, once the inclusion of gifts and other inflows are considered, the growth of the overall endowment portfolio is substantially greater. The median real annual growth after net flows was 2.9% on an annualized based over the past decade. Translated to cumulative terms, an endowment portfolio’s growth after net flows would have been about one-third higher than it would have been based on performance after spending alone ($134 versus $102). Evaluating the net flow rate along with traditional investment performance metrics illustrates how endowment portfolios have expanded their roles in funding the enterprise (Figure 32).
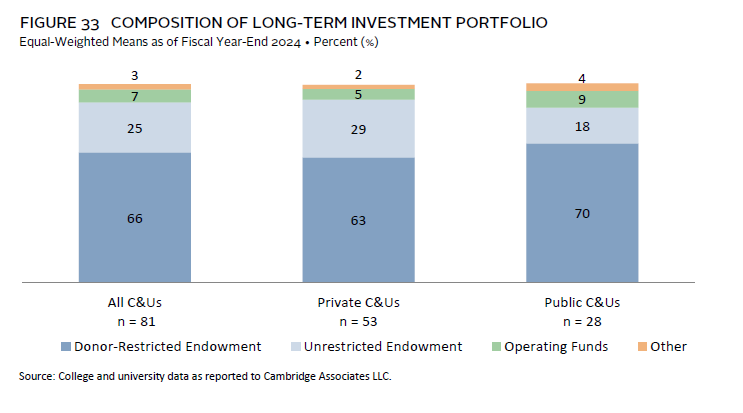
Asset Composition
While the terms “long-term investment pool” and “endowment” are often used interchangeably, they are not synonymous. Understanding the types of assets that come together in the LTIP is important to understanding the portfolio’s role and investment profile. The LTIP is the group of assets for which institutions report their asset allocation and returns in this study. Endowment assets consist of all or the vast majority of the LTIP for most respondents. On average, 91% of the LTIP were endowment assets as of June 30, 2024. The endowment portion can further be broken down into donor-restricted (66%) and unrestricted (25%).
In addition to endowment assets, many institutions invest a portion of their operating funds and/or other assets in the LTIP (Figure 33). On average, operating funds accounted for 7% of the LTIP and other assets were 3%. Examples of other assets in the LTIP include life income and annuity funds, special purpose funds, and assets invested by external organizations. Public institutions tend to have a slightly higher proportion of donor-restricted funds in their LTIP compared to private institutions.