Japan’s long-term economic outlook has improved, and the positive structural and governance changes have expanded the opportunity set for long-term institutional equity investors, but notable risks remain
- Japan’s economy continues to face serious structural challenges, but the reforms implemented under “Abenomics” over the past five years have begun mitigating some of these longstanding issues, although more time and change is needed for the policy program to achieve ultimate success.
- Japanese corporate fundamentals have meaningfully improved, thanks in part to successful corporate governance reforms, and Japanese equity valuations remain undemanding, making Japan a more attractive investment destination for long-term institutional investors.
- Despite a more promising outlook, several ongoing internal and external risks to the reform agenda and economic outlook require monitoring, including a domestic political scandal that has hurt Abe’s re-election prospects, China’s economic rebalancing, and shifting geopolitical dynamics within the Asia Pacific region.
Introduction
More than five years have passed since Prime Minister Shinzo Abe returned to office in late 2012 and launched his ambitious reform program, known colloquially as “Abenomics.” His long tenure in office and strong leadership followed a particularly tumultuous period in Japan’s political history colored by six different prime ministers in six years during the time leading up to and through the global financial crisis and its near-term aftermath. Abe’s reemergence arguably came at a time of great desperation for Japan, allowing him to introduce highly experimental economic policies and substantial reforms in an attempt to overcome Japan’s longstanding challenges. The “Teflon Prime Minister,” the local moniker Abe earned for his political survival skills, is now gearing up to run for an unprecedented third term as president of his Liberal Democratic Party (LDP), which, if successful, could make him the longest-serving and most consequential leader in Japan’s post-war history. The recent diamond anniversary of Abenomics, taking place in an historic election year, is an opportune time to evaluate progress to date and implications for investors. Though the government has made missteps, and many risks remain, Japan’s long-term economic outlook looks brighter, and the positive structural and governance changes achieved under Abe have improved the opportunity set for long-term institutional equity investors. This progress—paired with improving corporate fundamentals and reasonable valuations—boosts the appeal of Japanese equities for those who can understand and get comfortable with the risks.
Japan’s “Three D’s” and Abe’s “Three Arrows”
Shortly after Shinzo Abe began his second stint as Japan’s prime minister in 2012, he launched his Abenomics policy prescriptions, with their daunting aim of reflating Japan’s economy out of its apparent debt-deflation trap and overcoming its significant demographic challenges.[1]Japan’s population peaked at 128 million in 2010, and the Ministry of Labor projects it will fall 9% from that peak level by 2030. Japan also has the world’s oldest population, with approximately … Continue reading While Japan’s struggles with the “Three D’s”—debt, deflation, and demographics—are all well-documented, the conventional wisdom regarding the debt situation may overstate the associated risks. Although Japan’s current 240% gross debt/GDP is the highest in the world, both the government and the Bank of Japan (BOJ) own substantial domestic assets, and when these are netted out, Japan’s consolidated net debt/GDP ratio falls below 50%, which actually compares favorably to the United States and the Eurozone (Figure 1). Furthermore, with the average interest rate on Japanese government bonds (JGBs) now barely positive, and with domestic investors owning approximately 90% of Japan’s government debt, it is perhaps not a surprise that Japan’s persistently high debt levels have yet to produce a crisis, a run on the currency, or even an increase in bond yields.[2]For a further discussion, please see Mark Greenan and David Weinstein, “The Crisis that Wasn’t: How Japan Has Avoided a Bond Market Panic,” Columbia University Center on Japanese Economy and … Continue reading However, the debt situation still should be monitored, as we briefly discuss towards the end of the paper.
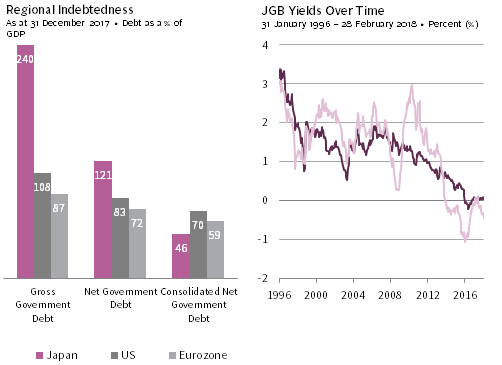
FIGURE 1 DEBT/GDP MEASURES ACROSS REGIONS and JGB YIELDS
Sources: Bank of Japan, Federal Reserve, the Financial Times, International Monetary Fund – WEO Database, and Thomson Reuters Datastream.
Notes: The real 10-year JGB yield is calculated by subtracting trailing 12-month Bank of Japan core inflation from the nominal 10-year yield. Core inflation is represented by the Consumer Price Index – All Items less Fresh Food & Energy excluding the effects of the 2014 consumption tax hike. Regional indebtedness data are estimates. Gross government debt inclues all debt outstanding, while net government debt excludes debt held by government entities. Net conslidated debt further excludes assets held by the respective central banks.
Since the outset, the Abe administration has engaged the program’s original “Three Arrows”—(1) aggressive monetary stimulus, (2) flexible fiscal policy, and (3) a growth strategy including structural reforms—in a high-risk, high-profile effort to boost domestic private demand, productivity, and inflation. The end goal is to increase Japan’s structural growth potential, make its fiscal situation more sustainable, and lift inflation expectations. The first two arrows combined extraordinary monetary stimulus and fiscal flexibility to stabilize the economy, which has now largely been achieved, providing time to implement the third arrow—structural reforms—which was always understood to be the most complex component, requiring the government to take on deeply entrenched economic interests. Progress on this has been made but appears to be slowing, despite the Abe administration increasingly emphasizing structural reform initiatives since 2016 as part of “Abenomics 2.0,” the program’s second stage. Since then, Abenomics has made its objectives more explicit and quantifiable by targeting the “New Three Arrows”—(1) strengthen the economy, targeting an intermediate-term nominal GDP of JPY 600 trillion; (2) improve childcare benefits and access with the goal of increasing the birthrate to 1.8 children per woman; and (3) expand social security benefits to assist working-age family care-givers. It is through the prism of this evolving policy formula and its overall objectives that we assess whether Abenomics is working.
Clearly, the government has made some progress.[3]Last summer, the International Monetary Fund declared that Abenomics had “brought success,” while concurrently emphasizing the need for Japan’s government to maintain its current policy stance … Continue reading Nominal GDP has grown 2.2% annualized in the five years since Abe took office, and core consumer prices have grown 0.7% annualized over that time (Figure 2).[4]In Figure 2 we show nominal GDP (as opposed to real GDP) for three reasons. First, real GDP has arguably been distorted by the use of a GDP deflator that differs significantly from Japan’s CPI … Continue reading These figures compare favorably with negative growth rates for both metrics over the prior 15 years. Also, though core inflation remains well below the BOJ’s 2% annual target, the recent increasing trend suggests Abenomics has at least stemmed Japan’s prior deflationary spiral, prompting speculation that the government could soon declare the end of deflation. Yet, despite this overall improvement, one could argue it has been more cyclical than structural, aided by the increasingly synchronized expansion in the world’s major economies. Japan’s economic productivity and wage growth are still anemic; inflation expectations remain depressed; and, despite much headway, corporate governance has room for further improvement.
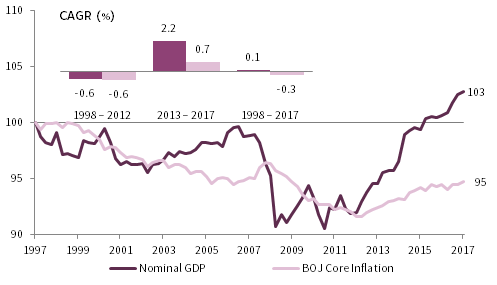
FIGURE 2 CHANGE IN NOMINAL GDP AND BOJ CORE INFLATION INDEX
First Quarter 1998 – Fourth Quarter 2017 • Fourth Quarter 1997 = 100
Sources: Bank of Japan, Japan Cabinet Office, Japan Ministry of Internal Affairs and Communications, and Thomson Reuters Datastream.
Note: BOJ Core Inflation is represented by the Consumer Price Index – All Items less Fresh Food & Energy excluding the effects of the 2014 consumption tax hike.
Policy Arrow One: The BOJ’s Aggressive Monetary Policy Helps . . . and Hurts
Following the 2013 appointment of Governor Haruhiko Kuroda, the BOJ launched a program of quantitative and qualitative easing (QQE) intended to weaken the yen (helping to make exports more competitive), to stimulate domestic demand (both by driving borrowing rates lower as well as through the wealth effect of its equity ETF purchases), and to boost inflation (a weaker currency also lifts import prices). The policy has arguably provided a modest growth boost and at least helped stem a 15-year deflationary bout. However, BOJ policies under Abenomics have also created unintended consequences. QQE and the BOJ’s negative interest rate policy (NIRP), introduced in January 2016, have helped boost private credit demand and bank lending by suppressing nominal interest rates and driving real rates negative; however, while business investment has picked up, private consumption growth has remained tepid, largely due to weak wage growth and a lingering deflationary mindset. In addition, NIRP has hurt bank profitability, and the BOJ has also faced an increasing shortage of assets to purchase given that its ownership of the Japanese government bond (JGB) market now tops 45%.
In order to mitigate these issues, the BOJ introduced yield curve control (YCC), pivoting to a 0% yield target on the ten-year JGB rather than a set amount of annual JGB purchases. This more-flexible approach provided the BOJ an opportunity to quietly begin tapering its pace of JGB accumulation without explicitly announcing its intentions, which would have risked spooking the capital markets; YCC has also helped slightly steepen the longer end of the rate curve in order to ease some of the negative pressure on bank margins from NIRP. Both outcomes have made the BOJ’s accommodative monetary policy more sustainable.
Policy Arrow Two: Flexible Fiscal Policy Supports the Recovery, but Fiscal Consolidation Delayed
The second policy arrow, maintaining sufficient government stimulus through a flexible fiscal policy, has also achieved modest success to date in terms of supporting Japan’s recovery and stabilizing its debt ratios. Prior to Abe taking office, Japan ran a budget deficit of 8%–10% each year since 2009 to battle the severe deflationary forces unleashed by the global credit crisis. This pushed gross government debt-to-GDP from an already high 191% to the 236% level between 2008 and 2012. After maintaining an 8% deficit in 2013, Abe pushed through a 3% valued-added tax (VAT) increase the following year, helping to constrain budget deficits to between 3% and 5% in the past few years despite implementing stimulative tax cuts for businesses.[5]The government plans to boost the VAT again (from 8% to 10%) in October 2019, with roughly half of the incremental proceeds used to expand education, healthcare, and child care benefits as part of … Continue reading With the support of the government’s ongoing stimulus and fiscal flexibility, the modest growth recovery under Abenomics has helped slow the rise in gross government debt/GDP, which currently stands only 4 percentage points above the level when Abe took office, while, as discussed, the debt/GDP in net terms has declined as a result of the government’s ongoing accumulation of assets. However the government’s evolving fiscal consolidation plans face continued delays, with the self-imposed deadline for achieving a primary budget surplus now targeted at 2027 or later (as recently as last year, the deadline was 2020). If the Abe government does not lay out a credible plan to eliminate the primary deficit, Japan risks wearing out the bond market’s patience. This in turn could lead to higher debt costs that would make the fiscal challenges all the more difficult to solve.[6]For a further discussion, please see “Realistic Fiscal Consolidation Target Needed”, The Japan Times, 1 February 2018, … Continue reading
Policy Arrow Three: Mixed Success for Structural Reforms to Date
The third policy arrow—implementing a battery of structural reforms as part of an evolving strategy to move the economy onto a stronger, more sustainable growth trajectory—is critical due to Japan’s rapidly aging society and shrinking population, but remains a work in progress. Abe’s third arrow proposals have combined a number of individual reforms and goals,[7]Among the many initial third arrow targets: boosting Japanese universities’ global rankings, increasing tourism, supporting exports with free trade agreements, streamlining healthcare innovation, … Continue reading some of which are finding more success than others (and some of which have been quietly dropped). To date, the most successful structural reforms and growth initiatives have involved improving corporate governance, implementing public pension reforms, expanding free trade agreements, and boosting inbound tourism. In contrast, efforts to revitalize Japan’s rural regions have not taken root, with excessive urbanization continuing largely unabated. Today, at a high level, the third arrow reforms are focused on boosting productivity, pursuing regulatory reforms, expanding international opportunities for Japanese businesses, and attracting inward foreign direct investment (FDI), with an increasing emphasis on two specific productivity-enhancement initiatives: “work-style reforms” and “human resources development.”[8]More specifically, productivity-enhancing reforms target greater employment equality and flexibility through “work-style” improvements. The reforms promote increased use of cutting-edge … Continue reading In order to assess these initiatives, we focus here on recent shifts in Japan’s workforce (which stands to benefit if structural reforms are an unqualified success) and wage dynamics.
Although unemployment is at a multi-decade low and, similarly, the jobs-to-applicant ratio is at a multi-decade high, these statistics belie the underlying structural weakness in Japan’s labor market and the need for further reforms. Japan’s longstanding “employment for life” culture and its rising real labor costs due to its traditional system of seniority-based pay have tilted Japanese companies toward non-regular (i.e. part-time) staffing rather than adding less flexible (and higher paid) full-time positions. The share of non-regular workers in the overall labor force nearly doubled from 20% in 1987 to 37% today (Figure 3). This has helped boost corporate profit margins but has also caused real wage growth to stagnate and worsened social inequality.

FIGURE 3 JAPAN NON-REGULAR EMPLOYMENT AS % OF TOTAL EMPLOYMENT
1987–2017 • Percent (%)
Sources: Japan Ministry of Internal Affairs and Communications and Thomson Reuters Datastream.
Note: Non-regular employment includes any non-executive employees that are categorized as part-time, temporary, contract, entrusted, or any other type of employment not deemed regular/full-time staff.
Many of the new part-time positions were filled either by women joining or re-joining the workforce (an explicit third arrow goal that is succeeding), or by recently retired older workers. Fewer working-age citizens are now actively seeking employment, resulting in the historically low unemployment rate (Figure 4). Still the growth in full-time positions has been slow due to weak demand, keeping overall wage growth anemic.
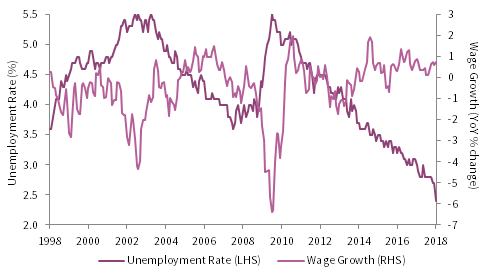
FIGURE 4 JAPAN UNEMPLOYMENT & WAGE GROWTH
31 January 1998 – 31 January 2018
Sources: Japan Institute for Labour Policy & Training, Japan Ministry of Internal Affairs and Communications, and Thomson Reuters Datastream.
Note: Wage growth data shown on a 3-month moving average basis.
The Abe government recently proposed temporary additional tax incentives for large Japanese companies that raise wages by 3% or more (and Abe has been jawboning firms to boost wages), but the preliminary results of the latest annual Shunto negotiations between large corporate employers and trade unions point to annual wage increases of just 2.16% on average, too low to support the BOJ’s inflation target (and mainly driven by automatic, seniority-based raises). Continued sluggish wage growth could threaten Abenomics’ ability to overcome Japan’s deep-seated structural issues. This is where corporate governance reforms come in. These initiatives aim to convince Japan’s businesses to boost wages, reinvest for profitable growth, and return excess capital in order to create a virtuous cycle in the economy and erase the country’s deflationary mindset.[9]For a further discussion of wage trends and implications for inflation, please see “Japan: Little Impact From Wage Negotiations”, Continuum Economics, 2 April 2018, … Continue reading
Substantial Corporate Governance Improvements, but Low-Hanging Fruit Has Been Picked
Abe’s corporate governance reform efforts have made a positive impact on profitability and shareholder returns, but reform progress has slowed considerably and would benefit from renewed political focus and further improvements. Despite the strong overall improvement since Abenomics began, progress at the individual company level has been uneven, as evidenced by high-profile governance failures at firms including Olympus, Takata, and Toshiba. However, one could argue that the emergence of such governance scandals is a sign that these issues are finally being closely scrutinized.
One way the government is pressuring the corporate sector to make governance changes is through its direct holdings of Japanese stocks (via pension funds and the BOJ). In 2014, the government introduced reforms at the US$1.3 trillion Government Pension Investment Fund (GPIF)—the world’s largest public pension—to improve its internal oversight and risk management, to diversify its asset allocation by reducing its exposure to domestic bonds and doubling its overall exposure to Japanese and foreign stocks, and to incorporate environmental, social, and governance (ESG) standards into its investment mandate. As part of this process, the GPIF became a signatory to Japan’s Stewardship Code,[10]For the full text of Japan’s Stewardship Code, please see: https://www.fsa.go.jp/en/refer/councils/stewardship/20170529.html. introduced by the Financial Services Authority (FSA) in early 2014 to codify the fiduciary responsibilities of both institutional investors and investment managers to constructively engage as shareholders with the listed companies in which they invest. Today, in addition to the GPIF,[11]For more information on the Government Pension Investment Fund’s stewardship activities, please see http://www.gpif.go.jp/en/stewardship_and_esg/stewardship.html. at last count the Stewardship Code has been supported by 227 signatories[12]For a current list of signatories, see https://www.fsa.go.jp/en/refer/councils/stewardship/20160315.html. from both the pension and investment manager communities. The support of the local public pension community is particularly notable in that it reflects them following the lead of the GPIF, which also holds true regarding asset allocation policy, providing an additional support to the equity market.
With respect to its ESG mandate,[13]For more information on the Government Pension Investment Fund’s ESG initiatives, please see http://www.gpif.go.jp/en/stewardship_and_esg/esg.html. in 2014 the GPIF adopted the JPX-Nikkei 400 Index as a benchmark for its passively managed domestic equity portfolio; the JPX-Nikkei 400 is an ESG-focused index launched in early 2014 whose constituents must meet strict criteria regarding return-on-equity (ROE), capital efficiency, and corporate governance. GPIF’s goal is to increase its ESG holdings from 3% currently to 10% over time. Similarly, the BOJ has also incorporated an ESG element into the equity portion of its QQE asset purchases by allocating a portion of its domestic equity exchange-traded fund purchases to those benchmarked to the JPX-Nikkei 400.
Another major achievement in the administration’s corporate governance reform initiative was the 2015 introduction of the Corporate Governance Code (“the Code”)[14]For full text of Japan’s Corporate Governance Code, please see: http://www.jpx.co.jp/english/equities/listing/cg/. by the FSA “to promote transparent, fair, timely, and decisive decision making by listed companies.”[15]Please see “Abenomics: For Future Growth, for Future Generations, and for a Future Japan that Is Robust,” The Government of Japan, January 5, 2018, … Continue reading As an example of the Code’s positive impact, in 2017 more than 85% of Tokyo Stock Exchange–listed companies had two or more outside directors, up from 20% just five years earlier (Figure 5). Company-shareholder alignment has also improved; by 2016, more than half of listed companies had cited shareholder return targets in their medium-term plans, and nearly 400 companies had implemented performance-linked compensation systems for employees or executives. Yet, despite meaningful progress on board independence and shareholder alignment, Japanese corporate governance standards lag behind those of peers in North America and Europe on some standards important to global investors. For example, although more than doubling over the last five years, the percentages of companies with one-third or more outside directors or at least one female director, at 34% and 28% respectively (Figure 5), remain well below levels achieved by Western peers. And annual base salaries still make up more than half of the pay mix for Japanese CEOs, whereas base salaries comprise roughly a quarter or less of annual CEO compensation in Europe and the United States.

FIGURE 5 JAPAN BOARD COMPOSITION & CEO PAY MIX COMPARISON
Sources: Allianz Global Investors and Pay Governance Japan.
Note: Corporate governance data based on TSE companies data and are as of 30 September 2017.
Now that the vast majority of companies have met the Code’s minimum standards and overall corporate profitability has substantially improved, momentum for further reform has slowed considerably (even though there is room for further improvement). Further gains will likely be more incremental than exponential. One of the proposed new government initiatives is aimed at pressuring firms to deploy surplus cash toward growth investments and shareholder distributions (Figure 6 highlights the enormous and unproductive cash balances).[16]Please see Masashi Akutsu, “Japanese Equity Strategy: Shift from “Goldilocks” to “Overheated”: 2018 Outlook and Investment Strategy,” SMBC Nikko Equity Research, 2018 … Continue reading This could push Japanese companies to use their strong balance sheets to seek accretive mergers and acquisitions or to expand dividend payouts and share buyback programs (Figure 7). In addition, financial disclosures must be improved, cross-shareholdings should decrease,[17]Cross-shareholdings are strategic stakes in public companies taken by other public companies. They are often held between those who have an existing commercial relationship, and exist to prevent … Continue reading advisory relationships with former corporate executives require more scrutiny, and board structure and governance would benefit from further improvements.
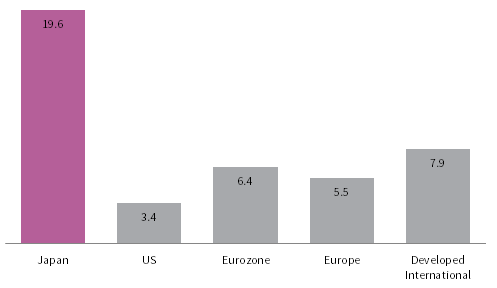
FIGURE 6 CASH AS A PERCENTAGE OF MARKET CAP (EX FINANCIALS)
As at 31 December 2017 • Percent (%)
Sources: Bloomberg L.P., MSCI Inc., Standard and Poor’s, Stoxx Ltd, and Tokyo Stock Exchange. MSCI data provided “as is” without any express or implied warranties.
Notes: Regions represented by Tokyo Stock Price Index (“Japan”), S&P 500 (“US”), MSCI Euro Index (“Eurozone”), Stoxx 600 Index (“Europe”), and MSCI EAFE Index (“Developed International”). Data represent the median value of each constituents’ cash & equivalents (as of their last filing) as a percentage of their market capitalization, excluding financial sector constituents.
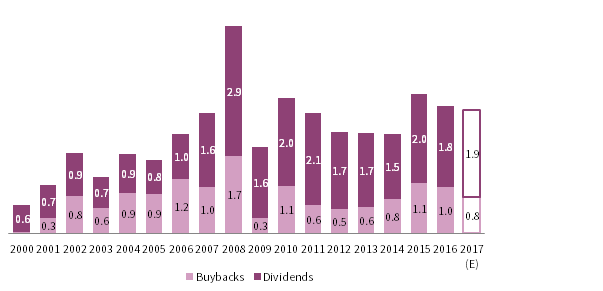
FIGURE 7 TOPIX SHARE BUYBACKS & DIVIDENDS AS A % OF MARKET VALUE
Fiscal Years 2000–17 • Percent (%)
Sources: Bloomberg L.P., Goldman, Sachs & Co., and Tokyo Stock Exchange.
Notes: TOPIX share buybacks and dividends data are presented by fiscal year. Japan’s fiscal year is from 1 April to 31 March, and is represented by the period it begins in; for example, the fiscal year from 1 April 2016, to 31 March 2017, is called fiscal year 2016. Share buybacks and dividends data are announced corporate actions derived from Bloomberg Equity Screening. Share buybacks and dividends data for fiscal year 2017, “2017 (E)”, are rough estimate forecasts based on analysis provided by Goldman Sachs Global Investment Research.
Japan’s Recent Equity Performance in Context
Japan’s equity market soared in the 1980s, due in part to the steep appreciation of the yen following the Paris Accord and the subsequent low interest rates and government stimulus. From its 1989 apex, the Japanese equity market then plunged into a deep secular bear market, touching a post-bubble low in price terms more than two decades later, in May 2012,[18]This date is based on price returns in local currency for the market capitalization–weighted MSCI Japan Index of large- and mid-cap stocks. The locally followed Nikkei 225, a price-weighted index … Continue reading just months before Abe returned to office (Figure 8). The MSCI Japan Index has staged a strong recovery since Abe’s December 2012 election. Since then, it has comfortably outperformed the MSCI World ex Japan Index (with respective annualized returns in USD terms of 12.2% versus 11.5%), despite periodic corrections such as the double-digit peak-to-trough decline this year (which appeared to stem from the combination of threats from US protectionism, uncertainty regarding BOJ policy, and mounting risks to Abe and his re-election prospects from the Moritomo Gakuen[19]Moritomo Gakuen is a highly conservative private school operator with reported connections to the prime minister, his wife (Akie Abe), and some close allies within the LDP. The scandal involves the … Continue reading scandal).
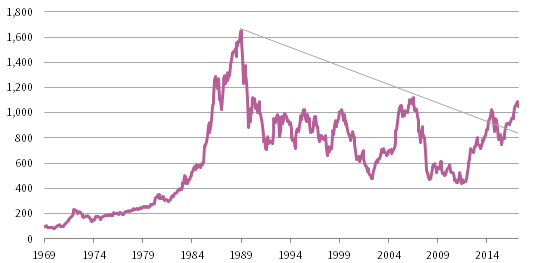
FIGURE 8 MSCI JAPAN PRICE INDEX LEVEL
31 December 1969 – 28 February 2018 • Rebased to 100 on 31 December 1969 • Local Currency
Sources: MSCI Inc. and Thomson Reuters Datastream. MSCI data provided “as is” without any express or implied warranties.
Japanese Equity Fundamentals Are Now Quite Strong
Japan’s equity market is currently supported by some of the strongest corporate fundamentals in its history. Japanese real earnings per share are currently at an all-time high (Figure 8), and payouts to investors are rising (the MSCI Japan’s 2.0% dividend yield is well above its long-term historical average). Return on equity (ROE), at 9.3%, is the highest it has been in nearly a decade and also one of the highest levels since Japan’s late-1980s bubble. Although MSCI Japan’s current ROE remains below that of MSCI World ex Japan (11.8%), the profitability gap between Japanese equities and other developed markets stocks has narrowed considerably (Figure 9). The question remains, however, whether corporate governance reforms can help permanently boost Japan’s structurally low ROE.
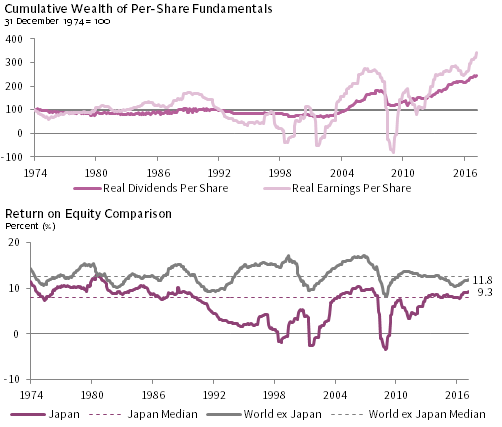
FIGURE 9 JAPANESE EQUITY FUNDAMENTALS
31 December 1974 – 28 February 2018
Sources: Japan Ministry of Internal Affairs and Communications, MSCI Inc., and Thomson Reuters Datastream. MSCI data provided “as is” without any express or implied warranties.
Notes: All data are quarterly. Japan real EPS and DPS are deflated by Japan CPI as of 28 February 2018.
Share buybacks, tax cuts, and constrained wage-growth have all combined to boost Japan’s cyclically high and still-rising ROE. Share buybacks reached a near-record amount in fiscal 2016 before softening somewhat last year. More importantly, the Abe administration’s tax cuts drove the effective tax rate for the MSCI Japan from 44% in 2012 to just below 30% in FY 2017, helping firms deliver a record net profit margin of 6.9%. Finally, the increased use of technology and part-time workers has constrained labor costs (although this has been problematic for the overall economy). Given prospects for greater buyback activity in fiscal year 2018, ongoing strength in global economic performance, and further declines in effective tax rates, ROE appears poised to rise further.
Despite Increasing Fundamental Strength, Valuations Remain Undemanding
Notwithstanding their strong rally in the second half of 2017, Japanese equity prices have not kept pace with accelerating earnings growth over the last few quarters, due in part to ongoing market skepticism about whether Abenomics can fix Japan’s structural issues, as well as recently heightened internal and external political risks. Despite enjoying a more than 15% annualized price return in JPY terms since Abe returned to office, large/mid-cap valuations remain 39% below their early 2006 peak, and 11% below their current cycle peak touched in May 2015. In addition, the broad MSCI Japan Investable Market Index’s normalized valuation sits just 2.5% above its historical median, although this masks some disparity among valuations for the individual market cap segments (Figure 10). Large-cap valuations are slightly below their historical median, and mid-cap valuations are just 7% above median; meanwhile, those for small caps now stand 20% above median following the small-cap segment’s strong outperformance over the past few years. As a result, the currently rich 66% valuation premium (99th percentile) for Japanese small caps versus large caps suggests potentially diminished prospects for them to continue outperforming over the longer term.

FIGURE 10 MSCI JAPAN ABSOLUTE AND RELATIVE VALUATIONS
31 January 2002 – 28 February 2018 • Percent (%)
Sources: MSCI Inc. and Thomson Reuters Datastream. MSCI data provided “as is” without any express or implied warranties.
While current valuations for Japanese large- and mid-cap equities are squarely fair valued in absolute terms, valuations relative to other developed markets equities appear downright cheap (Figure 10). However, relative valuations are being distorted by the inclusion of US equities, whose current normalized valuations sit in the top decile of historical observations, which we consider very overvalued. Though the MSCI Japan’s 15% discount to MSCI World ex Japan puts it in the bottom decile (6th percentile) of post-2001 relative valuations, Japanese equity valuations relative to other non-US developed markets, as represented by the MSCI EAFE ex Japan, are much closer to fair value. As a result, we continue to recommend including Japan in a broader overweight of global ex US equities against an underweight in US stocks.
Go Active or Stay Home
With approximately 3,500 listed stocks and a total market capitalization of roughly US $6.0 trillion, Japan’s equity market is second only to the United States in terms of size and liquidity, yet it is one of the least researched among the world’s major markets, potentially making it a ripe hunting ground for proven stock pickers to deliver excess returns. As a result of its lost decades, long battle with deflation, and the resulting prolonged bear market suffered by domestic stocks, many domestic households and institutions have shied away. Japan’s long bout with deflation has pushed domestic investors into bank deposits and currencies: they hold just 10% in equities.[20]For comparison, equities represent more than one-third of US household financial assets. Also, as discussed, until recently the GPIF and other Japanese public pensions maintained just a 12% allocation to domestic equities.
Foreign investors therefore have increasingly dominated trading volume in the Japanese equity market, recently accounting for more than 70% of total transaction value (Figure 11). In addition, given the language and cultural barriers, trading by foreigners tends to be concentrated in larger, more liquid stocks as well as in index futures given Japan’s large, liquid equity derivatives market. The same goes for the fairly small community of local professional equity investors, who historically have been more focused on technical factors than fundamentals and, relatedly, more trading oriented and therefore have prized the liquidity of large caps and index products. Taken together, these observations suggest Japan’s smaller cap segment has been somewhat overlooked historically.

FIGURE 11 FOREIGN SHARE OF TRANSACTION VOLUME AND SELL-SIDE COVERAGE
Sources: FactSet Research Systems, MSCI Inc., Thomson Reuters Datastream, Bloomberg, Bank of Japan, and Tokyo Stock Exchange. MSCI data provided “as is” without any express or implied warranties.
Notes: Transaction values are for the first section of the Tokyo Stock Exchange and exclude proprietary trading. MSCI Investable Market Indexes (IMI) capture large-, mid-, and small-cap capitalization companies, representing approximately 99% of the free float–adjusted market capitalization in each country or region.
Sell-side analyst coverage of the market has waned considerably over time, particularly in the small cap space, contributing to the market’s overall inefficiency. Today, about two-thirds of the roughly 2,000 stocks in the Topix broad market index have dedicated coverage from two or fewer sell-side analysts, and more than 40% of listed Japanese stocks have no coverage at all (Figure 11). By comparison, more than 90% of the roughly 2,400 stocks in the MSCI US IMI enjoy sell-side coverage from three or more analysts. Perhaps not surprisingly in this under-researched and inefficient market, the value and small-cap factors have outperformed fairly consistently over time, although, as discussed for small caps, their outperformance this cycle has left them overvalued relative to large caps.
Please see Wade O’Brien, et al., “Japanese Equities: Short-Term Promise Jeopardized by Longer-Term Risks,” Cambridge Associates Research Note, June 2017.
As we have discussed in previous Japanese equity research, the average actively managed non-US developed markets equities strategy has a sizeable underweight to Japanese equities. Given this observation, investors should be aware that they may be sitting on a large relative underweight to Japan when assessed on a look-through basis using existing managers’ underlying portfolio holdings. With Japanese stocks’ healthy fundamentals and reasonable valuations, those investors that find that they are meaningfully underweight Japan (and are comfortable moving against the country allocation decisions of their existing non-US or global equity managers) may at least want to consider allocating to a dedicated Japan strategy to top up their Japanese equity exposure so that it (together with other developed and emerging markets) is modestly overweight versus the United States. And given the potential market inefficiencies we’ve highlighted, an actively managed, fundamentals-focused strategy could be a compelling source of alpha in the broader portfolio. Related to this, though the low-hanging fruit from corporate governance reform has been picked, opportunities still exist for skilled investors to capitalize on the corporate governance theme at the individual company level, particularly within the smaller cap space where approximately 60% of companies remain “family-owned.”[21]A family-owned company is defined as one which a founder’s family member is a board member or among the top ten shareholders. This is the case for actively managed strategies using bottom-up fundamental analysis incorporating ESG into their approach and particularly those investors applying an activist approach.[22]Activism in Japan typically involves friendly, constructive engagement (US-style hostile activism generally has been ineffective in Japan for cultural reasons). Such an approach is only appropriate for those investors who can stomach the streaky performance and organizational risks, lower liquidity, and higher fees typically associated with concentrated, single-country strategies run by local, boutique managers (as well as investors’ own behavioral risks).
To Hedge or Not to Hedge, That is the Question
For investors contemplating an overweight allocation to Japanese equities through a dedicated Japan strategy, a key question is whether or not to hedge out the portion of the local currency exposure associated with the overweight position. Over the past 30 years, returns for Japanese equities have been quite similar, whether in US dollar or local currency terms, as the JPY has been range bound since 1987, albeit with periods of pronounced yen strength and yen weakness. However, USD-hedged index returns have meaningfully outperformed over this period compared to unhedged returns in USD, given the positive carry earned on the hedge (this stems from interest-rate differentials between the United States and Japan).[23]While the historical outperformance of hedged returns would be less for euro and Swiss franc investors, it would actually be higher for GBP and AUD/NZD-based investors. That said, the outperformance of hedged exposure has come at the expense of greater return volatility, given the historically negative correlation between the yen and the Japanese equity market, as periods of yen strength have often coincided with poor equity performance (Figure 12). Japan bears hold out this dynamic as a main reason to underweight the market, however given the deeply negative correlation between Japanese equities and the yen since Abe’s election, Japanese equities have exhibited little correlation in USD terms to World ex Japan (12%) and US equities (2%), providing very attractive diversification benefits to foreign investors with unhedged exposure to Japan. While correlations are considerably higher over the long-term (48%), the diversification benefits of unhedged Japanese equity exposure remain clear, despite protestations to the contrary by the perma-bears.
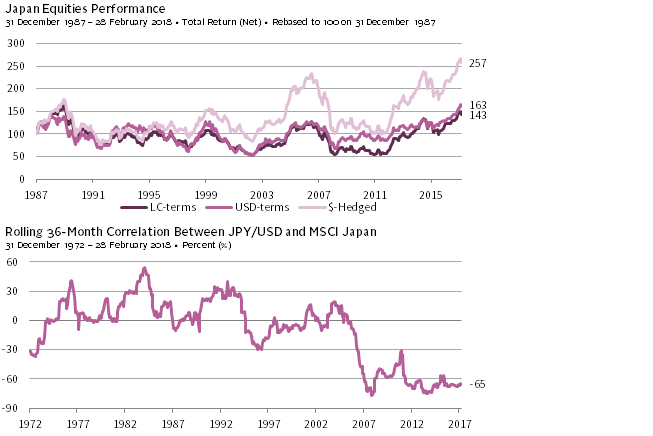
FIGURE 12 RELATIONSHIP BETWEEN JPY/USD AND JAPANESE EQUITY PERFORMANCE
31 December 1972 – 28 February 2018 • Percent (%)
Sources: MSCI Inc., and Thomson Reuters Datastream. MSCI data provided “as is” without any express or implied warranties.
Though most investors that employ currency hedging do so to reduce volatility, the yen is a different beast, and hedging the currency has actually increased volatility. In addition, the combination of deflation and the BOJ’s aggressive monetary easing under Abenomics has made the Japanese yen undervalued in real currency terms. If Abenomics succeeds and the BOJ dials back its stimulus, the yen could appreciate from current levels and therefore provide an additional tailwind to an unhedged Japanese equity exposure. On the flip side, if we are wrong and Japanese equities underperform in a global equity selloff scenario, unhedged exposure could be a helpful diversifier (assuming safe-haven flows again benefit the yen), mitigating some of the equity underperformance. As a result of these considerations, the best approach may be for investors to leave any overweight position unhedged.
Risks to the Outlook
Despite Japan’s economic progress under Prime Minister Abe, an improved outlook, and Japanese equities’ still undemanding valuations, important risks remain.
Near-Term Risks:
Domestic and Global Politics. The chances of Abe being forced to resign or losing the LDP election in September will grow if the Moritomo Gakuen scandal persists and the administration’s public approval rating continues to wane. Although many of the reforms and policies implemented to date under Abe will remain in place long after his tenure ends, his departure would put the future of Abenomics in limbo. While domestic politics are thorny, global issues bear monitoring as well. The rapid growth in Sino-Japanese trade over the past 20 years makes Japan particularly vulnerable to any economic distress in China, as well as to any deterioration in the trading relationship as a result of non-economic factors.[24]These might include any move by Abe to remove pacifism from the constitution—a pet project of his and a key policy initiative for this year. Although that effort may now be at risk as a result of … Continue reading Additionally, the United States’ recent shift toward “America-first” foreign and trade policies under the Trump administration creates uncertainty for Japan with respect to both defense and trade. Ongoing tensions with North Korea are a related concern as well.
Global Economic Cycle. It is getting later in the global economic cycle, with the US cycle in particular now well advanced. As the old adage goes, when the United States sneezes, the rest of the world catches a cold. While Japan’s economy has strengthened since Abe took office, it has a highly cyclical economy and a countercyclical, safe-haven currency, both of which contribute vulnerability in a global downturn scenario.
Longer-Term Risks:
Demographics. The rapidly aging society and shrinking population represent the most important long-term risk facing Japan, which is why structural reforms focused on boosting and broadening the labor force, increasing the birth rate, and reducing the burden and costs of elderly care and childcare for the working age population are critical to Japan’s long-term economic outlook.
Fiscal Outlook. As discussed earlier, Japan’s debt sustainability is an important issue, but the risk of a looming fiscal crisis appears overstated. However, a longer-term risk is that Japan’s rapidly aging society and declining population will prevent savings growth, reducing domestic demand for government bonds and making it more challenging for the BOJ to normalize its monetary policy and balance sheet in the future. Japan will need to attract new sources of demand for its bonds going forward.
The Bottom Line
Japan’s challenging demographics, conservative cultural traditions, and entrenched interests remain important structural issues facing the economy today, but are being gradually mitigated by the Abe administration’s reform efforts. The government’s policy initiatives under Abenomics have helped Japan nearly escape from deflation and have returned the economy to positive, albeit modest, growth. However, policy-makers need to continue implementing structural reforms to boost productivity, raise inflation expectations, and permanently lift the economy’s growth potential, putting Japan on a more sound and sustainable fiscal footing. As part of this in-progress reform process, Japan’s corporate governance culture has improved, yet requires continued diligence on several fronts.
The Abe government appears poised to make further progress, provided Abe continues to serve as Japan’s prime minister beyond the LDP election in September. Yet, internal and external risks to the Abenomics reform agenda are important to monitor. Policy missteps and recent political scandals are now distracting the administration and threatening Abe’s future. The advanced global economic cycle and shifting geopolitical dynamics represent external threats that must also be monitored.
Risks to the reform agenda and economic outlook aside, corporate fundamentals are the strongest they’ve been in quite some time, owing to the government’s reform efforts as well as the healthiest global economic backdrop in a decade. Japanese equity valuations are higher today than at the start of Abe’s tenure, reflecting considerable fundamental improvement, but they remain well below their 2006 peak, fairly valued in absolute terms, and attractive relative to expensive US equities. Japan’s equity valuations continue to be weighed down by skepticism regarding whether Abenomics can solve Japan’s structural issues (and, more recently, by heightened political risk and policy uncertainty due to renewed domestic scandal), which may represent an opportunity for long-term investors to top up their exposures. We continue to recommend tilting towards Japanese equities as part of a broader overweight to global ex US equities relative to US stocks.
Investors looking to make a dedicated allocation to Japanese equities may want to do so via actively managed, fundamentals-focused strategies, particularly those with a value discipline and smaller-cap focus that can best exploit the Japanese market’s inefficiencies, though as mentioned, the run-up in small caps has left them expensive, potentially weighing on future relative performance versus market cap–weighted benchmarks over the longer term. On the question of whether to hedge out the local currency risk embedded in any overweight exposure, hedging has boosted absolute performance on a historical basis because of interest rate carry, but at the cost of elevated volatility stemming from the strong negative correlation between the yen and domestic Japanese stocks. Considering the yen’s current undervaluation and uncertainty regarding the future direction of monetary policy, the hedging decision is a difficult one, but given the potential diversification benefits of additional JPY exposure, the best approach may be to leave any overweight exposure unhedged.
Michael Salerno, Senior Investment Director
Daniel Day, Senior Investment Associate
Brandon Smith, Senior Investment Associate
Han Xu, Investment Associate
Index Disclosures
JPX-Nikkei 400 Index
The JPX-Nikkei Index 400 is composed of companies that meet global investment standards on criteria including efficient use of capital and investor-focused management perspectives. The index was jointly developed by Nikkei, the Japan Exchange Group, and the Tokyo Stock Exchange.
MSCI EAFE ex Japan Index
The MSCI EAFE ex Japan Index (also known as the MSCI EASEA Index) captures large- and mid-cap representation across developed markets countries across the world, excluding Canada, Japan and the United States. With 604 constituents, the index covers approximately 85% of the free float–adjusted market capitalization in each component country.
MSCI EAFE Index
The MSCI EAFE Index captures large- and mid-cap representation across developed markets countries across the world, excluding Canada and the United States. With 927 constituents, the index covers approximately 85% of the free float–adjusted market capitalization in each component country.
MSCI Euro Index
The MSCI Euro Index is a free float–adjusted, market capitalization–weighted index that is designed to measure the equity market performance of 10 developed markets countries (Austria, Belgium, Finland, France, Germany, Ireland, Italy, the Netherlands, Portugal, and Spain) in the Eurozone. With 123 constituents, the index covers approximately 70% of the free float–adjusted market capitalization of the Eurozone.
MSCI Japan Index
The MSCI Japan Index is a free float–adjusted, market capitalization–weighted index that is designed to measure the equity market performance of Japan. With 321 constituents, the index covers approximately 85% of the free float–adjusted market capitalization in Japan.
MSCI Japan Investable Market Index (IMI)
The MSCI Japan Investable Market Index (IMI) captures the performance of the large-, mid- and small-cap segments of the Japan market. With 1,250 constituents, the index covers approximately 99% of the free float–adjusted market capitalization in Japan.
MSCI Japan Total Return Index (Net)
The MSCI Japan Index is a free float–adjusted, market capitalization–weighted index that is designed to measure the equity market performance of Japan in net terms. With 321 constituents, the index covers approximately 85% of the free float–adjusted market capitalization in Japan.
MSCI World ex Japan Index
The World ex Japan Index (also known as the MSCI Kokusai Index) captures large and mid-cap representation across 22 of 23 Developed Markets countries (excluding Japan). With 1,327 constituents, the index covers approximately 85% of the free float–adjusted market capitalization in each country.
S&P 500 Index
The S&P 500 Index is a capitalization-weighted index of 500 stocks intended to be a representative sample of leading companies in leading industries within the US economy. Stocks in the index are chosen for market size, liquidity, and industry group representation.
Stoxx 600 Index
The Stoxx 600 Index is a free float–adjusted, market capitalization-weighted index that captures large-, mid-, and small-capitalization companies across 17 countries of the European region (Austria, Belgium, Czech Republic, Denmark, Finland, France, Germany, Ireland, Italy, Luxembourg, the Netherlands, Norway, Portugal, Spain, Sweden, Switzerland, and the United Kingdom. With 600 constituents, the index covers approximately 90% of the free float–adjusted market capitalization in each country.
TOPIX
The Tokyo Stock Price Index (TOPIX) is a free float–adjusted, market capitalization-weighted index that is calculated based on all the domestic common stocks listed on the Tokyo Stock Exchange First Section. TOPIX measures current market capitalization assuming that market capitalization as of the base date (4 January 1968) is 100 points.
Footnotes