Ongoing growth headwinds, an earnings recession, and still-elevated valuations make us skeptics that US equities’ four-year bull market can continue much longer
- US equities have been in a cyclical bull market since October 2011, having risen substantially since that time. If US equities are still in the secular bear market that began in 2000, this cyclical bull has run quite long and quite high.
- A review of historical secular and cyclical market patterns lends some credence to the argument that US equities entered a new secular bull market in 2009. Compared to past cyclical bulls within secular bulls, this rally would be just average in terms of length and below average in terms of magnitude.
- The influence of the US Federal Reserve’s monetary policy decisions on the current cycle should not be underestimated. Current valuations leave little room for error, and the potential surprises skew to the downside.
After heading up in fits and starts since the March 2009 low, the US equity market officially entered a cyclical bull market in October 2011 and since then has risen an impressive 89% on a cumulative nominal price return basis (Figure 1). Despite some setbacks over that time, the market had not experienced a cumulative drawdown greater than 10% until late August of this year. Such a sustained stretch of strong performance reminds us that it is getting late in the current bull market cycle, particularly in light of the more serious (though short-lived) market correction experienced last quarter. After trading near their all-time highs for several months, US equities dropped sharply in August and September and then rallied in October, not quite returning to their July peak. This performance is somewhat reminiscent of the last legs of a dying bull market, though historically low interest rates could continue to drive US equities higher for longer than we would expect.
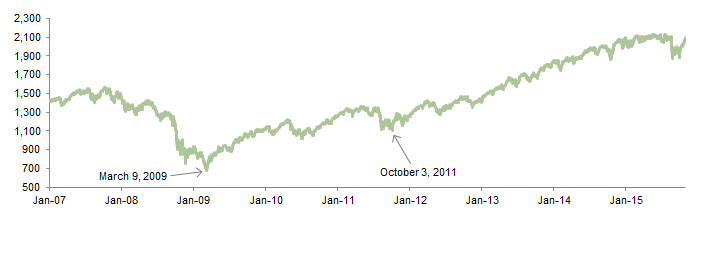
Figure 1. S&P 500 Price Index
January 1, 2007 – October 31, 2015
Sources: Standard & Poor’s and Thomson Reuters Datastream.
In this paper we review the history of US equity market cycles, examining both the case for a continuing secular bear market as well as arguments that US equities have been in a new secular bull since March 2009. We also review the evidence for whether the cyclical bull market that began in October 2011 is turning, considering signals from both the economic cycle and the earnings cycle. Finally, we put current valuations for US equities into historical context, taking into the account the importance of inflation, in order to calibrate return expectations going forward. We are skeptical of US equities’ ability to resume their multi-year dominance of international equivalents going forward, and we maintain our slight underweights to US equities in favor of Eurozone, Japanese, and emerging markets (particularly Asian) equities.
Secular Market Cycles Defined
Secular bull and bear markets are longer-term periods (generally greater than ten years) during which the market generates returns significantly above or below its long-term historical average. In secular bull markets, tailwinds to equity valuations allow valuation multiples to expand over a long period of time. In contrast, secular bear markets involve valuation headwinds and, therefore, a long period over which valuations compress.
Secular market cycles tend to be driven by longer-term trends in geopolitics, economic policy, and demographics, among other factors, and the combined influence of these trends on investor psychology and behavior. The inflection points separating secular bull and bear markets are characterized by extreme levels of either optimism (greed) or pessimism (fear) among investors. Past secular bull markets have resulted in stock market bubbles (e.g., 1929 and 2000) that ultimately burst when economic data and corporate financial results did not live up to very lofty expectations. The powerful psychological shift to risk aversion resulting from these failed expectations helps usher in the transition to a secular bear market environment. The inflection points between secular bull and bear markets are often triggered or exacerbated by major crises (e.g., wars/terrorism, economic policy failures, commodity shocks). Secular bear markets do not run their course until the psychological effects of prolonged periods of sustained losses are purged from investors’ minds. Given the important role of market psychology in driving the stock market’s secular cycles, divining these cycles is part art and part science.
Two main schools of thought have the most influence on defining secular cycles for the US stock market. They both account for the influence of long-term inflation trends on stock market valuations (see sidebar), but in slightly different ways.
In the first, peaks and troughs in the real (inflation-adjusted) S&P 500 price index mark inflection points between secular bear and bull market cycles. Under this approach, new and sustained all-time highs in the inflation-adjusted index mark the end of a secular bull market and the start of a new secular bear market, which in turn ends with the last low prior to the next new inflation-adjusted high being established.
In the second, peaks and troughs in the index’s normalized price/earnings (P/E) ratio mark the start and end of the secular market periods. The Shiller P/E (a ratio comparing the current level of the real S&P 500 price index with a trailing ten-year average of inflation-adjusted earnings) is typically used as the measure. A trough (typically below 10) in a period of below-average normalized P/E multiples indicates the end of a secular bear and the start of a new secular bull, whereas a peak (generally above 20) in a period of above-average normalized P/E ratios marks the end of a secular bull and a shift toward a new secular bear.
Despite the differences among these methodologies and others, market observers generally agree that markets have experienced four secular bear cycles since the turn of the twentieth century: 1900–1920, 1929–1949, 1968–1982, and a fourth that began in 2000 (Figure 2). Differences of opinion do exist on the Great Depression period that began with the 1929 crash, with some suggesting the ensuing violent stock market swings represent multiple secular market cycles, rather than one prolonged secular bear market that persisted through the late 1940s. The more recent period since the turn of the millennium has also generated disagreement. Because the methods used for determining secular market cycles are backward-looking, distinguishing these cycles as they are happening is difficult. Most observers agree that a new secular bear market commenced in 2000, but whether it ended at the market bottom in March 2009 or continues through today is a topic of much debate, as we will discuss.
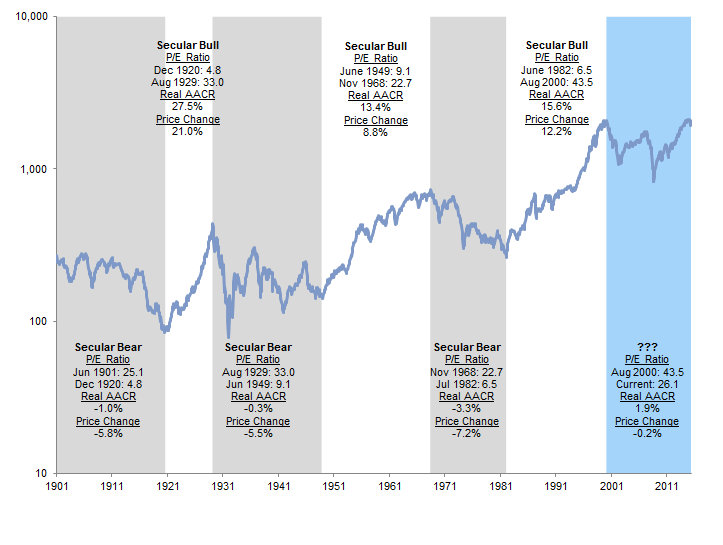
Figure 2. S&P 500 Valuation Compression and Expansion During Secular Bear and Bull Markets
June 30, 1901 – October 31, 2015 • Real Price Level (Log Scale)
Sources: Global Financial Data, Inc., Robert J. Shiller, Standard & Poor’s, and Thomson Reuters Datastream.
Notes: Normalized real (Shiller) price-earnings (P/E) ratios for the S&P 500 Index are calculated by dividing the current index value by the rolling ten-year average of inflation-adjusted earnings. Monthly earnings are interpolated from actual quarterly reported earnings per share. Average annual compound returns are based on total return index levels and are shown for each bear and bull market period. Real price changes shown for each period are annualized. Inflation-adjusted prices, total returns, and earnings are deflated in terms of September 30, 2015, dollars. Current earnings are based on third quarter 2015 estimates from Standard & Poor’s.
The Importance of Inflation for Equity Market Valuations
The level of and trend in the inflation rate is a key link between the two schools of thought on secular market cycles. Long-term inflation (ten-year average of the CPI-U) and normalized P/E ratios for the S&P 500 show a clear inverse relationship, as shown in the figure below. This relationship should come as no surprise given that the Shiller P/E uses ten-year average inflation-adjusted earnings in its denominator. Similarly, the real price index also takes into account the long-term compounding effect of inflation on corporate profits and therefore cash flows.
Stocks are financial assets, and their prices reflect the present value of a future series of cash flows in perpetuity, discounted by the prevailing interest rate, which in turn reflects expectations regarding the future rate of inflation. Therefore, the stock market is a discounting mechanism that not only reflects investors’ expectations regarding future profits, but also the extent to which future profits will be aided or eroded by inflation (or deflation). Rising inflation expectations result in rising interest rates that will serve to depress the present value of future earnings and dividends. Severe deflation is also detrimental to stock market valuations as a result of its negative impact on the reported (nominal) value of future earnings and dividends. In contrast, expectations of stable, low inflation are reflected in low interest rates, which in turn maximize the present value of stocks’ future cash flows. Thus, periods of stable, low inflation have supported premium valuations, whereas periods of rapidly rising inflation or substantial deflation have caused equity valuations to collapse.
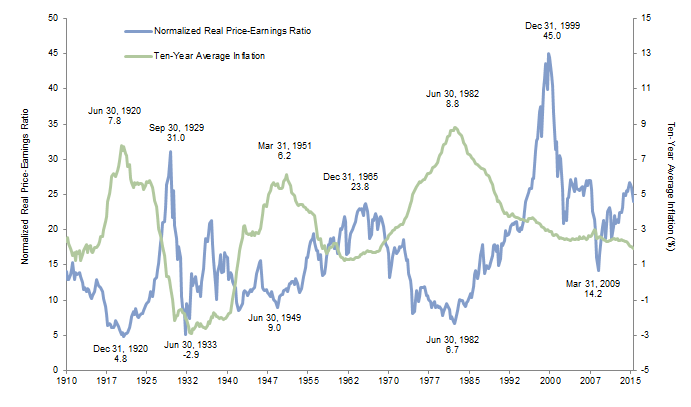
S&P 500 Normalized Real Price-Earnings Ratios and Ten-Year Average Inflation
First Quarter 1910 – Third Quarter 2015
Sources: Standard & Poor’s, Thomson Reuters Datastream, and US Department of Labor – Bureau of Labor Statistics.
Notes: Graph represents quarterly data. Earnings are as of September 30, 2015, and are preliminary. Normalized real price-earnings ratios for the S&P 500 Index are calculated by dividing the current index value by the trailing ten-year average of real earnings.
The US Market Today: Examining the Case for Secular Bear or Secular Bull
If the secular bear market that most agree began in 2000 continues today, how does it compare to those of the past? In length, just over 15 years have passed since the August 2000 peak, which is shorter than the roughly 18-year average for the three prior secular bear markets, though one of these lasted less than 14 years. On a price index basis, the average time to a sustained (more than three consecutive months) recovery in real cumulative wealth was 27 years in the prior three secular bears. Similar to the 1901–1920 market cycle, when the market recovered its real cumulative wealth on a temporary interim basis in 1906, in the current cycle the market regained its real cumulative wealth in February 2015, but that record level has not yet been sustained.
On a P/E basis, the three prior secular bears ended with normalized P/E ratios firmly in the single digits (Figure 3). In addition, those cycles ended only after normalized market valuations remained at similarly record low levels on a prolonged basis. The current period has not seen the market trade at low valuations on a prolonged basis, and valuations have not hit single digits. After falling from a peak of 45 in December 1999 to just below 12 in March 2009, the Shiller P/E has expanded steadily back to 26, a level at which secular bear markets typically start, rather than end. For this reason, some market observers argue that the most recent secular bear market continues today: since 2000 the normalized P/E of the S&P 500 has failed to drop below 10 and quickly returned to levels above 20, where it has remained on a sustained basis since late 2010.
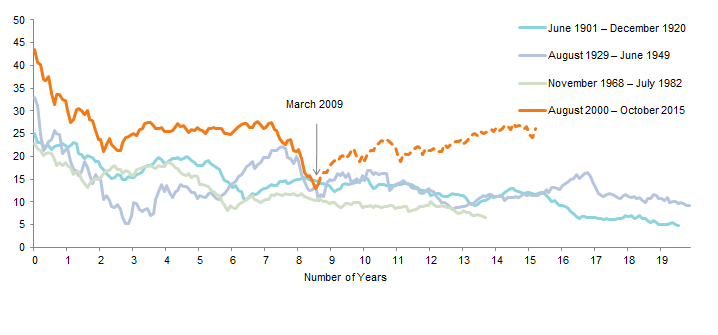
Figure 3. Comparison of Secular Bear Markets: S&P 500 Normalized Real (Shiller) P/Es
Sources: Robert J. Shiller, Standard & Poor’s, and Thomson Reuters Datastream.
This argument seems to miss the proverbial forest for the trees. The S&P 500’s month-end low of approximately 13 for the Shiller P/E on February 28, 2009, represented a collapse of 71% from the all-time peak of 45 observed on December 31, 1999. In the history of the US stock market, such a deterioration in normalized market valuation is surpassed only by the 84% valuation collapse observed during the 1929–1932 onset of the Great Depression.
In addition, given the extreme peak reached in December 1999, arguing that March 2009[1]On a daily data basis, the true P/E low in the cycle since 2000 was March 9, 2009. The intraday low of the S&P 500 Price Index that day—the infamous 666 level—would have meant a Shiller P/E … Continue reading was not the key inflection point because the market’s valuation didn’t hit the magical sub-10 level seems rather arbitrary.[2]Using operating EPS, which was less impacted during the financial crisis by the substantial financial sector asset write downs, the Shiller P/E would have reached 10.1. Furthermore, the 61% decline observed from August 2000 to February 2009 is in line with the market’s performance during past secular bears, which was -67% on average (Figure 4). In contrast, from August 2000 through October 2015, the S&P 500 has generated a real cumulative price return of 0%, suggesting the market would have a very long way to fall for it to retest the prior lows, were it still in a secular bear.
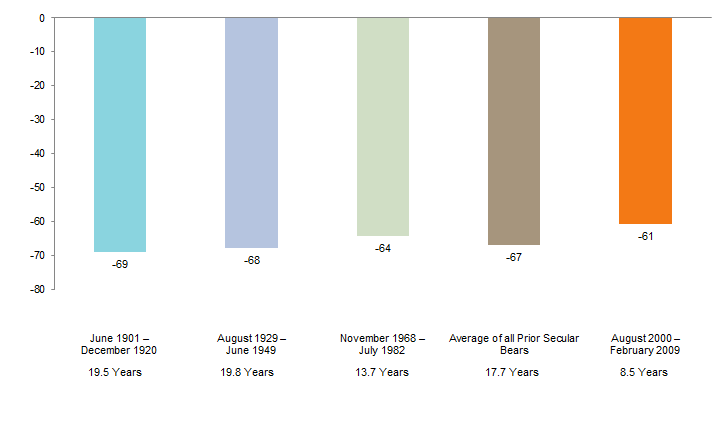
Figure 4. Comparison of Secular Bears: S&P 500 Real Cumulative Price Return
1900–2015 • Cumulative Percent Price Return (%)
Sources: Global Financial Data, Inc., Ned Davis Research, Inc., and Standard & Poor’s.
What if the pervasive fear and capitulation exhibited by investors in early 2009 signaled the end of the secular bear market that began in 2000? Marking the end of the secular bear on February 28, 2009, would make the 2000–09 bear market the shortest in history at 8.5 years. Given the extent of the excesses and imbalances that contributed to the dot-com bubble and global financial crisis, it is perhaps not a surprise that the US equity market fell so far so fast in their aftermath. Moreover, the Fed’s historic intervention may have served to curtail the typical painful conclusion observed of past secular bears, healing investor psychology to the point where a new secular bull market emerged in early 2009. In addition, the market’s ostensibly elevated valuations are partly a result of the unprecedented three-decade-long period of low inflation that the United States has been enjoying since the Paul Volcker–led Fed broke finally broke the back of inflation in the early 1980s. As discussed in the sidebar, an environment of low, stable inflation is certainly conducive to premium equity valuations.
On a P/E basis, the market’s current Shiller P/E remains 42% below the peak valuation for the July 1982–August 2000 secular bull, 21% below the December 1920–August 1929 peak, and just 9% above the peak of the secular bull market that ended in 1968 (Figure 5).
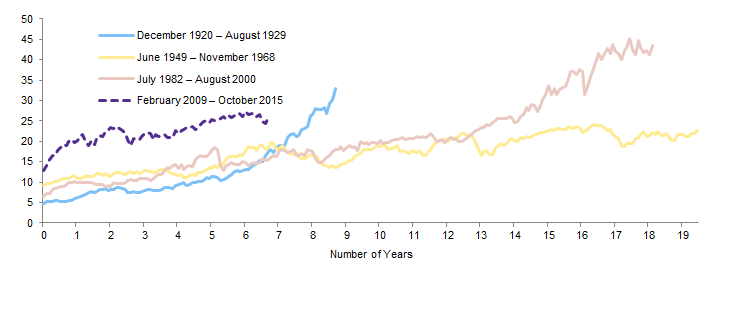
Figure 5. Comparison of Secular Bulls: S&P 500 Normalized Real (Shiller) P/Es
Sources: Robert J. Shiller, Standard & Poor’s, and Thomson Reuters Datastream.
Since the February 2009 month-end, the S&P 500 has gained 152% in real cumulative terms through October 2015, a period of approximately 6.7 years. Comparatively, the prior three secular bull markets lasted over 15 years and generated a 513% real cumulative return, on average (Figure 6). If this is indeed a new secular bull, this look at past secular bulls suggests the US market may only be in the early- to mid-stages of such a cycle.
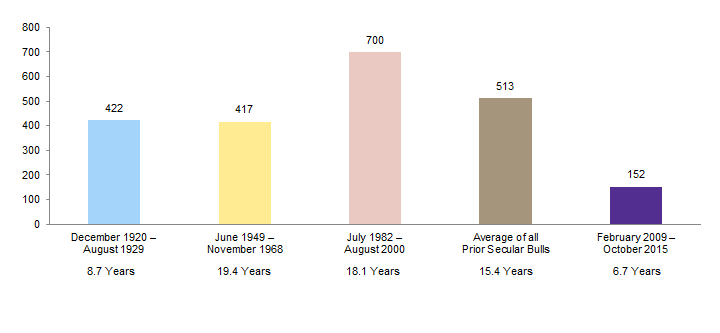
Figure 6. Comparison of Secular Bulls: S&P 500 Real Cumulative Price Return
1900–2015 • Real Cumulative Percent Price Return (%)
Sources: Global Financial Data, Inc., Ned Davis Research, Inc., and Standard & Poor’s.
At the same time, arguments persist that distortions remain in the market today, and for evidence one need not look any further than the exponential growth of the Fed’s balance sheet through multiple rounds of quantitative easing and its apparent influence on the stock market (Figure 7). The secular bear camp points to the Fed’s historic policy accommodation and the associated interest rate suppression as evidence that the central bank’s unprecedented response to the global financial crisis has only served to prolong the inevitable and painful conclusion to this “twenty-first-century bear market” and the deleveraging that many still feel the economy must eventually endure. That seems a fair argument, as the Fed now stands on the precipice of beginning to tighten monetary policy for the first time in almost a decade, with considerable uncertainty regarding how the economy and market will respond.
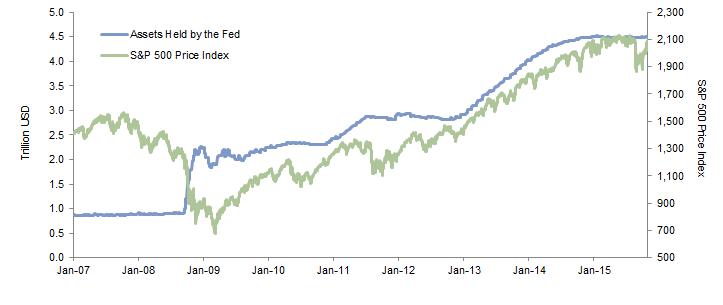
Figure 7. S&P 500 Price Index vs Assets Held by US Federal Reserve
January 1, 2007 – October 31, 2015
Sources: Standard & Poor’s and Thomson Reuters Datastream.
If comparisons with past secular bears don’t definitively determine what type of secular market US equities are in today, in light of recent economic and market circumstances, what other factors might assist? Within the longer-term secular markets, equities can experience multiple short- to intermediate-term cycles, typically termed “cyclical bull” and “cyclical bear” markets,[3]A cyclical bull market generally means a period with nominal cumulative returns of 20% or greater without an intervening 20% reversal. Conversely, a cyclical bear market involves a period during … Continue reading driven in part by the interaction of the business cycle with the earnings cycle. While understanding the secular nature of the market in real time is a challenge, identifying cyclical cycles is somewhat less so, and assessing the nature of these interim cycles can help inform which type of secular trend the market is experiencing.
Cyclical Market Cycles and the Economy
During secular bull markets, cyclical bulls are usually stronger, in terms of overall cumulative performance, and last longer, whereas in secular bear markets, cyclical bears are often worse. Similarly, cyclical bears tend to be less extreme in secular bulls and cyclical bulls weaker during secular bears. Cyclical bear markets are also typically, but not necessarily always, associated with economic or earnings recessions and tend to be longer and more severe when accompanying an economic downturn. Economic recessions, and the cyclical bear markets that often accompany them, can occur during secular bear markets, as experienced in 2001–02 and 2008–09, but they can also take place during a secular bull market, as evidenced by the recession and cyclical bear market of 1990.
Comparing this cyclical bull with its predecessors lends some further support to the notion that the market is in a new secular bull cycle, but the evidence is still not entirely conclusive. The cyclical bull market that began on October 3, 2011, has lasted just over four years, similar to the average length of all prior cyclical bulls occurring within secular bull markets since 1900 (Figure 8). By comparison, the typical cyclical bull within past secular bear markets, the so-called bear market rally, has lasted approximately one year. Bear market rallies have generated average gains of only 59% in real cumulative terms, while past cyclical bull markets within secular bulls have seen an average 132% real cumulative return. The current bull market’s 89% real cumulative gain to date surpasses the typical bear market rally experience. That said, in two previous periods (out of 23 cycles since 1900), bear market rallies have exceeded the current cycle in terms of both magnitude and length, so today’s experience is not unprecedented. One of the periods that exceeded the current rally’s length and magnitude was the powerful October 2002 to October 2007 bull market leading up to the global financial crisis. If US equities remain in a secular bear market, it is one that has contained two of the longest and most powerful bear market rallies in our dataset.
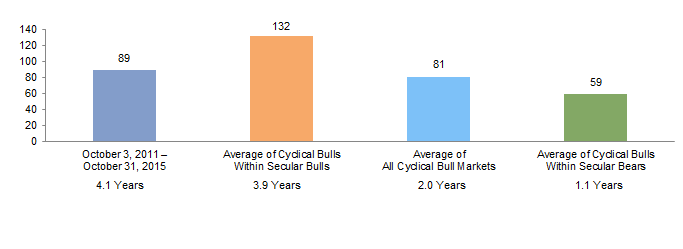
Figure 8. Comparison of Cyclical Bulls: S&P 500 Cumulative Price Return
1900–2015 • Cumulative Percent Price Return (%)
Sources: Global Financial Data, Inc., Ned Davis Research, Inc., and Standard & Poor’s.
The Importance of the Earnings Cycle
The current cyclical bull market since 2011 certainly feels long, and the recent market correction (down 12% from May 21 through August 25) led many to question whether this bull market cycle is coming to an end. As noted, cyclical bear markets are often associated with economic recessions, but corporate earnings are another important component of equity market cycles. Earnings recessions typically go hand-in-hand with economic recessions, though not always. For this paper we define an earnings recession as two or more consecutive quarters of negative year-over-year growth in earnings per share (EPS). Earnings recessions often lead to equity market corrections (sometimes with a delay), and many such sell-offs are severe enough to be considered bear markets, regardless of whether an economic downturn caused the retrenchment in earnings.
Through September 2015, EPS for the S&P 500 have contracted an estimated 11.5% since their peak in third quarter 2014, while the S&P 500 price index declined 12.4% peak-to-trough from late May to late August. The depth of this non-recessionary earnings decline and the extent of the associated market reaction are in line with similar past episodes. Since 1950 there have been 15 earnings recessions, of which only five have occurred outside of an economic recession, with the average of these involving a 8% peak-to-trough EPS decline and a roughly 17% market correction (Figure 9) when evaluating the closest peak-to-trough decline in the S&P 500 Price Index. This could suggest that a bear market correction is not currently imminent, so long as earnings don’t deteriorate much further. But with a fourth consecutive quarter of negative year-over-year EPS growth forecast by analysts in the October to December calendar quarter, one could argue that the market at least appears at risk of retesting its late August lows, if not falling further toward an outright bear market correction.
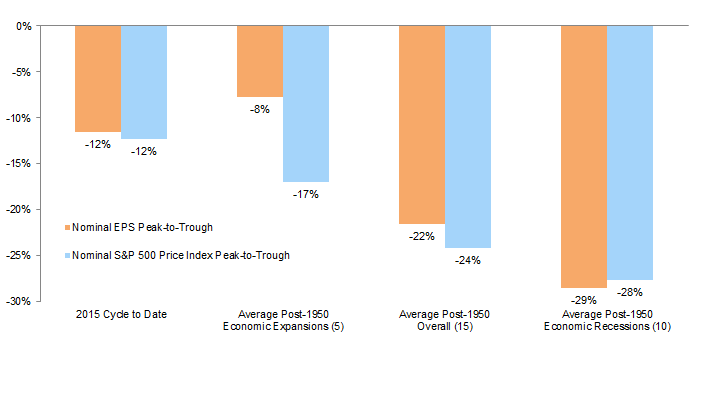
Figure 9. S&P 500 Earnings Recessions and Associated S&P 500 Price Index Declines
1950–2015
Sources: Global Financial Data, Inc., Standard & Poor’s, and Thomson Reuters Datastream.
The most recent cyclical bear market associated with an earnings recession, but not an economic recession, occurred in 1998. That cycle coincided with similar economic conditions as those existing today and could inform how the current episode may eventually play out. EPS for the S&P 500 fell 7.2% peak-to-trough from third quarter 1997 to fourth quarter 1998, contributing to a 19.3% market correction, on the cusp of a bear market and slightly more severe than the average non-recessionary decline, though less severe than the 28% average bear market correction during past economic recessions since 1950. A strong US economy in 1998 stood in stark contrast to economic crises taking place in the emerging markets, most notably Southeast Asia and Russia, at that time. Weak emerging markets demand triggered falling commodity prices which, when combined with a rapidly appreciating US dollar from 1996 to 1998, crimped the profits of natural resources companies and other multinationals. Importantly, in 1998 the Fed had some flexibility to support the business cycle through rate cuts, helping to mitigate the market sell-off’s impact on the real economy. Today, of course, Fed policymakers have much less flexibility.
As in 1998, the US economy today shows few signs of an imminent recession, though the US equity market is now in the midst of an earnings recession. Recent earnings softness—largely driven by sharply falling energy and materials sector profits due to lower commodity prices resulting from China’s economic slowdown—masks more resilient fundamentals within other sectors. While current-year earnings growth expectations have been downgraded across the market, for now they remain positive across all sectors save energy, materials, and industrials. Furthermore, corporate profit margins remain near record levels, and several sectors are still forecast to generate double-digit earnings growth this year. As a result, the current earnings dip is not necessarily a harbinger of a non-recessionary bear market, nor one associated with an outright economic recession, particularly if China is able to continue managing its slowdown at a controlled pace and if current economic policy in Europe and Japan proves successful in reviving those economies. Such a scenario would likely allow the US economy to avoid an economic recession and could prevent the market from experiencing a more severe bear market correction.
Valuations
Despite the recent correction and following the October rally, US equities still look expensive on most metrics, likely foreshadowing below-average future returns over intermediate time periods (five to 15 years). The S&P 500 Index’s Shiller P/E stood at 26.1 as of October 31, 2015, ranking in the 91st percentile of all quarterly observations dating back to 1910. When equity valuations have been at similar levels in the past, the market has averaged real annualized returns of 1% over subsequent ten-year periods (Figure 10).
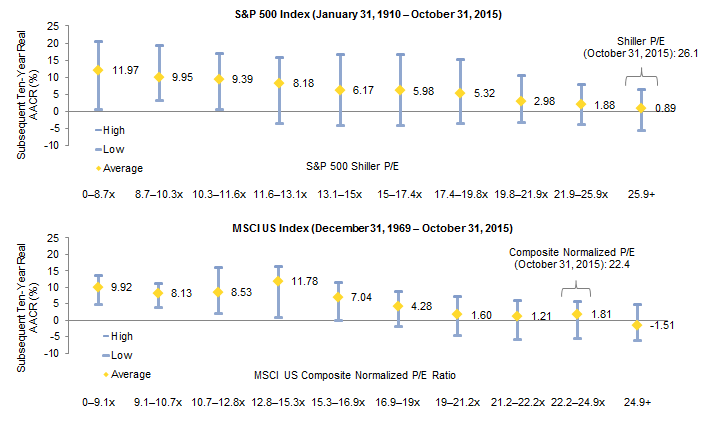
Figure 10. Ten-Year Subsequent Returns by Valuation Decile
Sources: Global Financial Data, Inc., MSCI Inc., Robert J. Shiller, and Standard & Poor’s. MSCI data provided “as is” without any express or implied warranties.
For those skeptical of assessing current market valuations relative to those from a century ago or longer and of relying too heavily on the Shiller methodology, our preferred composite normalized P/E metric using monthly data for the MSCI US Index stood at 22.4 as of October 31, 2015. This ranks in the 82nd percentile of monthly observations since December 31, 1969, a period over which the composition of the economy and stock market are arguably more similar. While this shorter time period magnifies the positive skew of the extreme late 1990s tech-bubble valuations, the data tell a very similar story as the longer Shiller P/E time series for the S&P 500. When valuations of the MSCI US have previously been at levels similar to today’s starting point, the index has subsequently returned a ten-year real annualized gain of just 1%–2% on average.
Concluding Thoughts
Past secular market cycles occurred within quite different environments in terms of geopolitics, demographics, market structure and composition, economic development, and policy frameworks. The period since the global financial crisis has been extraordinary as economic policymakers applied both time-tested methods as well as experimental initiatives in guiding the global economy past an outright collapse. Such an environment has been unprecedented for global capital markets and US equities in particular, given the vast expansion of the Fed’s balance sheet and associated zero-interest rate policy. The US economy also continues to experience a historic period of low, stable inflation. As a result, any conclusions drawn from comparisons of the current stock market cycle with past secular market patterns should be tempered to some extent.
Regardless of whether the market remains in a secular bear or is now enjoying a new secular bull, more risks exist for the market to the downside than the upside. These include the potential for an overseas economic crisis to spook investors or even drag the US economy into recession, the uncertainty of how markets will react to the Fed’s first expected rate hike, and the prospects for continued sluggish global growth and commodity prices that stay lower for longer. Current US equity valuations leave little margin for error. Whether examined versus the past 100-plus years or just the past 40, valuations at today’s levels have resulted in disappointing subsequent average ten-year real returns (below 2% annualized).
Michael Salerno, Investment Director
Daniel Day, Investment Associate
Footnotes