MLPs have had a volatile few months and yields have skyrocketed; investors with a long-term time horizon may find the sector appealing
- Yield-based and EBITDA-based valuation metrics continue to be compelling, suggesting the sector may be undervalued.
- The market is not without risk. Investors should keep in mind potential downside risks, particularly in light of the current energy market stresses.
- We prefer midstream MLPs with high-quality assets. New allocations or overweights should be funded from other natural resources–related assets.
Please see Kevin Rosenbaum et al., “Energy MLPs: Attractive Yields in a Time of Uncertainty,” Cambridge Associates Research Note, October 2015, and the fourth quarter 2015 edition of VantagePoint by Celia Dallas, published October 14, 2015.
In October we highlighted our view that energy master limited partnerships (MLPs) were attractive investments for long-term investors, following a backup in prices that improved valuations. At that time, the yield of the benchmark Alerian MLP Index stood at 8.3%, a high level compared to the index’s history. Since then, lower oil prices, distribution cut fears, and technical pressures have continued to challenge the sector, sending yields at the end of January to 9.6%. While we don’t expect the jarring volatility to subside in the near term, we do believe an investor accessing the sector at current valuations may be rewarded in the long term. In this note, we provide an update on sector performance, the current market environment, possible downside risks, and implementation considerations.
Sector Performance
In 2015, the Alerian MLP Index had its second-worst calendar year result, as fears linked to a global glut in oil supply overwhelmed unit prices. In all, the benchmark lost 32.6% on a total return basis and flirted briefly in mid-December with dethroning 2008’s record losses. Emblematic of the stresses in the sector, the Alerian in the fourth quarter sustained three price swings of greater than 10 ppts each, only to finish the quarter with a small loss (Figure 1). Market participants, including us, have been surprised by the level of volatility. So what happened in the sector?
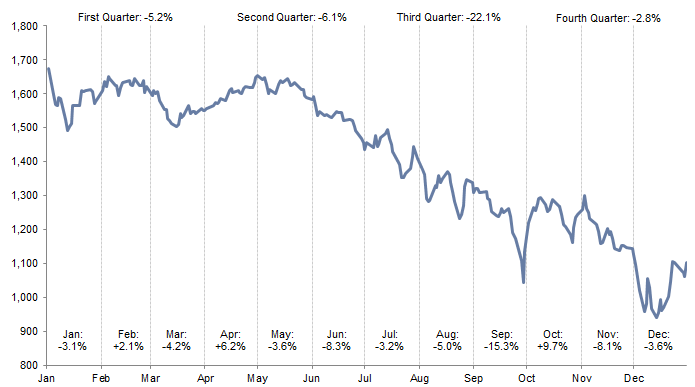
Figure 1. Performance of Alerian MLP Total Return Index in 2015
Sources: Alerian and Thomson Reuters Datastream.
Note: Data are daily.
Broadly, the collapse in oil & gas prices early last year raised concerns about whether the rapid growth associated with the shale revolution is sustainable. In the five-year period ending December 31, 2014, the MLP sector’s market capitalization doubled to nearly $500 billion, with the number of partnerships jumping from 72 to 124, as domestic oil & gas production linked to unconventional drilling techniques surged. With the hope for a quick commodity price rebound fading in mid-2015, the market’s concern about the sustainability of the sector’s high level of growth was heightened as analysts increasingly questioned capital markets access and balance sheet health. As the year drew to a close, unit prices were also hit by technical pressures from retail tax loss harvesting, institutional fund rebalancing, hedge fund positioning, and margin sales.
Upstream MLPs found themselves most exposed to the difficulties of 2015. Close to the wellhead, upstream partnerships focus on exploration & production (E&P) activities, and as a result, tend to be more correlated to commodity prices than midstream MLPs. In 2015, a benchmark for the subsector, the Wells Fargo E&P Total Return Index, sank 80% as all upstream MLPs were forced to either cut or suspend distributions. While E&Ps made up only a small slice of the entire MLP sector at the start of 2015, by the end, they made up less than 1% of the Alerian’s market capitalization. Despite their modest size, the negative sentiment linked to E&Ps undercut midstream storage and transportation partnerships, which by contrast account for more than 90% of the index.
From its August 2014 peak to its January 2016 trough, the current drawdown of the Alerian MLP Index is the most severe in the benchmark’s 20+ year history (Figure 2). Returning -57.1%, the current period recently outstripped the losses that occurred during the global financial crisis (-50.6%). Although driven by different factors, the current drawdown’s level of returns and duration of time are similar to the 2007 to 2009 drawdown. This commonality certainly doesn’t preclude unit prices from falling further, but it does raise a question—how close are prices to a bottom?
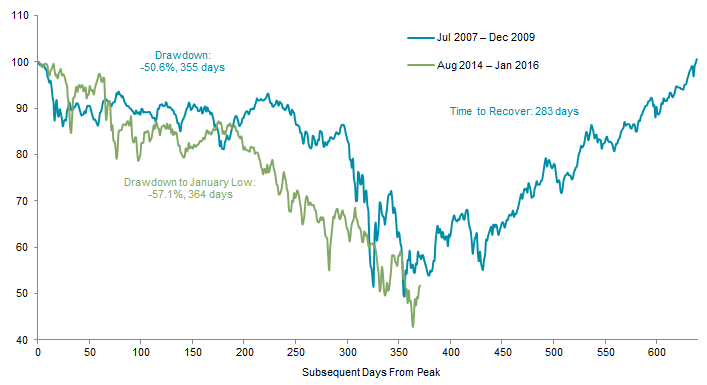
Figure 2. Severity and Duration of Worst MLP Drawdowns
Sources: Alerian and Thomson Reuters Datastream.
Notes: Data are based on daily values of the Alerian MLP Total Return Index.
Current Market Environment
In 2016, we expect concerns about capital markets access, balance sheet health, and distribution growth to continue to shape the sector. To some extent, these factors are linked to the price of oil at present, the continued slide of which has forced market analysts to regularly revisit assumptions. While we believe in the long-term US energy infrastructure story that underpins the MLP sector, the closer relationship between oil and partnerships suggests to us volatility in the sector is unlikely to subside in the near term. But as we have discussed in prior publications, the broad sell-off across the energy space has created attractive opportunities in MLPs for the long-term investor.
Still, the sector is not without risk. The amount of public capital raised has dropped off significantly in recent quarters, as the cost of capital increased, with the amount raised in fourth quarter 2015 falling to its lowest level since 2008 (Figure 3). Without new capital, partnerships may be challenged to grow because they typically pay out most of their internally generated cash flow in the form of distributions. However, the aggregate debt and capital raised in 2015 was the third-highest amount, and on a percentage of market capitalization, appears to remain near a healthy level. Recently, a growing number of partnerships have secured private sources of capital on decent terms as well.
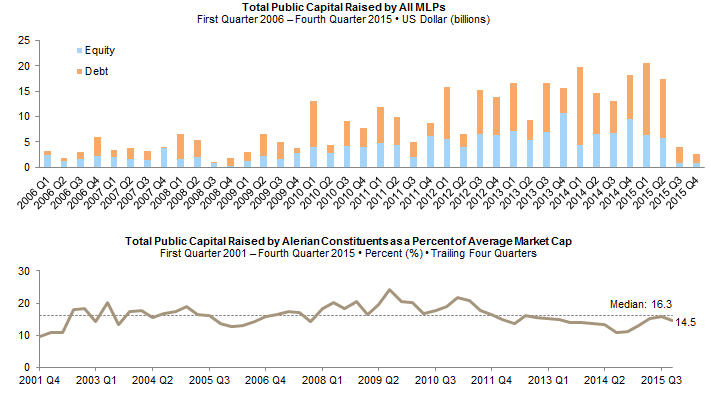
Figure 3. MLP Financing
Sources: Dealogic and FactSet Research Systems.
Notes: Capital raised excludes funds raised from private sources. Dealogic updates its database on a regular basis, therefore historical data may change.
The higher cost of capital undoubtedly impacts growth assumptions, as management teams are forced to deal with higher hurdle rates to make capital projects profitable. Many teams are weighing whether to reduce or temporarily suspend distributions to either “self-fund” growth projects or improve balance sheet positions. No midstream MLP cut its distribution in 2015, though a small midstream partnership announced a decision to cut in January, and more could follow suit. While balance sheets appear to be consistent with historical levels for the sector (Figure 4), as many high-quality names having reasonable debt levels and maturity schedules, some partnerships’ positions are indeed stretched.
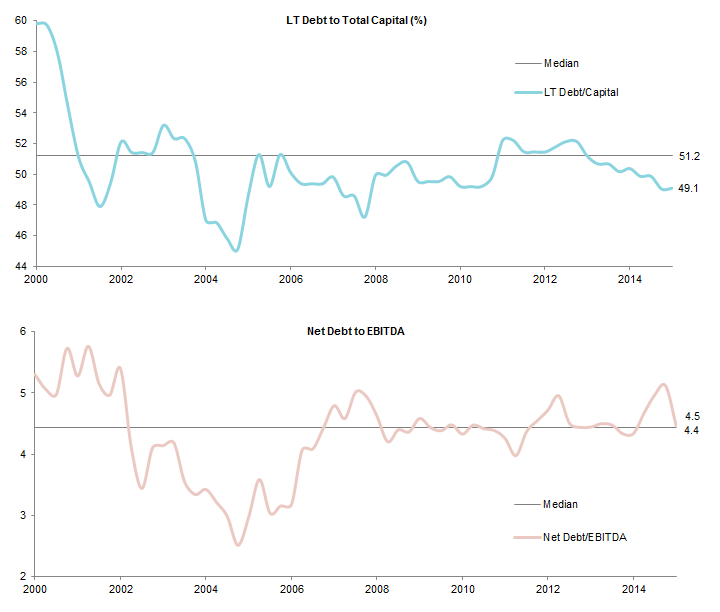
Figure 4. Debt Fundamentals of Alerian MLP Index
Fourth Quarter 2000 – Fourth Quarter 2015
Source: FactSet Research Systems.
Notes: Data are quarterly values on trailing 12-month basis. Fourth quarter 2015 values are estimates.
Forecasts for distribution growth have come down from a year ago, but analysts continue to be optimistic about the next few years (Figure 5). In fact, the median distribution growth rate among all energy MLPs is expected to be 4.7% per year for the next three years, according to a January report by Wells Fargo. This estimate largely lines up with the consensus opinion due in part to the high degree of visibility into growth projects. Interestingly, in the years when growth slowed considerably (2000, 2009, and 2010), total returns were higher than the sector’s average level of returns.
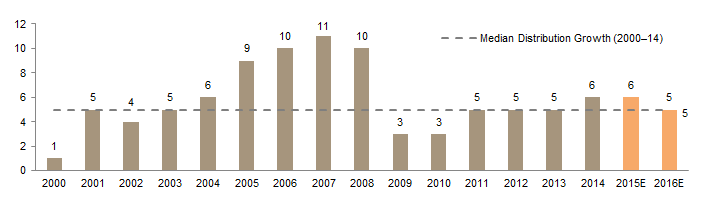
Figure 5. Median Distribution Growth of Wells Fargo MLP Index
January 7, 2016 • Percent (%)
Sources: Bloomberg L.P. and Wells Fargo Securities, LLC.
Notes: Orange bars are estimates. Distribution growth is based on year-over-year change in median distribution. The Wells Fargo MLP Index is a float-adjusted, capitalization-weighted index that seeks to measure the performance of all energy MLPs listed on the NYSE or Nasdaq that satisfy market capitalization (at least $200 million at the time of inclusion) and other eligibility requirements.
To what extent are investors currently being paid to accept risks linked to capital markets access, balance sheet health, and distribution growth? The sector’s price decline has improved valuation metrics. The Alerian yield and spread over Treasuries and credits are high relative to their histories, suggesting the sector may be undervalued (Figure 6). When valuations have been as stretched as they are now, the sector has typically delivered hefty returns in the subsequent one-year period. While EBITDA-based multiples also suggest valuations are attractive, the sector’s best opportunities probably reside in those midstream partnerships with high-quality assets.
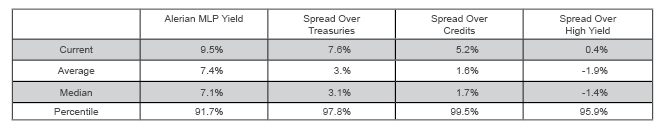
Figure 6. MLP Yield Statistics
January 2, 1996 – January 31, 2016
Sources: Alerian, Barclays, and Thomson Reuters Datastream.
Notes: Data are daily. Yields of Alerian MLP Index, ten-year US Treasury, Barclays US Aggregate Credit BAA, Barclays US Corporate High Yield, and Barclays US Corporate High Yield Energy used. The current yield of the Alerian MLP Index may change slightly when published officially the week of February 7, 2016.
Downside Risks
Every investment has risks, and investments with ties to the energy complex feel particularly risky today as oil prices have fallen farther than many expected, and most commentators either see further falls ahead or a stabilization at prices around current levels for an extended period. Those considering initiating or adding to an investment in MLPs today need to have an understanding of the risks facing the sector and how bad it could get.
Counterparty Risk. One of the assumptions underpinning our argument that buying high-quality midstream MLPs at these prices looks like a good long-term investment is that the volume of commodities stored and transported by the midstream subsector will not be broadly threatened by bankruptcies among upstream E&Ps. With oil prices near $30 per barrel and Iranian supplies hitting global markets, a prolonged period of low prices will increase counterparty risks for any number of partnerships, as bankruptcies potentially threaten the amount of oil & gas midstream partnerships store and transport.[1]According to the US Energy Information Administration, while oil production is expected to fall from an average of 9.4 million barrels per day last year to 8.7 million barrels per day this year, … Continue reading For E&Ps that reorganize, midstream partnerships may be considered “critical vendors” by bankruptcy courts, affording them protection against resetting tariffs below market rates.
Re-contracting Risk. Low oil prices could make midstream MLPs more susceptible to contract revisions with upstream producers. In recent months, contract revisions have been limited, but when negotiations have resulted in revised economics, it has been in exchange for some enhancements for the midstream companies such as longer-lived contracts, more acreage dedication, and more volume commitments. While midstream operations remain essential for the producers to get their production to market, the degree to which contract renegotiations are positive or negative will be situation dependent.
Re-rating Risk. In recent months, some analysts have suggested that MLPs could be “re-rated” to look more like utilities. They argue that if the sector is unable to sustain high levels of growth like in years past, it should be valued like other mature infrastructure asset classes. Using recent EV/EBITDA valuation multiples, a re-rating would imply immediate losses in the MLP sector of ~20%. However, yields for MLPs and utilities are structurally different due to the tax advantage afforded to the former, making such a re-rating inappropriate in our view.
How Bad Could It Get? Forecasting a reasonable downside case is not easy, as detractors may simply suggest the envisioned environment is not severe enough. Still, we have analyzed potential returns over a three-year holding period assuming different annual distribution growth rates and exit yields, some draconian (Figure 7). An investor purchasing MLPs with a starting yield of 8.0% (near the benchmark yield at year end) would see ~17% average annualized compound returns over three years assuming yields revert to the median (7.1%) and annual distribution growth is near analysts’ forecasts of 5%. In a more difficult scenario where distribution growth falls by 5% annually for the next three years—something that has never happened for the Alerian Index—and yields increase slightly to 8.4%, the three-year AACR drops to a low but still positive ~2%. In the most draconian scenario, where distribution growth falls by 15% annually and yields hit their historical maximum (15.2%), losses amount to ~21% per year.
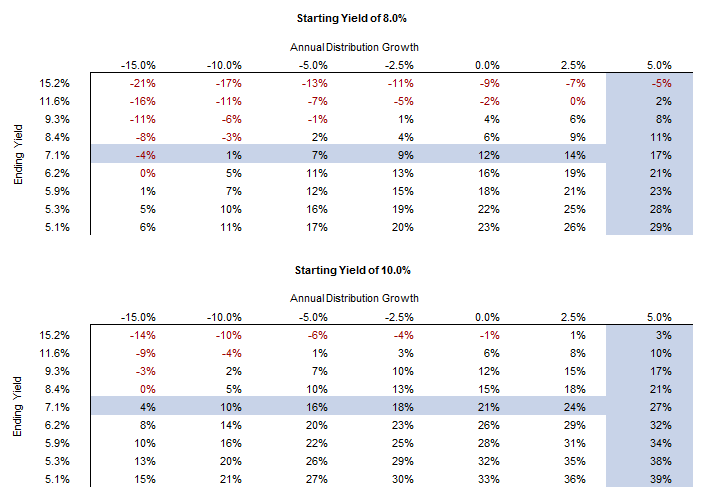
Figure 7. MLP Sensitivity Analysis: Three-Year AACRs
Source: Alerian.
Notes: The two tables highlight performance over a three-year period of a hypothetical MLP investment based on different annual distribution growth rates and exit yields. The starting yields of 8% and 10% are meant to proxy the year-end 2015 yield and current yield of the Alerian MLP Index. Ending yields selected represent the maximum, median, and minimum yields of the Alerian, as well as its 99th, 90th, 75th, 25th, 10th, and 1st percentile yields.
Scenario analysis of this nature depends not only on the assumptions (our simplifying assumptions include no fees and distributions paid annually and reinvested) but also on the investment’s yield on the day of purchase, with higher starting yields leading to better returns as noted in the second table of Figure 7, which assumes a starting yield of 10%, closer to yields on the Alerian in January. While assessing potential absolute losses is helpful, investors also need to consider what opportunities they would forgo to fund an allocation to MLPs.
Implementation Considerations
We recommend funding new allocations or overweights from other natural resources–related assets rather than from broad equities. For investors that believe distribution growth will not fall more than 5% a year over the next three years and that yields will ultimately move back toward the 7% level, the potential returns shown in Figure 7 look reasonable. While the upside potential for natural resources equities is probably similar, and perhaps even better in a rapid oil price recovery, we believe MLPs are likely to outperform in stressed conditions. To us, MLPs—as fee-based infrastructure operators—shouldn’t have close ties to oil prices.
Although we believe market forces are at work correcting the supply imbalance as the significant drop in global E&P capex last year suggests, we are not market timers and won’t call a bottom in oil prices. Historically, MLPs have been more correlated to equity markets than oil markets, for good reason—partnership fees are based more on volumes than price, and the majority of MLPs have exposures to natural gas, natural gas liquids, and refined products, not crude oil. But in the last year, short-term correlations between partnerships and oil prices have jumped to above their long-term level (Figure 8), as concerns about plummeting oil prices sent many investors to sell their MLP exposure. For natural resources equities, the same is also true—short-term correlations to oil jumped and are now higher than correlations to equities. However, the longer-term correlation of natural resources equities to oil is higher than that for MLPs. We expect investors to return to distinguishing MLPs from the rest of the energy sector, sending correlations back down to their lower levels.
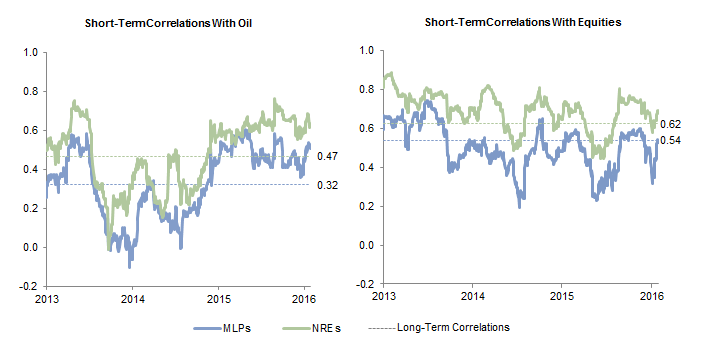
Figure 8. Short-Term Correlations of MLPs and NREs With Oil and Equities
January 1, 2013 – January 31, 2016
Sources: Alerian, Standard & Poor’s, and Thomson Reuters Datastream.
Notes: Data are rolling 65-day correlations using daily returns of the Alerian MLP Total Return Index. Natural resources equities (NREs) are represented by a 80/20 mix of Datastream World Oil & Gas and Datastream World Mining Total Return Indexes. Equities are represented by the S&P 500 Total Return Index. Oil is represented by WTI Crude Oil. Dotted lines represent long-term correlations from December 31, 1999, to January 31, 2016.
The universe of MLPs includes a diverse set of businesses involved in the extraction, processing, refining, and distribution of various energy resources. While valuations appear to be compelling for the sector, the market is likely to continue to be volatile, with partnerships close to the wellhead, highly levered, and/or exposed to uneconomic basins at risk of further losses. To us, midstream partnerships with high-quality assets present the best risk/reward opportunity in the listed energy space, and, as a result, we recommend implementing allocations to MLPs through active managers with the expertise to distinguish the good from the bad, rather than through a passive investment mimicking an index.
Concluding Remarks
The high level of uncertainty in oil markets is likely to continue to drive MLP prices in the near term, and the sector could lose more ground. But we view current yields as an attractive entry point to potentially capture outsized returns over the next three to five years. Given that some partnerships are better positioned than others, active managers should be able to identify partnerships with high-quality assets that can be more defensive than the broad sector. Although the last year was indeed challenging, we see opportunities in the pipeline.
Kevin Rosenbaum, Investment Director
Nroop Bhavsar, Senior Investment Associate
Footnotes