Markets were skittish in April as Eurozone stocks paused to catch their breath after a strong recent rally and US equities barely budged given softer economic data and an awareness of stretched valuations. Weaker data encouraged some investors to unwind what had been very successful bets on the US dollar, despite Treasury yields moving higher on the month. Oil soared for similar reasons as speculators trimmed shorts, but doubts remain about a sustainable recovery. The extremely positive tone for emerging markets stocks contrasted with developed markets ambivalence, though whether Chinese equities should be so well bid given cuts to earnings and economic growth forecasts is an open question.
April saw many assets struggle to build on their strong first quarter start, as equities sold off during the last days of the month, bond yields rose, and the US dollar fell against all six other major currencies for the first time since June 2014. Despite some volatility developed markets equities eked out a 1.0% return, though emerging markets fared much better (5.7%) and posted their best monthly return since January 2012. Emerging markets are now ahead of developed markets year-to-date.
US economic data appeared to weaken in April; an initial estimate showed that first quarter GDP barely expanded and job creation in March was well below expectations. Weak starts to the year are not unusual; J.P. Morgan has noted that first quarter GDP growth on average has been 160 bps below that of other quarters for the past 20 years. First quarter growth was also disappointing last year but then surged over the subsequent six months. Other statistics continue to paint a more promising picture. Average job creation has been over 260,000 during the last six months and applications for jobless benefits recently fell to their lowest levels in 15 years, while consumer spending rose in March, posting its biggest gain since November.
The main risk for US equities (1.0% in April) is not the economy but valuations, which look stretched on both a short-term and normalized basis, especially since earnings growth appears to be stalling. Headlines that the majority of US companies are beating first quarter estimates appear promising, until one realizes how low the bar was set and considers that the consensus now expects less than 2% earnings growth for major US indexes in 2015. Valuations are a particular concern for small-cap stocks (-2.6%), which now trail large caps year-to-date. Bulls had hoped small companies would be relatively insulated from headwinds like the strong dollar and from a diminished exposure to the energy sector, but seem to have overlooked a trailing P/E multiple that is almost 50% above historical averages and a normalized metric that looks even more stretched.
Eurozone equities posted a minor loss (-1.5% in euro terms) in April; a pause was perhaps overdue given strong returns in the last several months—year-to-date Eurozone equities have returned 16.9%. European earnings continue to look healthier than those in other regions; Stoxx 600 companies are expected to post earnings growth of around 8.5% during first quarter, while S&P 500 earnings are expected to slightly contract. For 2015, Eurozone earnings are expected to grow almost 20%, though overall European growth may be weaker given a drag from markets like the United Kingdom and Switzerland. Eurozone economic data also seem to be benefitting from the cheaper currency and improving business confidence. Headlines such as Spain raising its growth projection for 2015 to 2.9% and deflation ending can be contrasted with those about how the strong franc is dampening Swiss growth. The Greek debt drama persists, though over the past several days it appears that both parties may be inching closer to a deal in part because government cash balances are running so low.
Outside the Eurozone, UK equities (3.3%) narrowed some of their underperformance versus peers as worries over the upcoming election seemed to fade. Aside from election uncertainty, a variety of concerns have weighed on this market in recent months, including large index exposures to commodities and slowing emerging markets. Whatever political coalition emerges in early May will face difficult choices—the size of the twin deficit (budget and current account) is large and this may again pressure sterling as well as gilt yields.
Chinese equities (16.6%) continued to set the pace for emerging markets stocks and have now returned over 48% during the past 12 months. Some analysts seem skeptical of the rally given economic data continue to soften and earnings forecasts have been steadily trimmed in recent months. However, Chinese valuations do not appear challenging, interest rate cuts may bolster growth, and speculative fever may not die down in the near future. Emerging markets equity returns were also lifted by Brazilian equities (9.6%), where Petrobras soared after it finally released audited financials, reducing concern about a technical default on its extensive borrowings. Higher commodity prices assisted exporters such as Russia (6.6%), which also benefitted from easing tensions in Ukraine.
The massive recovery in commodity prices (11.1%) drew parallels to the surge in Chinese equities, with a wide divergence of opinion as to its sustainability. Spot oil prices rose over 20% during the month as expectations for future US supply fell given lower rig counts and capital expenditure budgets. Saudi airstrikes on key transport hub Yemen also played a role. However, skeptics noted that US oil inventories have surged and many wells could quickly come back on line, which explains in part why near-term oil contracts rose more than longer-term equivalents. US REITs, the top-performing major asset class in 2014, dropped nearly 5% in April as rates backed up and returns are now in the red year-to-date for the first time since 2009.
A final key story in April was that the US dollar rally paused to catch its breath, given weak economic releases and the extension of timelines for when the Federal Reserve might next hike rates. The dollar sank around 4% against the euro and close to this against the pound, generating gains on unhedged investments for US investors in local equities. The dollar was relatively stable against the yen, however, as the Bank of Japan refrained from additional easing. Dollar valuations had looked stretched and much will depend on whether the US slowdown proves temporary, but the flipside is that the European Central Bank and others will be loath to see recent tailwinds fade from their weak currencies, and further easing can’t be ruled out.
Chinese equities have rallied recently and the A-share market has surged, benefitting from rising domestic investor demand; Indian equities have stalled as valuations are higher and investors await further progress on structural reforms
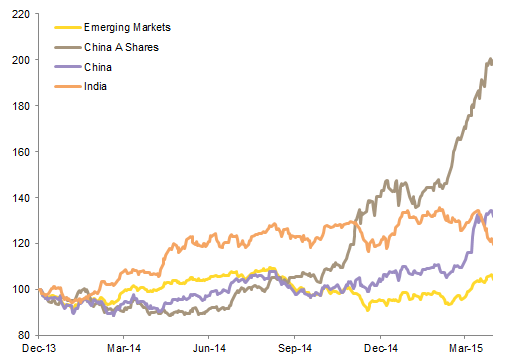
Performance of EM Equities
December 31, 2013 – April 30, 2015 • December 31, 2013 = 100 • Local Currency
Sources: MSCI Inc. and Thomson Reuters Datastream. MSCI data provided “as is” without any express or implied warranties.
Note: Data are daily.
Returns for European equities have easily outpaced those for US equivalents in 2015 but have trailed over longer time periods
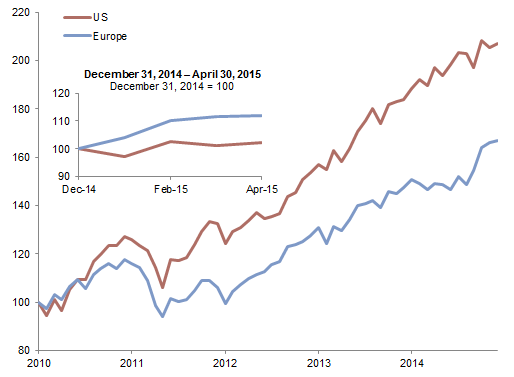
Cumulative Wealth of European and US Equities
May 31, 2010 – April 30, 2015 • May 31, 2010 = 100 • Local Currency
Sources: MSCI Inc. and Thomson Reuters Datastream. MSCI data provided “as is” without any express or implied warranties.
US small caps under-performed in April as hopes for superior earnings growth faded; stretched valuations suggest future gains will be minimal
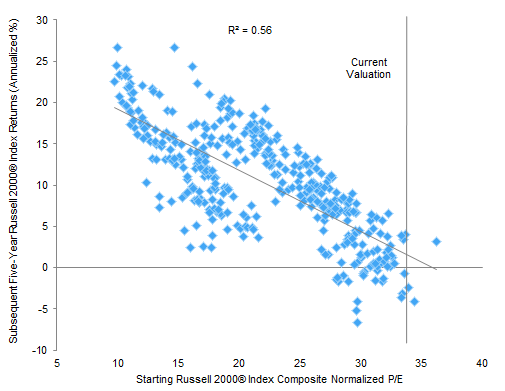
Russell 2000® Index Starting Valuation and Subsequent Five-Year Returns
December 31, 1978 – March 31, 2015
Sources: Frank Russell Company and Thomson Reuters Datastream.
Whatever the outcome of the forthcoming UK election, the victors will have to make tough choices given sizable twin deficits

UK Deficit as a Percentage of GDP
First Quarter 2005 – Fourth Quarter 2014
Sources: Bloomberg L.P., OECD, and Thomson Reuters Datastream.
Note: Fiscal account data are annual and current account are quarterly.
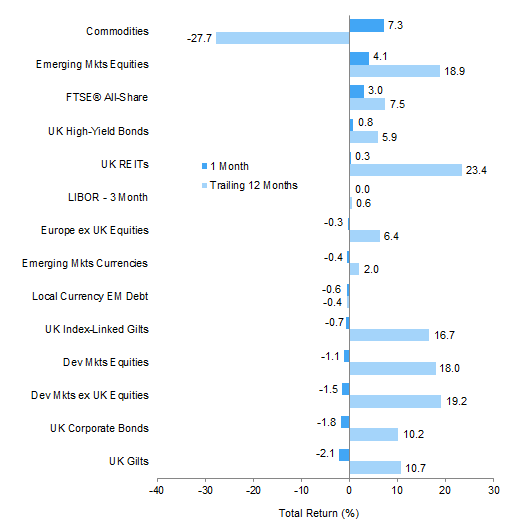
Commodities soared in April, as hopes grew that US oil production would taper off and instability in the Middle East raised concerns over global supply. Emerging markets stocks also posted strong gains as China soared and higher commodity prices boosted exporters. Bonds posted minor losses despite weaker economic data, in part because tighter labor markets are generating fears over wage inflation
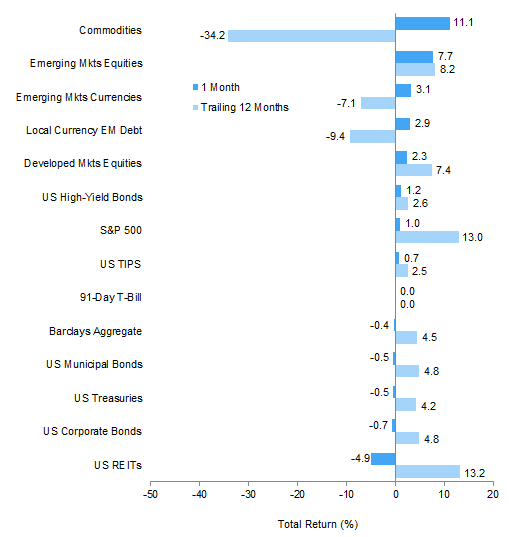
Index Performance (US$)
As of April 30, 2015
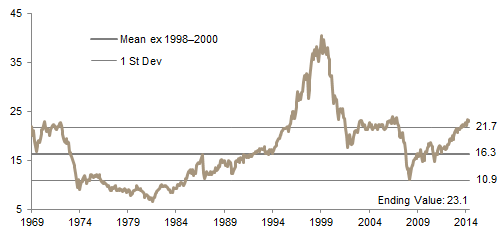
MSCI US Composite Normalized P/E
December 31, 1969 – April 30, 2015
Sources: Barclays, BofA Merill Lynch, FTSE International Limited, J.P. Morgan Securities, Inc., MSCI Inc., National Association of Real Estate Investment Trusts, Standard & Poor’s, and Thomson Reuters Datastream. MSCI data provided “as is” without any express or implied warranties.
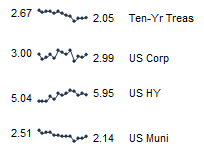
Fixed Income Yields
April 2014 – April 2015
European equities took a breather from their recent strong performance despite reasonably positive earnings releases and some stronger economic data; in contrast, government bonds sold off as high-profile fund managers warned that negative yields made for attractive shorts, and speculation rose that the ECB would curtail early its expansion of QE
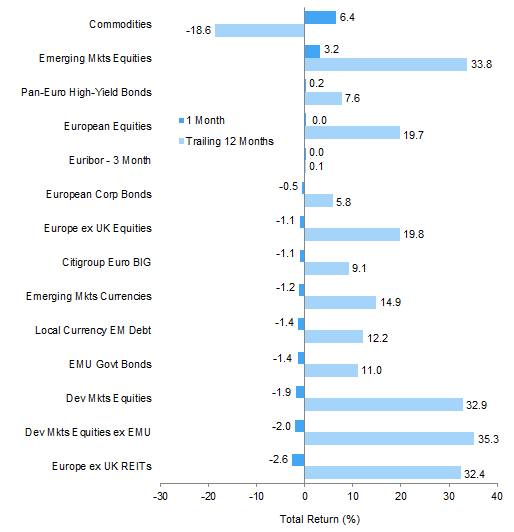
Index Performance (€)
As of April 30, 2015
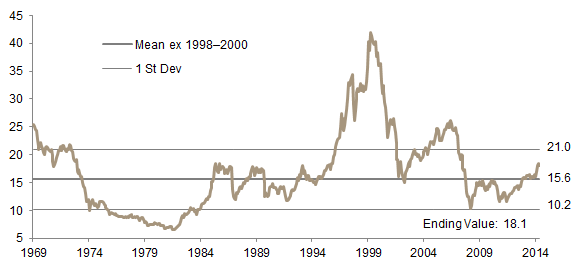
MSCI Europe ex UK Composite Normalized P/E
December 31, 1969 – April 30, 2015
Sources: Barclays, Bloomberg L.P., BofA Merill Lynch, Citigroup Global Markets, EPRA, FTSE International Limited, MSCI Inc., J.P. Morgan Securities, Inc., National Association of Real Estate Investment Trusts, Standard & Poor’s, and Thomson Reuters Datastream. MSCI data provided “as is” without any express or implied warranties.
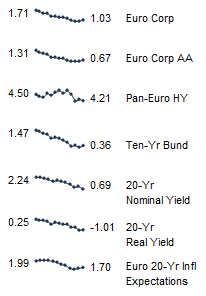
Fixed Income Yields
April 2014 – April 2015
UK equities rebounded in April as earnings releases were generally well received and as concerns died down over the upcoming elections. Given sterling strength, local investors without currency hedges have actually been better off in local than other European equities over the past 12 months
Index Performance (₤)
As of April 30, 2015
Sources: Bank of England, Barclays, BofA Merrill Lynch, EPRA, FTSE International Limited, J.P. Morgan Securities, Inc., MSCI Inc., National Association of Real Estate Investment Trusts, Standard & Poor’s, and Thomson Reuters Datastream. MSCI data provided “as is” without any express or implied warranties.

MSCI UK Composite Normalized P/E
December 31, 1969 – April 30, 2015
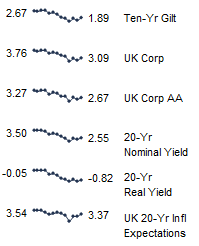
Fixed Income Yields
April 2014 – April 2015
While the dollar weakened against most developed and emerging markets currencies in April after timelines were pushed back for future Fed rate hikes, performance over the last 12 months remains impressive
The euro recovered some ground in April as economic data were well received and as fears of a Grexit faded; it will take several months of similar gains to regain its lost ground against currencies like the dollar
Sterling rebounded from undervalued levels against most peers in April as election uncertainty faded, but the large current account deficit means further weakness can’t be ruled out
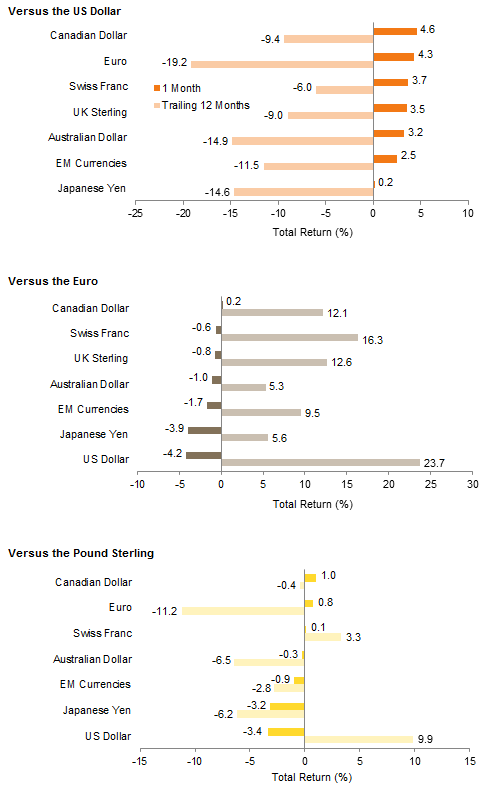
Currency Performance
As of April 30, 2015
Sources: MSCI Inc. and Thomson Reuters Datastream. MSCI data provided “as is” without any express or implied warranties.
Note: EM currencies is an equal-weighted basket of 20 currencies.
Exhibit Notes
Performance Exhibits
Total returns for MSCI developed markets indexes are net of dividend taxes. Total returns for MSCI emerging markets indexes are gross of dividend taxes.
US dollar index performance chart includes performance for the Barclays Corporate Investment Grade, Barclays High Yield Bond, Barclays Municipal Bond, Barclays US TIPS, Barclays US Treasuries, BofA Merrill Lynch 91-Day Treasury Bills, FTSE® NAREIT All Equity REITs, J.P. Morgan ELMI+, J.P. Morgan GBI-EM Global Diversified, MSCI Emerging Markets, MSCI World, and S&P GSCI™ indexes.
Euro index performance chart includes performance for the Barclays Euro-Aggregate: Corporate, Barclays Pan- Euro High Yield, Citigroup EMU Govt Bonds, FTSE® EPRA/NAREIT Europe ex UK RE, J.P. Morgan ELMI+, J.P. Morgan GBI-EM Global Diversified, MSCI Emerging Markets, MSCI Europe, MSCI Europe ex UK, MSCI World ex EMU, MSCI World, and S&P GSCI™ indexes.
UK sterling index performance chart includes performance for the Barclays Sterling Aggregate: Corporate Bond, BofA Merrill Lynch Sterling High Yield, FTSE® British Government All Stocks, FTSE® British Government Index- Linked All Stocks, FTSE® EPRA/NAREIT UK RE, J.P. Morgan ELMI+, J.P. Morgan GBI-EM Global Diversified, MSCI Emerging Markets, MSCI Europe ex UK, MSCI World, MSCI World ex UK, and S&P GSCI™ indexes.
Valuation Exhibits
The composite normalized P/E ratio is calculated by dividing the inflation-adjusted index price by the simple average of three normalized earnings metrics: ten-year average real earnings (i.e., Shiller earnings), trend-line earnings, and return on equity–adjusted earnings. We have removed the bubble years 1998–2000 from our mean and standard deviation calculations. All data are monthly.
Fixed Income Yields
US fixed income yields reflect Barclays Municipal Bond Index, Barclays US Corporate High Yield Bond Index, Barclays US Corporate Investment-Grade Bond Index, and the ten-year Treasury.
European fixed income yields reflect the BofA Merrill Lynch Euro Corporate AA Bond Index, BofA Merrill Lynch Euro Corporate Bond Index, Barclays Pan-European Aggregate High Yield Bond Index, Bloomberg Twenty-Year European Government Bond Index (nominal), ten-year German bund, 20-year European Inflation Swaps (inflation expectations), and the real yield calculated as the difference between the inflation expectation and nominal yield.
UK sterling fixed income yields reflect the BofA Merrill Lynch Sterling Corporate AA Bond Index, BofA Merrill Lynch Sterling Corporate Bond Index, UK ten-year gilts, and Bank of England 20-year nominal, real, and zero coupon (inflation expectations) yields.