Many factors contributed to the global financial crisis, but an excessively high level of indebtedness built up over many years was a crucial one. Although the crisis first blew up in the US housing and mortgage markets, the receding tide of liquidity revealed many other exposed debtors, especially within the Eurozone.
In the aftermath of the crisis, markets braced for a deleveraging cycle across developed nations, particularly in the United States and Europe. Over six years later, the United States has succeeded in combining some deleveraging with modest growth and a healing of the job market relative to the high levels of unemployment from 2010. In contrast, the Eurozone’s pursuit of an austerity policy that combined the slashing of government budget deficits with minimal or even negative wage growth has threatened to plunge the region into a debt deflationary spiral. Unemployment has hardly come down from its 12% peaks, and leverage has remained uncomfortably elevated as growth has faltered. How far along the deleveraging road is Europe, and does the debt matter? The answer has implications for the prospects for recovery.
Debt Distribution in the Eurozone
Winding back the clock to the financial crisis, debt affected the peripheral European countries differently. Ireland and Spain buckled under excessive real estate–related bank debt; Greece and Italy ran into funding problems due to high public sector debt loads; and Portugal suffered from steep corporate and household debt as consumers went on a borrowing binge at low interest rates after joining the euro. Comparing 2007 to 2014, leverage is far higher than before the crisis. Ireland’s total debt (excluding the financial sector) has exploded to nearly 390% of GDP, followed by Portugal at 358%, and Greece at 317%.
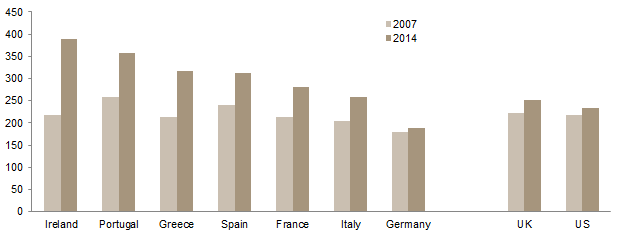
Total Debt-to-GDP: 2007 vs 2014
Percent (%)
By sector, Ireland is the only one of the peripheral countries with high household debt in 2007 (Portugal and Spain are the others) that has succeeded in reducing the level by any meaningful amount and, at 85%, its level is still the highest in the periphery. Household debt has increased since the crisis in Greece and Italy—substantially in Greece. In other words, not much has happened to reduce the vulnerability of household finances in Europe, apart from the reduced cost of debt service, courtesy of record low rates.

Debt-to-GDP by Sector: 2007 vs 2014
Government debt has increased dramatically for all the peripheral countries (as well as for France) even after years of austerity policies. The crisis caused many budget deficits to blow out due to automatic stabilisers and the rescue of distressed financial institutions. Superimposing austerity policies to try to contain, if not reverse, the growth in government debt on top of an environment of weak demand as the private sector retrenched probably delayed economic recovery in some large Eurozone countries such as France and Italy, but also Portugal and, most obviously, Greece. Against a backdrop of stagnant or falling nominal GDP, continuing budget deficits, even at a reduced rate, have added to the public debt pile relative to the economy. In fact, despite austerity policies, budget deficits have remained elevated in 2014 with the exception of Greece.

Growth in Government Debt
2007–14 • 31 December 2007 = 100

Budget Deficit as a Percentage of GDP
By country, Ireland and Portugal stand out with high levels of debt in total and across sectors, while Italy has grown its debt since 2007 but still ranks much lower than peers. Spain has modestly reduced debt levels since the crisis across all sectors save the government, contributing to the growth in its total debt-to-GDP ratio. Greece ranks below Ireland and Portugal on a total debt basis, but its government debt is far above peers. Compared to the periphery, France ranks below all but Italy on a total debt basis, though its corporate debt levels are relatively high. Germany, by contrast, has very low debt levels in total and across sectors. Interestingly, the individual countries’ growth rates seemingly bear little relationship to debt levels. France and Italy have had inferior growth to Ireland and Spain. Ireland’s total debt is the highest, and yet it has recovered smartly from the crisis, boasting 2014 growth higher than Germany’s. And highly indebted Portugal’s 2014 growth has beaten that of all its less-burdened peers except Germany.
History does provide examples of relatively painless recoveries from large accumulated public debt loads, such as the United Kingdom and United States post–World War II and Scandinavian countries in the 1990s. On past occasions countries with excessive leverage were able to grow their way out of debt. Europe’s anemic growth post-crisis as well as demographic and technological factors, however, may make a painless recovery more challenging to bring about this time around.
Greece: What Will Become of Its Government Debt?
Even as debt is higher than before the crisis, many countries in the European periphery have seen bond yields fall into line with nominal growth, thereby helping to stabilise the debt-servicing burden. Portuguese and Spanish growth is low but is positive and on an improving path. In contrast, Italy holds the lowest total debt load of the periphery but suffers from the most anemic growth rate. Ireland is seemingly the poster child for a successful bailout, with debt stabilised by decent nominal growth rewarded by lower rates. Greece is another matter.
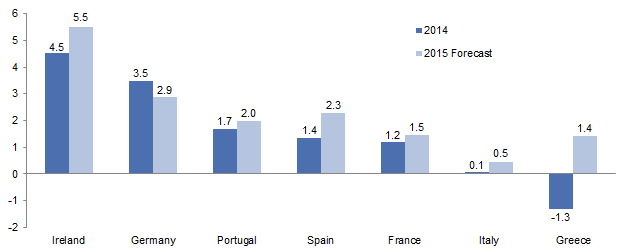
Nominal GDP Growth
Percent (%)
Since European Central Bank (ECB) President Mario Draghi uttered his famous “whatever it takes” speech, markets have believed that he could use the ECB’s potentially unlimited firepower to support the government bonds of problem countries (by buying debt securities in the secondary market). However, the ECB can only carry out its promise in countries that abide by the conditions of austerity and reform prescribed by the northern European countries (principally Germany) in exchange for bailout packages. Greece’s election of a government that campaigned on a platform of rejecting the reform and bailout conditions of its predecessor has cut the virtuous circle of confidence that the country might be edging toward sustainable debt service.
With the largest public debt in the Eurozone at 183% of GDP, Greece is unlikely to be able to service its current obligations without a further injection of capital from its partners, and the standoff with official creditors since the election of the Syriza government has turned off the flow of further loans. Both growth and revenue from tax and planned privatisations have been below forecasts to the tune of over €20 billion. Further, according to the International Monetary Fund (IMF), even if the new government runs a smaller-than-planned primary budget surplus of 1.5% of GDP, it would need to find at least an additional €14.9 billion from elsewhere over three years. With Greek ten-year bonds yielding over 10%, the math clearly does not add up, dashing hopes of a smooth path in reducing the ratio of debt to GDP.
Because most of the debt is now owed to official creditors, including the ECB, IMF, and fellow Eurozone states, the risk of financial contagion should Greece either default or exit the euro is now relatively small. Ironically, that is one reason why it could do either—not much is at stake economically.
To believe that Greece can reduce its public debt load over any reasonable period of time requires heroic assumptions, so creditors can be forgiven for wondering whether to throw more good money after bad. The likelihood is that—short of a Greek exit from the euro or an unprecedented ability to meaningfully improve tax collection—some kind of re-profiling of official debt will have to take place (as conditions have deteriorated since the last restructuring in 2012), such as lowering official interest rates and extending final maturities and the interest service holiday (beyond 2016). Future political leaders may have to bite the almost unavoidable bullet of further outright forgiveness.
The good news is that European markets are so far taking this latest Greek drama in their stride, given the ring-fencing of the other countries by the ECB and massive QE. Markets also assume that both parties have too much to lose and so will be forced into a compromise. Should this prove false, investors can expect a lot of short-term volatility.
How Much Does Debt Matter?
Debt/GDP in the Eurozone remains much higher than when the global financial crisis broke, even after years of austere fiscal policies, as the denominator has been impacted. That said, the correlation between growth and debt levels is far from clear when looking at individual countries, suggesting that there are other causes of slow growth apart from debt within the Eurozone, and also that high debt levels alone may not hinder a recovery. In other words, debt may not be so much the villain of the piece as the symptom of other impediments to growth for which further structural reform and increasing competitiveness are needed. In the meantime, QE, negative interest rates, a lower euro, and low oil prices provide a tailwind to asset prices, irrespective of debt levels. This year, at last, the strong performance of Eurozone equities actually reflects improving fundamentals.
Until recently, the Eurozone appeared in grave danger of sinking into a debt deflation or, worse, a full blown depression. Now, led by the consumer, the barest green shoots of growth are appearing across the Eurozone. Car sales and consumer confidence are up, and retail sales growth has accelerated to 3.7% year-over-year, encouraged by falling prices. Even bank lending is showing signs of life, as banks prefer to lend than to park funds at negative rates with the central bank, with lending to the private sector turning positive for the third consecutive month in February. While academics and pundits endlessly argue about the merits or otherwise of QE, its inception has coincided with a revival of the consumer’s animal spirits. This is not to become too complacent. Fiscal drag, flat export volumes, and the only very slow improvement of the labour market (unemployment has crept down to 11.3%) remain serious challenges for the Eurozone, and the consumer’s resurgent purchasing power has been driven by falling prices rather than wages until recently. However, even the labour market is showing selective signs of recovery, as Germany’s key IG Metall union negotiated wage increases of over 3%. The known unknown is whether these young shoots will blossom into a stronger improvement in the labour market to build a self-sustaining recovery after QE ends, thereby reducing the debt load.
The Bottom Line
Reducing total debt from current levels is neither a necessary nor sufficient condition for better growth in the Eurozone. The stock market, buoyed by QE and its knock-on effects, can perhaps safely ignore the debt levels for a while (as these are serviceable at near-zero rates), but at some stage they will have to come down in real terms. At the same time, Eurozone bond markets offer almost no value except in the case of continuing deflation, which now seems unlikely. However, in a world where developed economies’ structural growth rates may have changed down a gear, current debt levels are still too elevated to permit re-leveraging to nudge the recovery forward. If countries are unable to—or choose not to—reduce their debts, a policy error that boosts real rates too far after QE ends could trigger another crisis.
Stephen Saint-Leger, Managing Director
Alexandra Meyer, Senior Investment Associate
Exhibit Notes
Total Debt-to-GDP: 2007 vs 2014
Source: McKinsey Global Institute.
Note: Total debt-to-GDP includes government debt and the debt of households and non-financial corporations.
Debt-to-GDP by Sector: 2007 vs 2014
Source: McKinsey Global Institute.
Notes: Total Debt/GDP includes government debt and the debt of households and non-financial corporations. For each sector, the year with the highest ratio in each country is boxed.
Growth in Government Debt
Source: International Monetary Fund – World Economic Outlook Database.
Budget Deficit as a Percentage of GDP
Sources: European Central Bank, Oxford Economics, and Thomson Reuters Datastream.
Note: Data are annual.
Nominal GDP for 2014 and 2015
Source: OECD.