UK and US markets showed a noticeable uptick in volatility over first quarter, while European and Asian shares soared (and bond yields plumbed new lows) thanks to, in no particular order, the ECB’s much-ballyhooed QE announcement in January, the strong US dollar, increasing signs of speculation in China, and the fact that Greece remains, at least for now, a member of the Eurozone. Commodity prices, meanwhile, plunged further as deflation worries continued to grow, with Chinese growth weakening and US economic data coming in below expectations.
Equity markets generally rose in first quarter, with several markets touching all-time (nominal) highs, including those in Germany, Sweden, the United Kingdom, and the United States. Volatility picked up in the UK and US markets, where short-lived declines were followed quickly by recoveries, with returns for the quarter at 4.7% and 1.0% for the FTSE® All-Share and S&P 500 indexes, respectively. Government bonds in the two countries plunged early in the year only to rise sharply, then decline again into quarter-end. European and Asian markets, on the other hand, were strong throughout, with equities soaring—at least in local currency terms; returns for unhedged US$ investors were significantly lower due to the strong dollar—and bond yields continuing to plumb new lows.
Whether the recent volatility in certain markets is a harbinger of things to come is of course unknowable, but the regular snapbacks in UK and US shares suggest investors have fully internalized the “buy the dip” lesson of the past several years. Such action can be read in two ways—either as supporting the economic recovery storyline, or as a worrisome level of complacency given high valuations, particularly in US risk assets, in the face of weak economic data and a swelling number of geopolitical risks including China, Russia, and Iran along with many other Middle Eastern countries.
Either way, such attitudes were further reinforced by the Federal Reserve’s decision to remove the word “patient” from its communiqué on when it might raise interest rates, but at the same time go out of its way to reassure investors that such hikes are highly contingent on the economy (and by extension markets); this was read by many observers as a signal that the “Yellen put” remains alive and well. The European Central Bank (ECB) also finally launched its long-awaited QE program in first quarter, and a growing number of observers expect the Bank of Japan to increase its QE commitment later this year.
The first quarter saw a downturn in US economic data, both in absolute terms and relative to expectations. Fourth quarter GDP growth was revised down to 2.2% (though full year GDP growth was still the best since 2010), and estimates for first quarter have been cut dramatically since the first of the year, with analysts calling for 1.5% to 2.5% growth, while a relatively new model from the Federal Reserve Bank of Atlanta currently estimates 0% growth in first quarter. The Bloomberg ECO US Surprise Index, which tracks economic data relative to expectations, fell in March to its lowest level since 2009, with disappointments in a wide variety of data points, including significant areas such as retail sales, existing home sales, and factory orders. In March, the ISM Manufacturing Index hit its lowest level since May 2013 and has fallen for five straight months. Finally, US corporate profits are expected to show a year-over-year decline in first quarter for the first time since third quarter 2012. While some of this owes to energy companies hit by lower oil prices, it is noteworthy that year-over-year share repurchases—which have exploded in recent years, and been a key source of support to share prices—fell in fourth quarter 2014 for the first time since third quarter 2012.
Europe ex UK equities posted impressive gains for the quarter in local currency and euro terms (15.2% and 18.9%, respectively), but returns were far lower for unhedged US$ investors (5.5%) due to the plunging euro. Overweighting European equities versus US equities continues to look sound on a valuations basis. Corporate profits have begun to show a benefit from the weak euro, and many market participants believe the ECB’s QE program will provide support to equities. However, much of the recent rally has been based more on hope than on fundamentals, and at some point data will need to actually improve for the rally to continue.
Japanese equities added to their strong run in first quarter (10.2%), while the yen stabilized and bond yields remained at miniscule levels. Macro data continue to be soft, but valuations, along with strong earnings and technical support from GPIF purchases, are positive for equities and we remain overweight the Japanese market.
Emerging markets equities also put up strong numbers for the quarter (4.9%), although gains were cut by more than half (2.3%) for unhedged US$ investors. Asian emerging markets and emerging Europe, the Middle East & Africa both returned 5.7%, with China making the strongest contribution to performance in the former, and surprisingly good performance from Russia pushing up the latter. China’s strong return for the quarter (8.1%) extended its return for the past 12 months (24.3%), and the Chinese market has begun to show signs of speculation, particularly among retail traders. UBS, for example, recently noted that margin purchases now account for nearly 20% of daily trading in Chinese equities, “which itself has soared to wholly unprecedented levels in another sign of self-feeding speculative frenzy.” Latin American markets put up muted gains in local currency (1.3%), and near-double-digit losses in US$ terms (-9.5%) thanks to the strong buck.
Commodity prices plunged again in first quarter, pressured by continued signs of waning demand from China and worries about global deflationary pressures. Some investment banks are calling for sharply lower prices from current depressed levels—the S&P GSCI™ and Bloomberg Commodity indexes touched their lowest levels in over a decade—with Goldman Sachs predicting raw materials prices will fall 20% over the next six months, and Morgan Stanley lowering its target prices on coking coal, copper, iron ore, and nickel by more than 15% each.
Currency markets were volatile in first quarter, and US$ strength continued; the Swiss franc was the only major developed currency to rise versus the dollar. The euro not only fell another 11% against the US dollar—and has fallen 22% over the past 12 months—but fell against every other major developed currency and our emerging markets currency basket for the quarter.
The Fed dropped “patient” in March, but views on the appropriate pace of tightening are coming down

Fed Funds Futures Expectations
Percent (%)
Sources: Bloomberg L.P. and Federal Reserve.
Deflationary malaise in parts of the global economy contributed to continued growth in the amount of debt with negative yields

Amount of European Negative-Yielding Debt Outstanding
March 31, 2014 – March 31, 2015
Sources: Barclays, Citigroup Global Markets, European Central Bank, and Financial Times.
Weakness in energy sector earnings is expected to pull down EPS growth for US equities
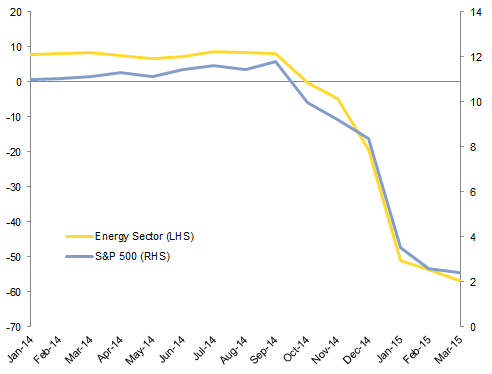
Earnings per Share Growth
January 31, 2014 – March 31, 2015 • Percent (%)
Sources: Factset Research Systems and J.P. Morgan Securities, Inc.
Note: EPS growth across sectors data are actual for 2014 and projected for 2015.
The dollar extended its rally in first quarter, and is up nearly 17% since July
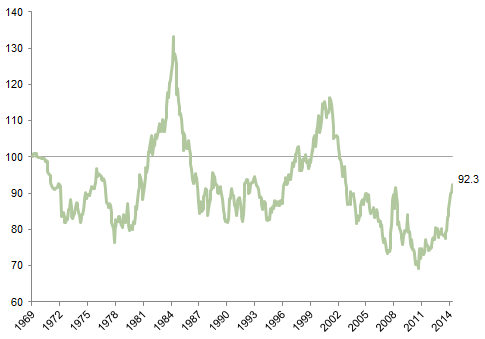
USD Equal-Weighted Index
December 31, 1969 – March 31, 2015 • December 31, 1969 = 100
Sources: Goldman, Sachs & Co., J.P. Morgan Securities, Inc., MSCI Inc., and Thomson Reuters Datastream. MSCI data provided “as is” without any express or implied warranties.
Notes: The USD Equal-Weighted Index is an equal-weighted basket of six currencies: the Australian dollar, British pound, Canadian dollar, euro, Japanese yen, and Swiss franc.
First quarter returns were muted to poor across asset classes in US$ terms as US equities underperformed DM and EM equities and the strong dollar weighed on returns
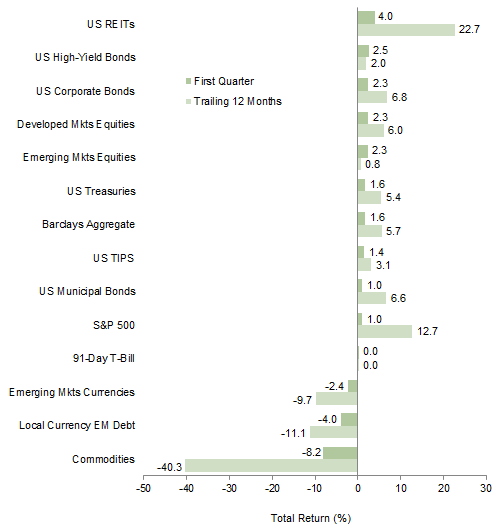
Index Performance (US$)
As of March 31, 2015
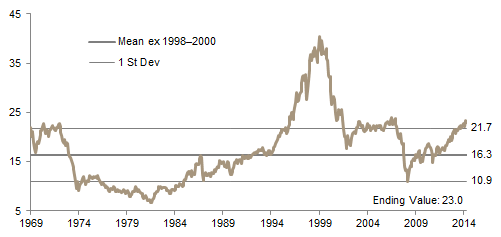
MSCI US Composite Normalized P/E
December 31, 1969 – March 31, 2015
Sources: Barclays, BofA Merill Lynch, FTSE International Limited, J.P. Morgan Securities, Inc., MSCI Inc., National Association of Real Estate Investment Trusts, Standard & Poor’s, and Thomson Reuters Datastream. MSCI data provided “as is” without any express or implied warranties.
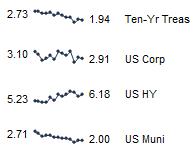
Fixed Income Yields
March 2014 – March 2015
European equities soared in first quarter and assets outside Europe posted strong returns as well, as the euro fell against many other currencies; Europe ex UK REITs have posted strong performance since October
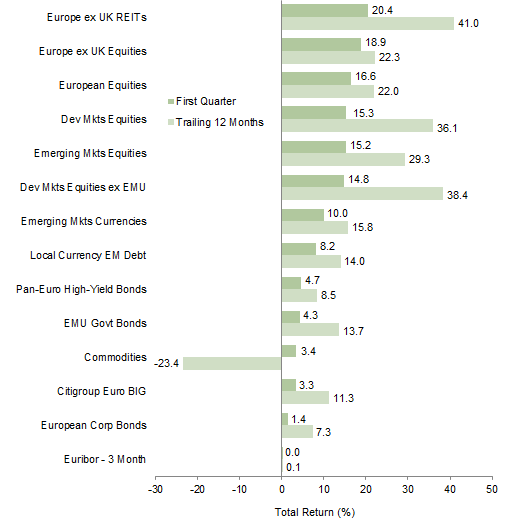
Index Performance (€)
As of March 31, 2015
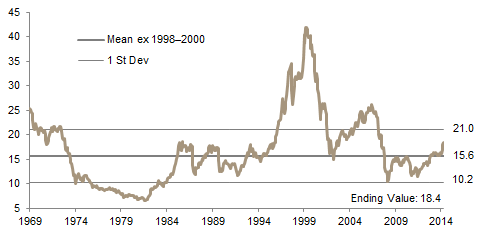
MSCI Europe ex UK Composite Normalized P/E
December 31, 1969 – March 31, 2015
Sources: Barclays, Bloomberg L.P., BofA Merill Lynch, Citigroup Global Markets, EPRA, FTSE International Limited, MSCI Inc., J.P. Morgan Securities, Inc., National Association of Real Estate Investment Trusts, Standard & Poor’s, and Thomson Reuters Datastream. MSCI data provided “as is” without any express or implied warranties.
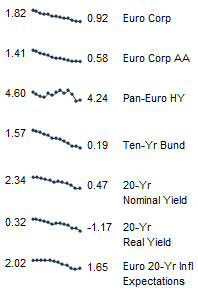
Fixed Income Yields
March 2014 – March 2015
Strong performance in continental European shares was only somewhat muted by the stronger pound as Eurozone equities more than doubled the return of UK equities for the quarter; yields on ten-year gilts soared in February but came back in March to end the quarter below where they began the year
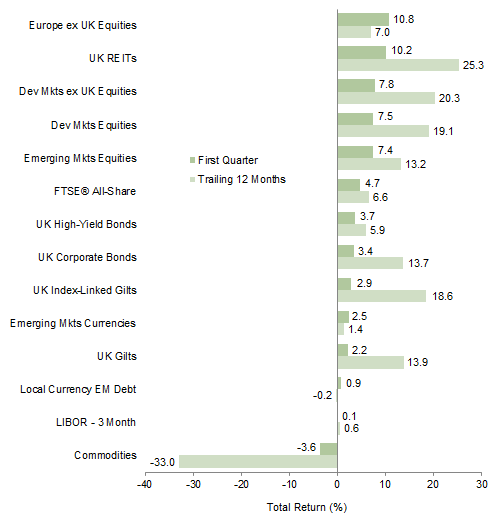
Index Performance (₤)
As of March 31, 2015
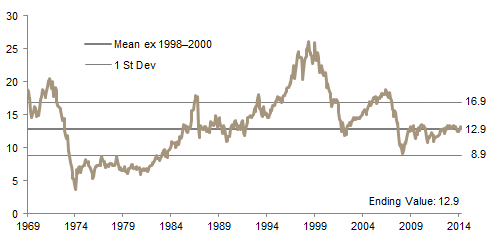
MSCI UK Composite Normalized P/E
December 31, 1969 – March 31, 2015
Sources: Bank of England, Barclays, BofA Merrill Lynch, EPRA, FTSE International Limited, J.P. Morgan Securities, Inc., MSCI Inc., National Association of Real Estate Investment Trusts, Standard & Poor’s, and Thomson Reuters Datastream. MSCI data provided “as is” without any express or implied warranties.
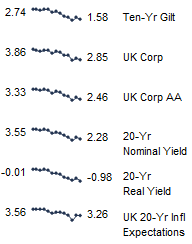
Fixed Income Yields
March 2014 – March 2015
US$ strength was the story of the quarter as other major currencies, save the Swiss franc, lost ground. The yen, which has struggled against the dollar for the past year, stabilized in the first quarter, ending down just 0.03%. The euro sank in the quarter against every single currency we track save the Brazilian real, and remains weak versus the Swiss franc since the Swiss National Bank removed the CHF/EUR floor in January. While the pound gained versus the euro, it was broadly weak for the quarter, losing ground against the US dollar, Swiss franc, Japanese yen, and our emerging markets currency basket

Currency Performance
As of March 31, 2015
Sources: MSCI Inc. and Thomson Reuters Datastream. MSCI data provided “as is” without any express or implied warranties.
Note: EM currencies is an equal-weighted basket of 20 currencies.
Exhibit Notes
Performance Exhibits
Total returns for MSCI developed markets indexes are net of dividend taxes. Total returns for MSCI emerging markets indexes are gross of dividend taxes.
US dollar index performance chart includes performance for the Barclays Corporate Investment Grade, Barclays High Yield Bond, Barclays Municipal Bond, Barclays US TIPS, Barclays US Treasuries, BofA Merrill Lynch 91-Day Treasury Bills, FTSE® NAREIT All Equity REITs, J.P. Morgan ELMI+, J.P. Morgan GBI-EM Global Diversified, MSCI Emerging Markets, MSCI World, and S&P GSCI™ indexes.
Euro index performance chart includes performance for the Barclays Euro-Aggregate: Corporate, Barclays Pan- Euro High Yield, Citigroup EMU Govt Bonds, FTSE® EPRA/NAREIT Europe ex UK RE, J.P. Morgan ELMI+, J.P. Morgan GBI-EM Global Diversified, MSCI Emerging Markets, MSCI Europe, MSCI Europe ex UK, MSCI World ex EMU, MSCI World, and S&P GSCI™ indexes.
UK sterling index performance chart includes performance for the Barclays Sterling Aggregate: Corporate Bond, BofA Merrill Lynch Sterling High Yield, FTSE® British Government All Stocks, FTSE® British Government Index- Linked All Stocks, FTSE® EPRA/NAREIT UK RE, J.P. Morgan ELMI+, J.P. Morgan GBI-EM Global Diversified, MSCI Emerging Markets, MSCI Europe ex UK, MSCI World, MSCI World ex UK, and S&P GSCI™ indexes.
Valuation Exhibits
The composite normalized P/E ratio is calculated by dividing the inflation-adjusted index price by the simple average of three normalized earnings metrics: ten-year average real earnings (i.e., Shiller earnings), trend-line earnings, and return on equity–adjusted earnings. We have removed the bubble years 1998–2000 from our mean and standard deviation calculations. All data are monthly.
Fixed Income Yields
US fixed income yields reflect Barclays Municipal Bond Index, Barclays US Corporate High Yield Bond Index, Barclays US Corporate Investment-Grade Bond Index, and the ten-year Treasury.
European fixed income yields reflect the BofA Merrill Lynch Euro Corporate AA Bond Index, BofA Merrill Lynch Euro Corporate Bond Index, Barclays Pan-European Aggregate High Yield Bond Index, Bloomberg Twenty-Year European Government Bond Index (nominal), ten-year German bund, 20-year European Inflation Swaps (inflation expectations), and the real yield calculated as the difference between the inflation expectation and nominal yield.
UK sterling fixed income yields reflect the BofA Merrill Lynch Sterling Corporate AA Bond Index, BofA Merrill Lynch Sterling Corporate Bond Index, UK ten-year gilts, and Bank of England 20-year nominal, real, and zero coupon (inflation expectations) yields.