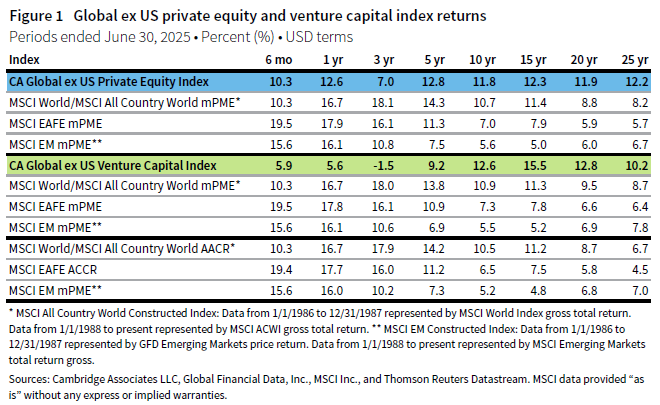
Private equity (PE) delivered stronger results than venture capital (VC) in global ex US markets during the first half of 2025, mirroring the trend seen in the United States, as the Cambridge Associates LLC Global ex US Private Equity Index posted a 10.3% return and the Cambridge Associates LLC Global ex US Venture Capital Index rose by 5.9%, both measured in USD terms. Due to a weaker US dollar, returns were lower when converted to euros; the PE index recorded -2.7% and the VC index came in at -6.5%. The solid performance at the beginning of the year has contributed to a partial rebound in the three-year horizon return, though venture remains in negative territory. While the global ex US PE/VC indexes have typically outpaced their public market equivalents (as measured by modified public market equivalent [mPME] returns), the last three to five years have been a notable exception (Figure 1).
First half 2025 highlights
- The global ex US PE index generated higher returns than the VC index, but public markets outperformed. Overall, more recent vintage years delivered stronger results compared to older funds, while performance across sectors and countries varied. The weakened US dollar significantly influenced returns when measured in both euros and dollars.
- Historically, the VC index has had a larger exposure to public companies—a trend that held in 2025. Based on market values as of June 30, 2025, public companies accounted for about 11% of the global ex US VC index and about 8% the global ex US PE index.
Global ex US private equity performance insights
Vintage years
Returns were positive for all major vintage years (those making up at least 5% of the index’s value) in the global ex US PE index over the first half of 2025. Older funds from 2017–18 delivered single-digit returns, while more recent funds from 2020–23 achieved double-digit performance (Figure 2). The weakness of the US dollar resulted in significantly lower returns when calculated in euros. The 2018 vintage continued to be the largest, making up 16.4% of the index, and 2021 funds already represented 15.8%—a proportion that is expected to rise as additional capital is invested. Together, the key vintages accounted for 76% of the index’s value and returned approximately 11% in US dollars and -2% in euros.
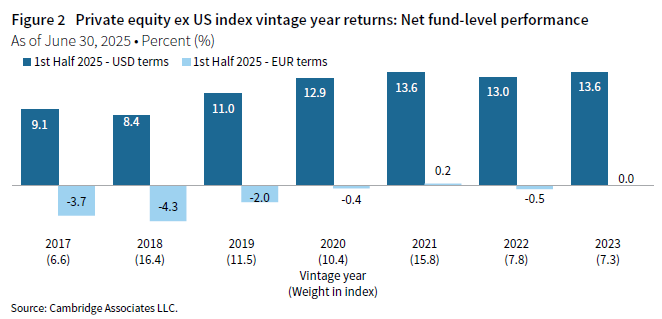
The top-performing vintage year (2023) achieved a 13.6% return in the first half of the year, largely fueled by investments in information technology (IT). Funds from 2018 delivered the weakest results during the same timeframe, though returns were positive. That vintage year saw modest gains in every major sector. The fund’s age or vintage year is one consideration when comparing returns across vintages as time is a component of the internal rate of return (IRR) calculation used for PE investments. In the current environment, hold periods have been extended, which will impact IRRs but not necessarily other return metrics, such as multiples of invested capital.
Limited partner (LP) distributions were near historical averages in absolute terms but significantly lower when considered against the expanding size of the index. Distributions exceeded contributions, totaling $33 billion compared to $30 billion. At this rate, distributions are on pace to be lower than last year’s figures, and contributions are on their slowest pace since 2018.
Funds launched in 2022 and 2023 represented 67% of contributions during the first half of the year. The 2023 vintage called the largest share (37%), which is typical for newer funds at the height of their investment cycle. The next largest vintage was 2022, which made up 30%. Older vintages from 2016–19 returned more than $17 billion combined and accounted for 54% of total distributions. Although still relatively new, funds from 2020–21 each accounted for just less than 10% of the total distributions during the period; these vintages deployed most of their capital at peak valuations, much of which is still trapped in unrealized value.
Sectors
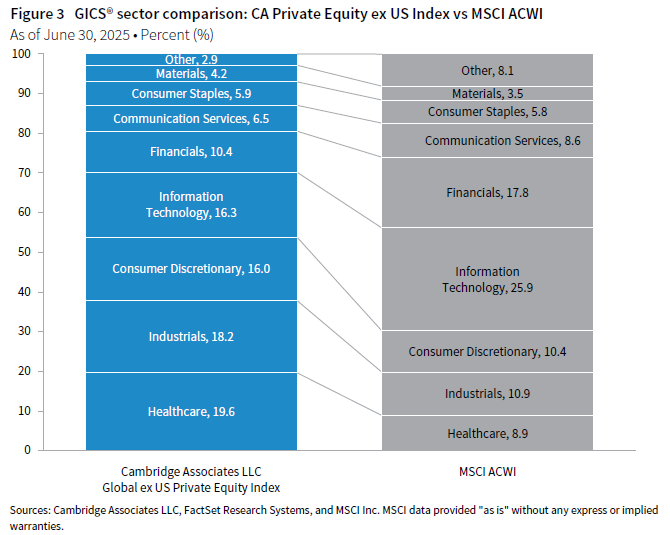
Figure 3 shows the Global Industry Classification Standard (GICS®) sector breakdown of the global ex US PE index and a public market counterpart, the MSCI All Country World Index (ACWI). The chart illustrates differences in sector exposures, which help explain relative performance. The PE index has considerably less exposure to IT and financials, and more to healthcare, industrials, and consumer discretionary.
All seven meaningfully sized sectors generated positive returns in the first two quarters when measured in US dollars, but results were largely negative when measured in euros (Figure 4). Financials stood out as the top-performing sector (19%), while the others achieved high single-digit or low double-digit returns. Together, the main sectors delivered a pooled gross return of 10% in USD terms and -3% in euro terms.
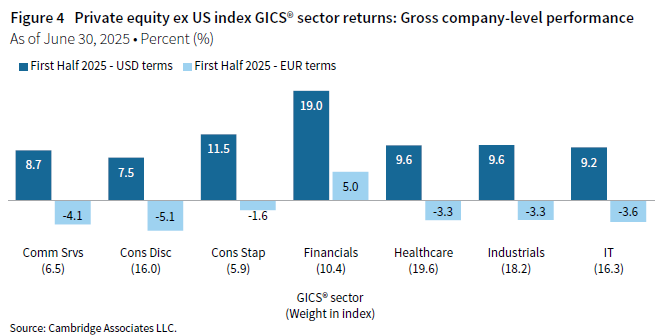
The third-largest sector by weight (IT) attracted the most capital in the first half of the year, followed by healthcare and industrials. Together, these three sectors represented 64% of total money invested. The renewed interest in IT comes after a period when investors favored value-oriented areas of the economy over the sector. However, the higher allocation to IT aligns more closely with the long-term trend.
Countries
Like vintage years and sectors, country-specific returns were positive but showed greater variation. European countries—Germany, France, and the United Kingdom—delivered the strongest results, with returns ranging from 19.3% to 9.7%, respectively (Figure 5). China recorded the lowest return—2.7% in US dollars and -9.3% in euros—and now makes up just 10.6% of the global ex US PE index. The United States trailed Europe but outperformed China, posting a 6.3% gain in the first six months of the year. Overall, the pooled gross return for all five countries was 9% in US dollars and -4% in euros.

Despite the global ex US composition of the funds in the index, companies headquartered in the United States attracted the most capital (19%) among the meaningfully sized countries. Europe saw significant investment as well, mainly in the United Kingdom and Germany, which made up about 11% each. China represented just 6% of inflows, even though it is the third-largest country in the index. At the same time, India received a higher share (8%), reflecting the longer-term trend of capital shifting away from China and toward other regions in Asia.
Global ex US venture capital performance insights
Vintage years
Nearly all major vintage years (those representing at least 5% of the index’s value) in the global ex US VC index posted positive returns during the first half of 2025. Older funds from 2015–18 generated low-single-digit returns, while more recent vintages from 2019–22 saw high-single-digit results (Figure 6). Returns calculated in euros were notably lower due to the weakness of the US dollar. The 2018 vintage remained the largest, comprising 13.1% of the index. Collectively, the principal vintages made up 85% of the index’s value and delivered returns of roughly 5% in US dollars and -7% in euros.
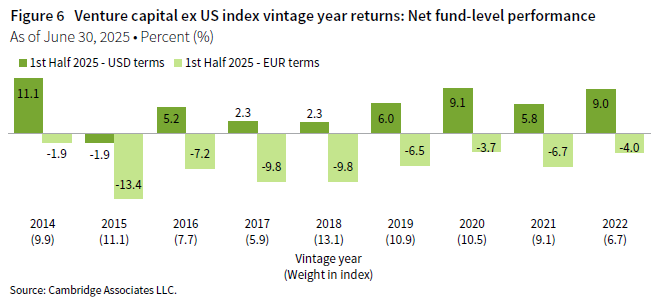
Despite older funds performing worse overall, the leading vintage year was 2014, which posted an 11.1% return in the first half of the year, primarily driven by investments in IT. In contrast, 2015 funds recorded the lowest performance for the period (-1.9%), weighed down by investments in the consumer discretionary and healthcare sectors, and moderate returns in other sectors. The fund’s age or vintage year is one consideration when comparing returns across vintages, as time is a component of the IRR calculation used for VC investments. In the current environment, hold periods have been extended, which will impact IRRs but not necessarily other return metrics, such as multiples of invested capital.
In the first half of 2025, LP distributions were on par with historical averages in absolute terms but were much lower relative to the growing size of the index. Contributions outpaced distributions, amounting to $4.2 billion versus $3.9 billion.
Funds launched in 2021 and 2022 accounted for the largest share of contributions, 21% and 41%, respectively, which is typical for newer vintages at the peak of their investment cycle. Funds from 2014 and 2016 made up 58% of total distributions, underscoring the long-term nature of the asset class. Funds from 2016 returned 37% of the total capital during the period, while 2014 funds contributed another 21%.
Sectors
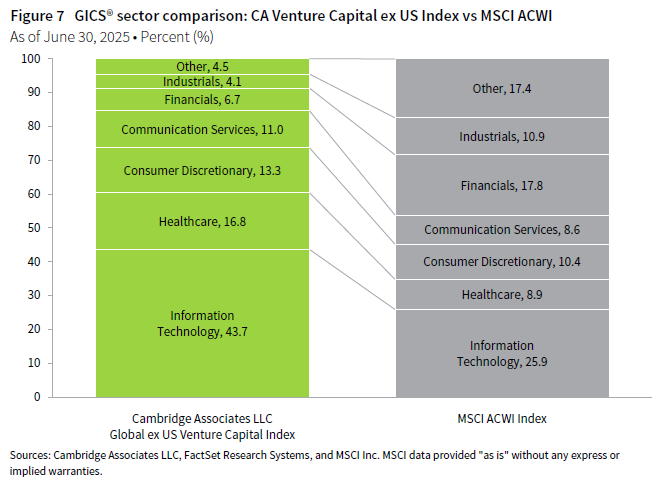
Figure 7 shows the GICS® sector breakdown of the global ex US VC index and a public market counterpart, the MSCI ACWI. The chart illustrates differences in sector exposures, which helps explain relative performance. The VC index has considerably less exposure to financials and industrials, and more to healthcare and IT.
All seven sectors of meaningful size produced positive returns in the first two quarters when measured in US dollars, though results were mostly negative when measured in euros (Figure 8). Communication services emerged as the best-performing sector (33%), while the remaining sectors posted single-digit returns. Collectively, the principal sectors generated a pooled gross return of 9.4% in US dollars and -3.5% in euros.
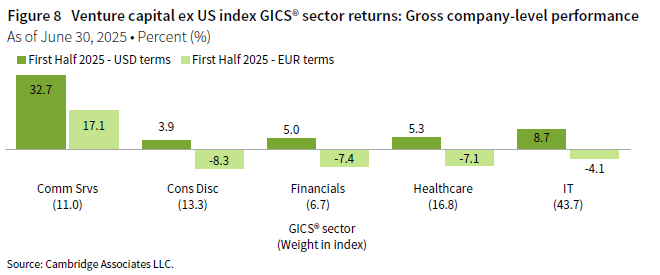
The second-largest sector by weight, healthcare, drew the most capital in the first half of the year (37%), with IT following closely. Combined, these two sectors accounted for 72% of total invested capital. Investment in IT was consistent with the sector’s long-term trend, while healthcare received significantly more than its long-term average of 27%.
Countries
As with vintage years and sectors, country-specific returns were mostly positive but displayed greater variability. Germany achieved the highest result at 20.1%, and China ranked second at 12.0% (Figure 9). On the other end of the spectrum, India posted the lowest return, -3.4% in US dollars and -14.8% in euros. The United States lagged Germany and China but outperformed the United Kingdom, Ireland, and India, recording a 10.0% gain in the first half of the year. In total, the pooled gross return for all six countries was 9.7% in US dollars and -3.3% in euros.
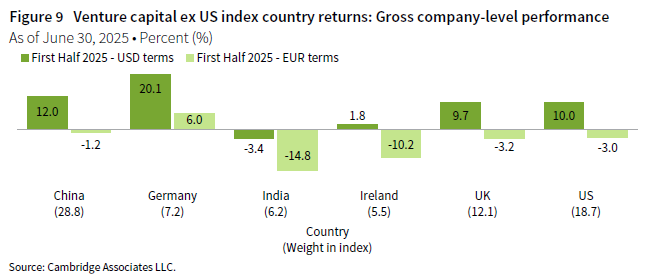
Although the funds in the index are global ex US, companies based in the United States drew the most capital (25%) among the meaningfully sized countries. China also received substantial investment, accounting for about 15% of the capital deployed during the period. The United Kingdom, the third-largest country in the index, made up 12% of inflows, matching India. Ireland, despite representing 5.5% of the index by weight, attracted less than 1% of the capital invested during the period.
Caryn Slotsky, Managing Director, PI Strategy Research
Drew Carneal, Associate Director, PI Strategy Research
Wyatt Yasinski, Associate Director, PI Strategy Research
Figure notes
Private equity includes only buyout and growth equity funds.
Global ex US Private Equity and Venture Capital Index returns
The PE/VC indexes are pooled horizon internal rates of return and are based on limited partners’ fund-level performance; the returns are net of fees, expenses, and carried interest. Because the indexes are capitalization weighted, performance is mainly driven by the largest vintage years.
Public index returns are shown as both time-weighted returns (average annual compound returns) and dollar-weighted returns (modified public market equivalent). Returns are annualized, with the exception of returns less than one year, which are cumulative. The CA mPME replicates private investment performance under public market conditions. The public index’s shares are purchased and sold according to the private fund cash flow schedule, with distributions calculated in the same proportion as the private fund, and mPME net asset value is a function of mPME cash flows and public index returns.
Vintage year returns
Vintage year fund-level returns are net of fees, expenses, and carried interest.
Sector returns
Industry-specific gross company-level returns are before fees, expenses, and carried interest.
Country returns
Industry-specific gross company-level returns are before fees, expenses, and carried interest.
GICS® sector comparisons
The Global Industry Classification Standard (GICS®) was developed by and is the exclusive property and a service mark of MSCI Inc. and S&P Global Market Intelligence LLC and is licensed for use by Cambridge Associates. Other includes sectors that make up less than 3% of the CA benchmark.
About the Cambridge Associates LLC indexes
Cambridge Associates derives its Global ex US Private Equity and Venture Capital indexes from the financial information contained in its proprietary database of funds based outside the US. As of June 30, 2025, the database included 730 VC funds formed from 1986 to 2025 with a value of about $165 billion. Ten years ago, as of June 30, 2015, the index included 370 VC funds with a value of about $50 billion. As of June 30, 2025, the database included 1,265 PE funds formed from 1987 to 2025 with a value of about $805 billion. Ten years ago, as of June 30, 2015, the index included 869 PE funds with a value of about $351 billion.
The pooled returns represent the net periodic rates of return calculated on the aggregate of all cash flows and market values as reported to Cambridge Associates by the funds’ general partners in their quarterly and annual audited financial reports. These returns are net of management fees, expenses, and performance fees that take the form of carried interest.
About the public indexes
The MSCI ACWI captures large- and mid-cap representation across 23 developed markets (DM) and 24 emerging markets (EM) countries. With 2,517 constituents, the index covers approximately 85% of the global investable equity opportunity set. DM countries include Australia, Austria, Belgium, Canada, Denmark, Finland, France, Germany, Hong Kong, Ireland, Israel, Italy, Japan, the Netherlands, New Zealand, Norway, Portugal, Singapore, Spain, Sweden, Switzerland, the United Kingdom, and the United States. EM countries include Brazil, Chile, China, Colombia, Czech Republic, Egypt, Greece, Hungary, India, Indonesia, Korea, Kuwait, Malaysia, Mexico, Peru, the Philippines, Poland, Qatar, Saudi Arabia, South Africa, Taiwan, Thailand, Turkey, and the United Arab Emirates.
The MSCI EAFE Index is a free float–adjusted, market capitalization–weighted index that is designed to measure large- and mid-cap equity performance of developed markets, excluding Canada and the United States. As of June 30, 2025, the MSCI EAFE Index consisted of the following 21 DM country indexes: Australia, Austria, Belgium, Denmark, Finland, France, Germany, Hong Kong, Ireland, Israel, Italy, Japan, the Netherlands, New Zealand, Norway, Portugal, Singapore, Spain, Sweden, Switzerland, and the United Kingdom.
The MSCI Emerging Markets Index is a free float–adjusted, market capitalization–weighted index that is designed to measure large- and mid-cap equity performance of emerging markets. As of June 30, 2025, the MSCI Emerging Markets Index included 24 EM country indexes: Brazil, Chile, China, Colombia, Czech Republic, Egypt, Greece, Hungary, India, Indonesia, Korea, Kuwait, Malaysia, Mexico, Peru, the Philippines, Poland, Qatar, Saudi Arabia, South Africa, Taiwan, Thailand, Turkey, and the United Arab Emirates.