Most asset classes rallied in May. Global equities advanced, led by strong gains for US and technology stocks. Emerging markets (EM) lagged developed peers, as Chinese equities lost momentum late in the month. Among styles, growth topped value, and large caps edged out small caps. US bonds advanced as yields fell, but European sovereigns lagged as inflation reports came in hotter than expected. Real assets performance was mixed. Industrial and precious metals rallied as copper and gold prices rose to new highs, whereas oil prices declined. Currency performance broadly reflected shifts in central bank policy expectations. The US dollar weakened and euro performance was mixed, while UK sterling generally appreciated.
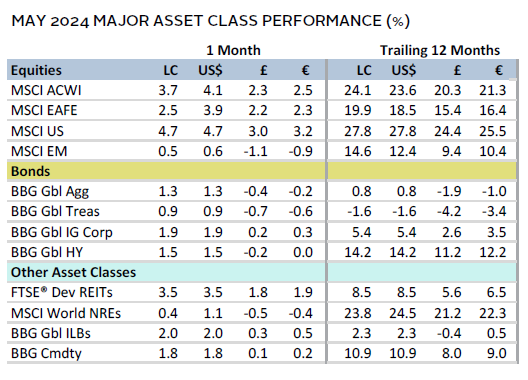
Sources: Bloomberg Index Services Limited, Bloomberg L.P., EPRA, FTSE International Limited, MSCI Inc., National Association of Real Estate Investment Trusts, and Thomson Reuters Datastream. MSCI data provided “as is” without any express or implied warranties.
Note: Local currency returns for the Bloomberg fixed income indexes, the Bloomberg Commodity Index, and the FTSE® Developed REITs are in USD terms.
The Macro Picture
Softening US inflation and weaker-than-expected economic data encouraged investors to price in a less hawkish interest rate scenario. Federal Reserve Chair Jerome Powell downplayed the likelihood of further interest rate hikes at the early May meeting, during which no policy changes were announced. Later data showed that inflation cooled in line with expectations, while employment gains and consumer spending both slowed. These updates led investors to extrapolate that the Fed may deliver at least one 25-basis point (bp) rate cut in 2024, and bond yields fell. Still, this dynamic faded near month end, as Fed officials reiterated that a higher-for-longer approach may be necessary.
The United States contrasted other major developed peers. In the United Kingdom, inflation was hotter than anticipated, leading markets to effectively remove the possibility of a June rate cut by the Bank of England (BOE). Eurozone PMI data suggested that economic activity gained momentum, expanding at the fastest clip in a year in May. Elsewhere, Japanese GDP contracted 0.5% in Q1 2024, pointing to weak underlying demand conditions.
Artificial intelligence (AI) updates had a mixed impact on performance. Chip stalwart Nvidia’s blowout earnings and stronger-than-anticipated forward guidance further propelled enthusiasm for AI-related equities, contributing to gains of nearly 8% for global information technology (IT) stocks. However, Chinese tech stocks faltered toward month end as AI service providers slashed prices on several offerings. Chinese authorities also announced further stimulus measures to support the property market. Finally, markets took in stride the announcement of US import tariffs on a slew of Chinese goods—the move was widely viewed as politically motivated with muted economic impact.
Equities
Tech-heavy US equities outperformed in May, boosted by lower interest rate expectations and a strong end to the earnings reporting season. Earnings per share (EPS) expanded by 6% year-over-year (YOY) in Q1 2024, roughly double the rate expected at the end of March. However, Nvidia accounted for about half of overall growth, and earnings declined when excluding other mega-cap tech stocks. These dynamics meant that the IT and communication services sectors delivered among the highest gains in May, whereas cyclicals such as energy and consumer discretionary lagged. Utilities also posted strong returns, as investors priced in higher electrification demands from AI and government incentives for clean energy initiatives. Taken together, growth trounced value, and small caps gained on par with large caps.
US economic data were generally softer in May. CPI inflation matched expectations, slowing to 3.4% YOY in April. This eased investor concerns, as the prior four prints were hotter than expected. Aggregate economic data also underwhelmed expectations by the widest margin in more than a year, reinforcing the notion that inflationary pressures were likely easing. Labor market data softened, monthly retail sales were flat, services sector activity contracted, and leading economic indicators declined. However, the Federal Reserve Bank of Atlanta’s month-end estimate still suggested robust GDP growth of 2.7% annualized in Q2. Additionally, preliminary PMI data for May unexpectedly rose to a 25-month high and consumer confidence rebounded. Fed officials struck a more hawkish tone, apparently unswayed by the data updates in May.
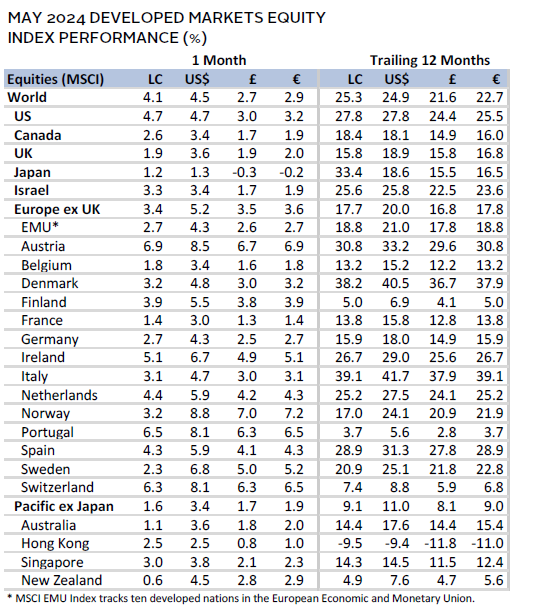
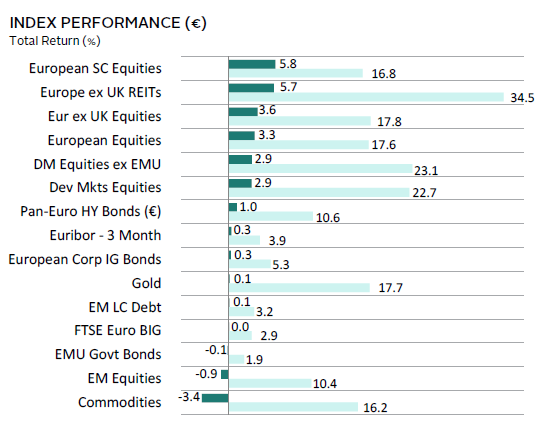
European equities lagged broader developed markets (DMs) due to strong US gains. However, they bested DM ex US for a third straight month. Europe ex UK shares topped UK peers, largely reflecting a shift in policy rate expectations and outcomes.
The Eurozone economy appeared to have bottomed as momentum in activity indicators improved. Preliminary PMI data for May rose to a 12-month high, highlighted by increasing new orders, employment, and the strongest business confidence in more than two years. Further, retail sales and industrial production topped expectations, while the unemployment rate fell 10 bps to 6.4%. Sweden’s central bank, the Riksbank, cut policy rates by 25 bps, following a similar move by the Swiss National Bank earlier this year. The European Central Bank (ECB) is largely expected to follow suit in June despite some signs of hotter-than-expected inflation.
In the United Kingdom, the BOE presented a dovish outlook in early May. However, April inflation data released later in the month slowed less than expected and shorter-term trends inflected higher. Although headline inflation cooled to the lowest YOY rate in nearly three years (2.3%), it was driven largely by one-off factors. Of concern was services inflation, which remained elevated at 5.9% YOY. Further, Prime Minister Rishi Sunak called a general election for early July, with the Labour Party largely expected to take the majority. With these factors combined, markets pushed back expectations for a rate cut from June to sometime in 2H 2024. Other economic data showed that the economy expanded 0.6% in Q1 2024—exiting a technical recession—and manufacturing activity picked up to a nearly two-year high.
Japanese equities treaded water, lagging broader DM stocks for the first time in five months. The Q1 2024 economic contraction was driven by weak business investment and consumer spending, marking the third consecutive quarter of either stagnation or contraction. Real household spending continued to decline, marked by two straight years of falling real wages. Still, the consumer outlook appears to be improving—which the Bank of Japan has flagged for further policy normalization—as the monthly rate of consumer spending expanded for a second straight month in March, the largest wage hikes in three decades were implemented in April, and tax cuts go into effect in June. The weak yen has weighed on recent sentiment indicators, but Japanese corporates have reported strong earnings growth as a result. For the fiscal year ended March 2024, analysts now expect EPS of 17% versus forecasts for just 6% growth a year ago.
Pacific ex Japan equities lagged broader DMs, as New Zealand and Australia underperformed. Although their respective central banks held policy steady in May, forward guidance was more hawkish. The Reserve Bank of New Zealand delayed their rate cut expectations by one quarter to Q3 2025 and discussed the possibility of a rate hike in May. While overall inflation has slowed, domestic inflation remained persistent despite ongoing economic and labor market weakness. The Reserve Bank of Australia (RBA) made similar moves, discussing the possibility of a rate hike—delaying forecasted rate cuts until mid-2025—and increasing near-term inflation forecasts. Indeed, inflation rose to a five-month high in April at a hotter-than-expected 3.6% YOY rate. The RBA is contending with elevated inflation amid a soft economic and consumer backdrop.
Sources: MSCI Inc. and Thomson Reuters Datastream. MSCI data provided “as is” without any express or implied warranties.
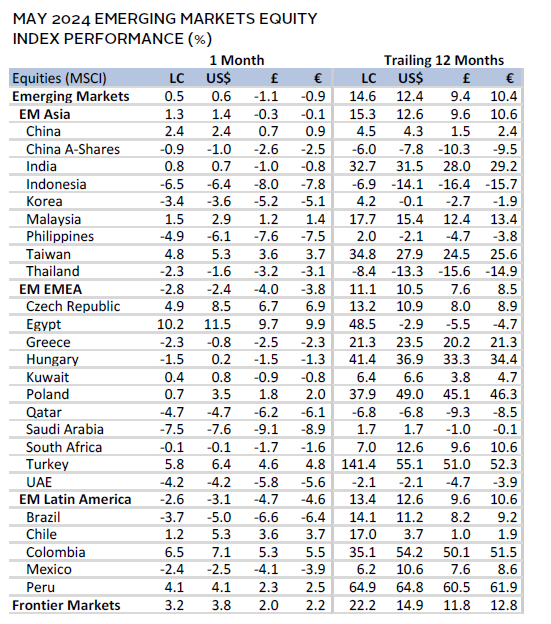
Emerging markets equities inched higher, but underperformed DM peers as the Chinese equity rally lost momentum toward month end. Asia led performance among the major EM regions, as Taiwan, China, and India were the top contributors to the broader EM index return. However, excluding China, the EM equity bloc modestly declined on the month. The Latin America and Europe, Middle East & Africa regions each declined nearly 3%. Q1 2024 earnings results came in particularly weak across EMs, with nearly half of the companies underperforming relative to analyst expectations. Profit margins came under pressure amid rising costs, particularly in labor, while monetary policy remained relatively restrictive across most of the bloc.
Chinese equities were whipsawed by policy announcements and an escalating price war by major AI services providers. Shares rallied nearly 11% by mid-month, as authorities announced some of the strongest measures to date supporting the property sector. These included easing mortgage rules and directing local governments to buy unsold homes from developers. Government debt sales also increased, suggesting more stimulus on the horizon. The moves came as housing prices posted their steepest monthly decline in a decade in April. However, equities lost 8% from their intra-month peak, as technology stocks came under pressure. Alibaba cut prices on its AI services by as much as 97%, leading to similar moves by other firms. With profits at risk, markets became skeptical of companies’ ability to keep pace with the steep investments needed to develop AI capabilities. Consumer data remained soft, with retail sales growth unexpectedly slowing in April. However, industrial output grew more than expected and private PMI data improved.
Sources: MSCI Inc. and Thomson Reuters Datastream. MSCI data provided “as is” without any express or implied warranties.
Fixed Income
US fixed income assets rallied, posting their strongest monthly gains this year. Ten-year US Treasury yields dropped 18 bps to 4.51%. However, yields touched as low as 4.36% mid-month. Investors cheered softer economic data early in the month, but more hawkish rhetoric from Fed officials contributed to higher yields toward month end. In addition, several Treasury auctions were met with weak investor demand. Real yields accounted for two-thirds of the decline in nominal yields, contributing to gains for US TIPS. However, ten-year breakeven inflation—a measure of market-implied inflation expectations—held relatively steady, ending the month at 2.36%. Municipal bonds were the outlier, posting a monthly decline. Robust new supply over the past several months is generally expected to persist in the near term, which puts upward pressure on yields.
Euro- and sterling-denominated fixed income markets generally lagged their US counterparts. Hotter-than-anticipated inflation in both the Eurozone and United Kingdom forced investors to walk back interest rate cut expectations, although the ECB is still widely expected to cut rates in early June. Indeed, ten-year UK gilt yields were largely unchanged at 4.33%, and ten-year German bund yields rose 7 bps to 2.65%. Recent improvement in economic data supported the outperformance of investment-grade and high-yield corporate bonds versus sovereigns.
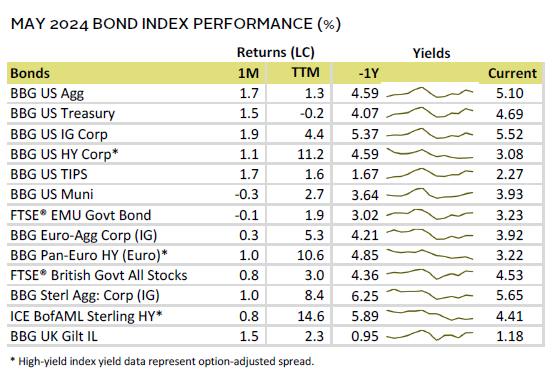
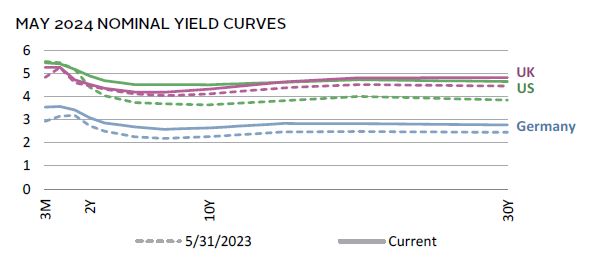

Sources: Bank of England, Bloomberg Index Services Limited, Federal Reserve, FTSE Fixed Income LLC, FTSE International Limited, Intercontinental Exchange, Inc., and Thomson Reuters Datastream.
Real Assets
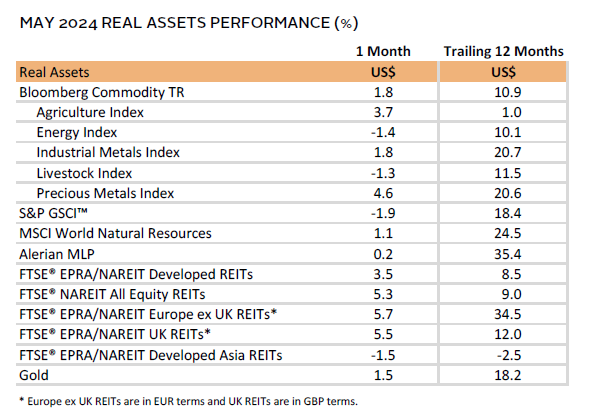
Commodities were mixed. Gains were primarily led by precious and industrial metals prices, whereas energy commodities lagged. Copper rose to multiyear highs, supported by expectations of looming supply shortages amid increased demand from AI computing and green energy. A short squeeze on US exchanges also added technical support to copper prices in May.
Global natural resources equities trailed broader equity markets on the month. The energy and materials sectors reported steep earnings declines in Q1 2024, while oil prices slipped more than 6% on the month. Shortly after month end, OPEC+ agreed to extend output cuts into 2025 amid strong US production this year. Refinery outages in Russia, coupled with slow output from Chinese and European refiners, contributed to weak crude oil demand of late.
REITs rallied, supported by falling bond yields. Still, year-to-date returns generally remained in the red, given the sharp back up in policy rate expectations and bond yields this year.
Gold prices advanced to $2,330.65/troy ounce, touching fresh all-time nominal highs. The yellow metal was supported by US dollar weakness, declining real yields, ongoing geopolitical tensions in the Middle East, and continued buying, namely by central banks and China.
Sources: Alerian, Bloomberg L.P., EPRA, FTSE International Limited, Intercontinental Exchange, Inc., MSCI Inc., National Association of Real Estate Investment Trusts, Standard & Poor’s, and Thomson Reuters Datastream. MSCI data provided “as is” without any express or implied warranties.
Note: Gold performance based on spot price return.
USD-Based Investors
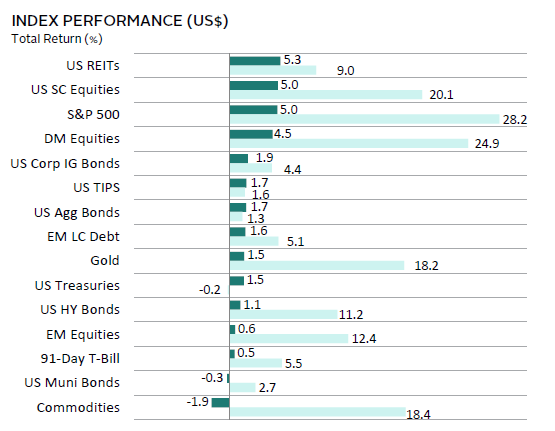
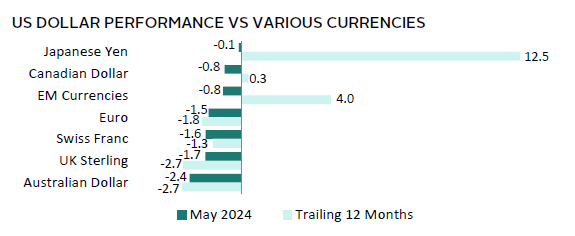
Risk assets rallied in May, supported by falling bond yields amid softer US economic data. Developed equity markets gained the most, led by the United States, where small caps advanced on par with large caps. EM returns were lackluster by comparison, as Chinese stocks sold off into month end. Bond markets gained across the board, save for munis, where strong supply has been a headwind, supporting higher yields. Real assets categories were mixed. Interest rate–sensitive REITs outperformed and gold rose to all-time highs in nominal terms, while slumping oil prices weighed on commodities.
The US dollar broadly depreciated in May. Softer economic and inflation data contributed to falling bond yields and expectations for lower interest rates, weighing on the greenback. It lagged the most versus the Australian dollar and UK sterling, where rate expectations turned higher.
CPI inflation matched expectations, slowing to 3.4% YOY in April. This eased investor concerns, as the prior four prints were hotter than expected. Aggregate economic data also underwhelmed expectations by the widest margin in more than a year, reinforcing the notion that inflationary pressures were likely easing. Labor market data softened, monthly retail sales were flat, services sector activity contracted, and leading economic indicators declined. However, the Federal Reserve Bank of Atlanta’s month-end estimate still suggested robust GDP growth of 2.7% annualized in Q2. Additionally, preliminary PMI data for May unexpectedly rose to a 25-month high and consumer confidence rebounded. Fed officials struck a more hawkish tone, apparently unswayed by the data updates in May.
Sources: Bloomberg Index Services Limited, FTSE International Limited, Frank Russell Company, Intercontinental Exchange, Inc., J.P. Morgan Securities, Inc., MSCI Inc., National Association of Real Estate Investment Trusts, Standard & Poor’s, and Thomson Reuters Datastream. MSCI data provided “as is” without any express or implied warranties.
EUR-Based Investors
Risk assets rallied in May, supported by falling US bond yields and signs of stronger economic activity in Europe. European equity markets outperformed broader developed stocks, with small caps gaining the most. EM returns were lackluster by comparison, as Chinese stocks sold off into month end. Corporate bonds gained, but hotter inflation weighed on sovereigns. Real assets categories were mixed. Interest rate–sensitive REITs outperformed, while slumping oil prices weighed on commodities.
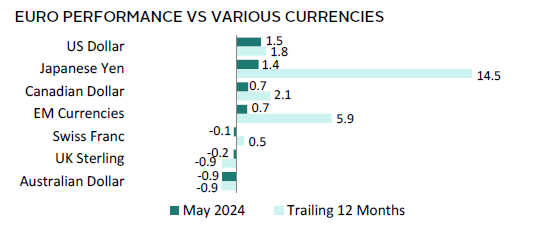
Euro performance was mixed in May, reflecting shifts in central bank policy expectations. The euro depreciated the most versus the Australian dollar and UK sterling, where inflation was hotter than expected and rate expectations adjusted in kind. Conversely, softer US economic data and slowing inflation led to the euro appreciating versus the US dollar.
The Eurozone economy appeared to have bottomed as momentum in activity indicators improved. Preliminary PMI data for May rose to a 12-month high, highlighted by increasing new orders, employment, and the strongest business confidence in more than two years. Further, retail sales and industrial production topped expectations, while the unemployment rate fell 10 bps to 6.4%. Sweden’s central bank, the Riksbank, cut policy rates by 25 bps, following a similar move by the Swiss National Bank earlier this year. The ECB is largely expected to follow suit in June despite some signs of hotter-than-expected inflation.
Sources: Bloomberg Index Services Limited, EPRA, European Banking Federation, FTSE Fixed Income LLC, FTSE International Limited, Intercontinental Exchange, Inc., J.P. Morgan Securities, Inc., MSCI Inc., National Association of Real Estate Investment Trusts, Standard & Poor’s, and Thomson Reuters Datastream. MSCI data provided “as is” without any express or implied warranties.
GBP-Based Investors
Risk assets rallied in May, supported by falling US bond yields and improving economic activity in Europe. Domestically oriented UK mid caps posted top marks as data revealed that the UK economy exited a recession in Q1 2024. EM returns were lackluster by comparison, as Chinese stocks sold off into month end. UK bond markets gained, but hotter inflation and delayed rate cut expectations capped returns. Real assets categories were mixed. Interest rate–sensitive REITs outperformed, while slumping oil prices weighed on commodities.
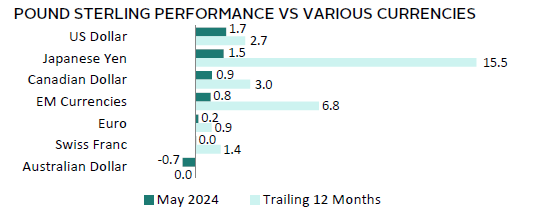
UK sterling broadly appreciated in May, reflecting shifts in central bank policy expectations. Indeed, the pound only depreciated versus the Australian dollar, where hotter inflation led the central bank to delay its rate cut outlook. Sterling gained the most versus the US dollar, with softer US economic data and slowing inflation weighing on the greenback.
In the United Kingdom, the BOE presented a dovish outlook in early May. However, April inflation data released later in the month slowed less than expected and shorter-term trends inflected higher. Although headline inflation cooled to the lowest YOY rate in nearly three years (2.3%), it was driven largely by one-off factors. Of concern was services inflation, which remained elevated at 5.9% YOY. Further, Prime Minister Sunak called a general election for early July, with the Labour Party largely expected to take the majority. With these factors combined, markets pushed back expectations for a rate cut from June to sometime in 2H 2024. Other economic data showed that the economy expanded 0.6% in Q1 2024—exiting a technical recession—and manufacturing activity picked up to a nearly two-year high.
Sources: Bloomberg Index Services Limited, EPRA, FTSE International Limited, Intercontinental Exchange, Inc., J.P. Morgan Securities, Inc., MSCI Inc., National Association of Real Estate Investment Trusts, Standard & Poor’s, and Thomson Reuters Datastream. MSCI data provided “as is” without any express or implied warranties.
Performance Exhibits
All data are total returns unless otherwise noted. Total return data for all MSCI indexes are net of dividend taxes.
USD-Based Investors index performance chart includes performance for the Bloomberg US Aggregate Bond, Bloomberg US Corporate Investment Grade, Bloomberg US High Yield Bond, Bloomberg Municipal Bond, Bloomberg US TIPS, Bloomberg US Treasuries, ICE BofAML 91-Day Treasury Bills, FTSE® NAREIT All Equity REITs, J.P. Morgan GBI-EM Global Diversified, LBMA Gold Price, MSCI Emerging Markets, MSCI World, Russell 2000®, S&P 500, and S&P GSCI™ indexes.
EUR-Based Investors index performance chart includes performance for the Bloomberg Euro-Aggregate: Corporate, Bloomberg Pan-Euro High Yield (Euro), EURIBOR 3M, FTSE EMU Govt Bonds, FTSE Euro Broad Investment-Grade Bonds, FTSE® EPRA/NAREIT Europe ex UK RE, J.P. Morgan GBI-EM Global Diversified, LBMA Gold Price AM, MSCI Emerging Markets, MSCI Europe, MSCI Europe ex UK, MSCI Europe Small-Cap, MSCI World ex EMU, MSCI World, and S&P GSCI™ indexes.
GBP-Based Investors index performance chart includes performance for the Bloomberg Sterling Aggregate: Corporate Bond, Bloomberg Sterling Index-Linked Gilts, ICE BofAML Sterling High Yield, FTSE® 250, FTSE® All-Share, FTSE® British Government All Stocks, FTSE® EPRA/NAREIT UK RE, J.P. Morgan GBI-EM Global Diversified, LBMA Gold Price AM, LIBOR 3M GBP, MSCI Emerging Markets, MSCI Europe ex UK, MSCI World, MSCI World ex UK, and S&P GSCI™ indexes.
EM currencies is an equal-weighted basket of 20 emerging markets currencies.
Fixed Income Performance Table
Performance data for US TIPS reflect the Bloomberg US TIPS Index, with yields represented by the Bloomberg Global Inflation Linked Bond Index: US.
