US inflation has spiked to multi-year highs, and the labor market has staged a strong but uneven recovery from the depths of the pandemic. In recent months, this has prompted the US Federal Reserve to change its future policy rate guidance from no hikes until at least 2024 to two 25 basis point (bp) increases in 2023. Fed officials are also openly discussing the need to start planning for a reduction in their regular purchases of US Treasuries and mortgage-backed securities (MBS). Furthermore, the Fed has been clear that future interest rate hikes and the tapering of asset purchases will be dependent on progress made toward their employment and inflation goals, which were recently redefined following a comprehensive policy review. But what are those goals and how close is the US economy to meeting them, particularly considering the rise of the highly contagious Delta variant of the coronavirus? In this paper, we review the Fed’s new policy framework, consider how current inflation and employment data match up with its goals, and review what’s implied by market pricing.
A Refresher on the New Fed Framework
A key feature of the policy overhaul was an adjustment to the Fed’s inflation goal. The Fed did not change their 2% inflation target, reaffirming that such a level is consistent with their dual mandate of achieving maximum employment and price stability. They did, however, change the way they express that target, adopting the concept of Flexible Average Inflation Targeting (FAIT). As noted in their own words:
“In order to anchor longer-term inflation expectations at this [2%] level, the Committee seeks to achieve inflation that averages 2% over time, and therefore judges that, following periods when inflation has been running persistently below 2%, appropriate monetary policy will likely aim to achieve inflation moderately above 2% for some time.”
The main difference between this approach and its prior policy is the goal of achieving “inflation that averages 2% over time.” But the Fed has not clearly defined what “over time” means, leaving the actual horizon they are considering up to interpretation. This change was also made on the heels of the post–Global Financial Crisis (GFC) period when year-over-year inflation rates struggled to meet the Fed’s 2% objective, implying that they would allow inflation in the current cycle to run above 2% to make up for past misses to the downside and ensure inflation expectations do not deviate from the 2% goal.
The other primary takeaway from the Fed’s new policy regime is a particular focus on ensuring strong employment outcomes. Specifically, the new policy statement notes that:
“…it would not be appropriate to specify a fixed goal for employment; rather, the Committee’s policy decisions must be informed by assessments of the shortfalls of employment from its maximum level, recognizing that such assessments are necessarily uncertain and subject to revision.”
Their new approach, focusing on employment shortfalls rather than achieving maximum employment outright, suggests that seemingly tight labor markets without broader inflationary pressures may not warrant a tighter monetary stance, as it may reflect underlying labor market slack. In the past, the Fed has raised rates in such a scenario. While the Fed still acknowledges that maximum employment is not directly measurable, we can look at where employment stands relative to the pre-pandemic level as a low-hurdle benchmark to judge shortfalls. The Fed also directly identified that achieving maximum employment is a broad-based and inclusive goal, suggesting it will consider a range of measures to assess the labor market, such as employment statistics across different racial groups, gender, and educational attainment.
Navigating Uncharted Waters
The US economy has rebounded strongly from the depths of the pandemic, but where does this rebound stand in the context of the Fed’s new approach? In the following analysis, we look at various longer-term inflation measures and several employment metrics in an attempt to put some data against the more qualitative policy framework described by the Fed.
Inflation Roars Back
Year-over-year core Personal Consumption Expenditures Price Index (PCE) inflation, the Fed’s preferred metric, mostly undershot the stated 2% target over the past decade (Figure 1). In fact, the trailing five- and ten-year annualized value of this inflation metric persistently failed to hit target, ranging from about 1.5% to 1.8%. From this starting point, the new policy framework suggests the Fed is now willing to tolerate above-target inflation for some time. Recently, inflation has done just that. Core PCE surged over the past several months and hit 3.5% year-over-year in June, the highest clip in 30 years. Headline and core Consumer Price Index (CPI) reads have been even stronger, registering 5.4% and 4.5% in June, respectively, which are also post-GFC highs.

FIGURE 1 SINCE THE GFC, US CORE PCE INFLATION RATES HAVE MOSTLY REMAINED BELOW THE 2% TARGET
June 30, 2016 – June 30, 2021 • Percent (%)
Sources: Thomson Reuters Datastream and US Department of Commerce – Bureau of Economic Analysis.
The strong inflationary uptick has also pushed most trailing inflation metrics above, or near, the Fed’s 2% target (Figure 2). Data appear to provide some rationale behind the Fed anticipating the need to raise rates sooner than previously expected. The key uncertainty is just how temporary the recent strong inflationary data will be; whether inflation will abate once conditions normalize (as the Fed generally believes), or if inflation will be stickier in this cycle.
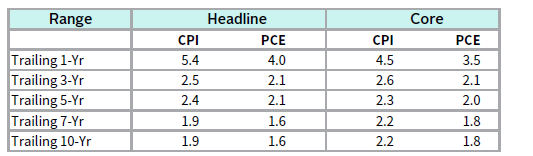
FIGURE 2 US INFLATION IS AT OR NEAR THE FED’S TARGET FOLLOWING RECENT STRONG DATA PRINTS
As of June 30, 2021 • Percent (%)
Sources: Thomson Reuters Datastream, US Department of Commerce – Bureau of Economic Analysis, and US Department of Labor – Bureau of Labor Statistics.
Note: Inflation rates for horizons greater than one year are annualized.
More Room for Employment Gains
The US economy lost 22.4 million jobs as a result of the COVID-19 pandemic, but has recovered 16.7 million jobs since April 2020. Still, despite the swift recovery, US employment levels remain nearly 6 million below those reached pre-pandemic (Figure 3).
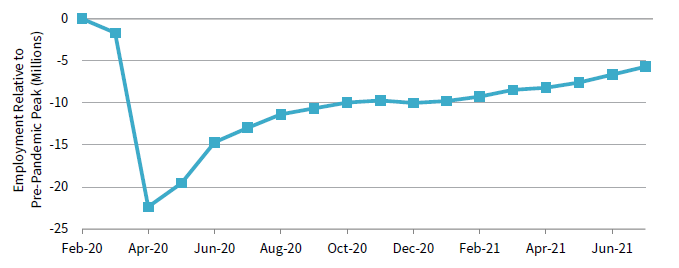
FIGURE 3 US EMPLOYMENT REMAINS BELOW PRE-PANDEMIC PEAK
February 29, 2020 – July 31, 2021
Sources: Thomson Reuters Datastream and US Department of Labor – Bureau of Labor Statistics.
The unemployment rate has also made a strong comeback, hitting 5.4% in July relative to a peak of 14.8% in April 2020. The Fed will be looking for further unemployment rate improvement, however, given the jobless rate bottomed at 3.5% prior to the onset of the pandemic. The current rate also remains above the non-accelerating inflationary rate of unemployment (NAIRU) of 4.5%, as estimated by the US Congressional Budget Office. While the relationship between unemployment and inflation has received increased scrutiny over the past several years, it remains an important theory in the world of economics that at least a few more hawkish Federal Open Market Committee (FOMC) members are likely to consider.[1]In past cycles, the Fed has preemptively raised interest rates in the absence of high inflation on the belief that low unemployment leads to higher inflation. But the empirical relationship between … Continue reading Broader measures of unemployment, such as the U-6 rate—which includes those marginally attached to the labor force and part-time workers that would prefer full-time employment—have improved to a similar extent but also remain well above pre-COVID-19 levels. These broader, population-wide metrics hide a sharp disparity across race and education levels (Figure 4). While the jobs market has made a substantial recovery, the employment situation may bias the Fed toward a loose policy stance, given the continued room for improvement.
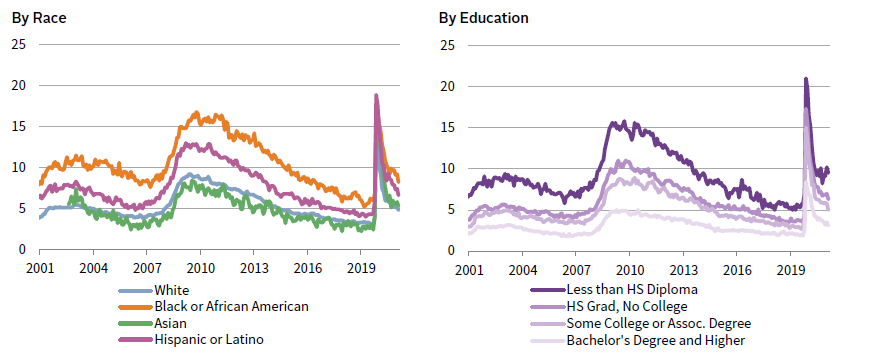
FIGURE 4 US UNEMPLOYMENT BY RACE AND EDUCATION ACCENTUATE FURTHER ROOM FOR IMPROVEMENT
June 30, 2001 – July 31, 2021 • Percent (%)
Sources: Thomson Reuters Datastream and US Department of Labor – Bureau of Labor Statistics.
Of note on the employment front is that current jobs available are matching the number of unemployed nearly one-to-one, driven by both falling unemployment and record job openings (Figure 5). For context, over the past ten years, unemployed levels have outnumbered job openings by nearly 4 million, on average, so the market looks relatively tight from this perspective. Still, the pandemic may have changed the composition of the labor market in ways we do not yet understand, and the current jobs available may not match the skills or preferences of the labor force seeking them. Indeed, difficulty finding staff has been a key feature of recent business surveys, as firms seek to fulfill surging, pent-up demand. It’s possible the current labor market setup could lead to higher wages, which—combined with climbing input costs—could be passed on to consumers in the form of higher prices, adding an additional layer of consideration in the Fed’s policy calculus.
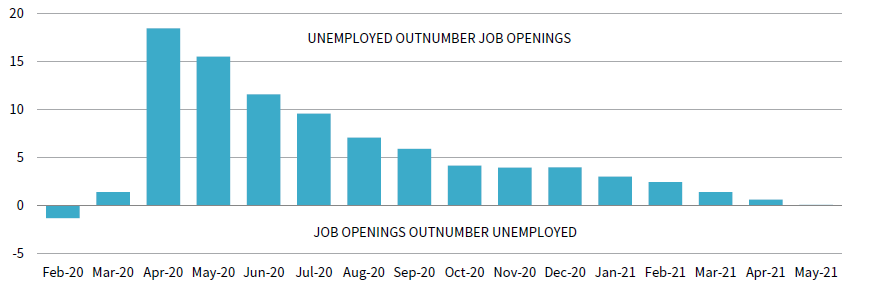
FIGURE 5 LABOR MARKET APPEARS TIGHT COMPARING NUMBER OF JOB OPENINGS AND UNEMPLOYED
February 29, 2020 – May 31, 2020 • Unemployment less Job Openings (Millions)
Sources: Thomson Reuters Datastream and US Department of Labor – Bureau of Labor Statistics.
Tapering Asset Purchases
It seems appropriate that the Fed is beginning to set the stage for unwinding some of its easy money policies. But prior to raising interest rates, the Fed will likely start to taper its asset purchases; Chairman Jerome Powell indicted that this was the preferred approach on multiple occasions this year. To be clear, tapering asset purchases doesn’t mean the Fed will immediately stop buying $80 billion of Treasury securities and $40 billion of agency MBS per month, as has been the case since the middle of last year. Instead, it means it will slowly reduce the amount of purchases each month.
In second quarter 2021, the Fed began to say it was discussing the need to plan for tapering asset purchases at future meetings. Its careful language was aimed at keeping markets calm. The Fed took the tapering discussion a bit further at the July FOMC meeting, when Chairman Powell noted for the first time that the Fed discussed tapering details such as timing, composition, and pace. The only details Powell divulged were that Treasury and MBS purchases will likely be tapered at the same time, though MBS purchases could be reduced at a faster pace. Finally, the Fed established two liquidity facilities aimed at keeping interest rates in check and easing any dollar funding pressures that could result from tapering. Based on the Fed’s steps in July, it is widely believed a formal timeline for tapering could be announced later this year.
But the lack of specific tapering details following the July meeting may highlight divisions among policymakers regarding the appropriate timing and pace of unwinding current easy money policies. Powell admitted as much at the July press conference, noting that “there’s a range of views” on the optimal path forward. Yet any formal announcement is unlikely to catch markets off-guard, as the Fed will want to give an ample lead-in when beginning any operation and proceed gradually. In fact, the New York Fed’s latest survey of primary dealers and market participants shows the market expects tapering could begin during first quarter 2022, lasting a year in duration, with the pace spread proportionally across Treasuries and MBS.
Comparing Fed and Consensus Market Expectations
The Fed’s estimate and the consensus analyst estimate of key macro variables and the path of policy normalization are well-aligned. Both expect year-over-year core PCE price inflation to fall to 2.1% by year-end 2022, reflecting the widely held view that recent high inflation is temporary (Figure 6). While year-over-year inflation rates could slow from here, the implied path means that most longer-term trailing measures would still hit the Fed’s 2% target. The Fed and market also expect the unemployment rate to fall to around 4%. Further, consensus estimates for job market gains imply that payrolls will reach their pre-pandemic levels by the end of next year, effectively recovering all jobs lost during the height of the pandemic.
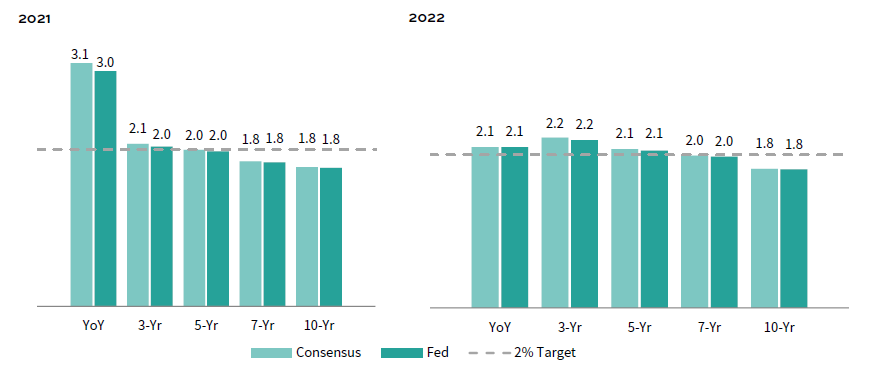
FIGURE 6 MOST TRAILING INFLATION RATES ARE EXPECTED TO REACH THE FED’S TARGET BY YEAR-END 2022
Percent (%)
Sources: Bloomberg L.P., Federal Reserve, Thomson Reuters Datastream, and US Department of Commerce – Bureau of Economic Analysis.
Expectations for the federal funds target rate are also similar. The Fed’s June 2021 projection materials showed that expectations for the midpoint of the fed funds rate target range by 2023 stood at 0.6% (Figure 7). Trading in federal funds rate futures show that markets are pricing in a fed funds target range midpoint of 0.68%. Fed funds futures also imply the market expects the first full 25 bp rate hike will occur around the end of first quarter 2023.

FIGURE 7 THE FED AND MARKET EXPECT TWO 25 BASIS POINT RATE HIKES IN 2023
June 2021 – December 2023 • Percent (%)
Sources: Bloomberg L.P. and Federal Reserve.
Note: FOMC median estimates are based on linear change between year-end estimates.
The Fed and markets have rarely been in such agreement historically. During 2013’s Taper Tantrum, market rate hike expectations spiked, but the Fed did not end up raising rates until the end of 2015. Then, the market largely lagged the Fed during the rate hiking cycle of 2015–18, expecting fewer rate increases than the Fed ultimately delivered. Today’s alignment could be attributed to the new FAIT regime and uncertainty regarding the Fed’s forward path leading market participants to place more weight on Fed communications and forecasts. Indeed, the Fed’s hawkish surprise following the June 2021 meeting sent equity and rates markets scrambling, but the repricing proved short-lived, as both markets largely recovered just one week later after expectations recalibrated.
Conclusion
Despite the Fed and market’s apparent accord today, many uncertainties remain and expectations can evolve rapidly. Assessing the stickiness of the past several month’s inflationary bout will remain key to the outlook. If inflation continues to exceed expectations, the Fed may opt for a more accelerated tightening schedule. But, if the economy progresses as expected, the Fed could still wait longer to tighten policy than is currently anticipated given uncertainty regarding just how hot they are willing to let growth and inflation run. The emergence of the COVID-19 Delta variant adds an additional layer of uncertainty, given its potential to stymie the global economic rebound. Ultimately, we think the market’s expectation of when the Fed may hike rates is reasonable and, if it is wrong, the Fed’s pace of tightening will likely be slower than anticipated to support an inclusive and broad-based recovery.
Stuart Brown, Associate Investment Director, Capital Markets Research
Footnotes