Global equities rallied in second quarter despite mounting trade and geopolitical uncertainties, as global central banks indicated a willingness to ease policy. Developed markets stocks outperformed emerging markets equivalents that were weighed down by declines in Chinese equities. Growth outgained value, while large caps bested small caps. Global economic growth concerns and falling inflation expectations provided a boost to global government bonds, while investment-grade and high-yield corporates also gained as credit spreads tightened. Among real assets, commodities declined on falling energy and industrial metals prices, dragging down returns for natural resources equities. Despite falling yields globally, REITs performance varied by region. The safe-haven Japanese yen and Swiss franc appreciated broadly, whereas the US dollar mostly depreciated, the euro was mixed, and UK sterling was broadly weaker.
Trade tensions continued to cast a shadow over the global economy in second quarter, yet equity markets still managed to post healthy gains, even as sovereign bond yields fell to multi-year lows. The puzzling divergence between stock prices and bond yields sent conflicting signals about the future economic outlook, driven in part by the ongoing unpredictability of the US-China trade war. At June’s G20 summit, Presidents Trump and Xi assuaged fears of further escalation, as the United States suspended implementing new tariffs on a proposed list of $300 billion worth of Chinese goods and lifted a ban on certain sales to Chinese tech giant Huawei. Still, the ongoing trade spat has not only dented recent sentiment indicators, but also has appeared to make a tangible impact on real economic activity—evidenced by a slowdown in trade volumes, manufacturing output, and business investment. Bond markets seemed to imply a worsening economic situation, as the US Treasury yield curve (10-year/3-month) was inverted for nearly half of the trading days in second quarter. Global central banks shifted to increasingly dovish policy stances, boosting investor appetite for risk assets. The Federal Reserve left rates unchanged, but removed the reference to being “patient” in its policy statement and committed to sustain the US expansion, now the longest on record. Likewise, the European Central Bank indicated it is prepared to cut interest rates or restart asset purchases, should tepid inflation continue to run below target. Amid lower yields and the prospect of increased economic uncertainty, investors flocked to gold, sending prices to six-year highs.
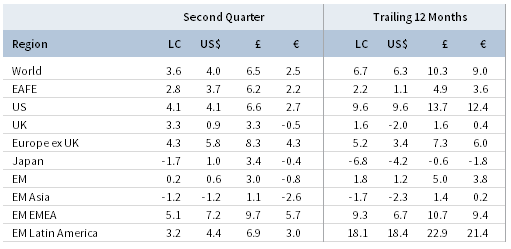
TOTAL RETURN FOR MSCI INDEXES (%)
US equities (4.3% for the S&P 500 Index) advanced to new all-time highs, outperforming broader developed markets for the second consecutive quarter. US stocks gained 18.5% year-to-date through June, outperforming nearly all major equity regions with the best first-half performance since 1997. Ten of 11 sectors delivered positive returns, led by cyclicals; financials, materials, information technology, and consumer discretionary gained the most, whereas energy posted the lone decline. Financials gained as markets priced a high probability of policy rate cuts in the coming months, which should support net interest margins in today’s flat-to-inverted yield curve environment. Notably, no banks failed the Fed annual stress test in late June, clearing the way for increased shareholder payouts in the form of dividends and stock buybacks. Growth outperformed value again in second quarter, while large caps bested small caps after underperforming in first quarter. Growth continued to outperform value despite an antitrust review of large technology companies unveiled by the House Judiciary Committee during second quarter. First quarter year-over-year earnings per share (EPS) growth in the United States turned negative for the first time since second quarter 2016, but reported results exceeded earlier analyst estimates for a more significant decline. US economic growth accelerated in first quarter to a 3.1% annualized rate, boosted by temporary factors such as inventories and net trade, while growth in consumer spending and business investment slowed. Despite an unemployment rate at 50-year lows, retail sales and personal consumption expenditures data released in second quarter showed only moderate growth and the Fed’s preferred inflation metric remained subdued, seemingly bolstering the case for the Fed to cut rates. Trade war uncertainty weighed on manufacturing activity, which appears, on some measures, to have filtered through to the services sector, though both remain in expansionary territory.
European equities (4.5% in USD, 3.0% in EUR, 7.0% in GBP) advanced and outperformed developed markets equivalents. Europe ex UK stocks outperformed their UK counterparts, with the latter buffeted by continued Brexit uncertainty amid a shakeup in the Conservative party’s leadership following Prime Minister Theresa May’s resignation; significant sterling depreciation detracted further from results in major currency terms. Emboldened by a strong showing in May’s European Parliament elections, Italy’s Northern League party re-committed to deficit-widening fiscal reforms in continued brinkmanship against the EU; this move prompted the European Commission to consider initiating an excessive deficit procedure for the first time after finding the euro area’s third-largest country in breach of budget rules. Furthermore, the party expressed enthusiasm over a plan to introduce “mini-BOTs,” a form of small-denomination IOUs, in an effort to circumvent EU debt rules and boost liquidity. Economic data released during the quarter showed that Europe’s economy rebounded in first quarter, while more recent gauges of manufacturing activity and industrial output remained weak. First quarter corporate EPS growth exceeded that of the United States, up just 1% year-over-year and largely aligned with expectations.
Japanese equities (1.0% in USD, -0.4% in EUR, 3.4% in GBP) underperformed broader developed markets in second quarter, declining nearly 2% in local currency terms. Japan also significantly underperformed year-to-date, delivering the lowest returns among major developed markets. The Bank of Japan (BOJ) held monetary policy steady during second quarter, but joined the dovish central bank chorus, indicating it could deliver more monetary stimulus if needed. Japan’s export-heavy economy expanded at a 2.2% annualized rate in first quarter, but underlying drivers of demand such as exports and private consumption declined. Trade uncertainty weighed on manufacturing activity indicators, which spent most of the quarter in contractionary territory, underscored by falling new orders and exports. Some bright spots emerged late in the quarter, however, as retail sales rebounded and industrial output growth exceeded expectations. Core inflation in Japan remained tepid and well off the BOJ’s target, while Japan’s Cabinet Office downgraded its assessment of the current economic situation.
Emerging markets equities (0.6% in USD, -0.8% in EUR, 3.0% in GBP) underperformed developed markets counterparts in second quarter, eking out a positive return in local currency terms. Heavily weighted emerging Asia declined in local currency terms, dragging down broader emerging markets as a whole, whereas emerging Europe, the Middle East & Africa, and Latin America gained. Index heavyweight China was the primary detractor from performance, declining the most among major emerging countries. China faced continued economic headwinds from the ongoing trade spat with the United States. Industrial output growth slowed to a 17-year low, and manufacturing activity returned to contractionary territory on falling factory output and new orders. Chinese authorities introduced several stimulus measures during the quarter to soften the growth slowdown, highlighted by the Finance Ministry easing restrictions for local governments to spend on infrastructure projects. Additionally, smaller banks received a boost as funding rates fell and limits on commercial paper sales eased. Among other large markets, Brazil and South Africa outperformed the most, while India, Korea, and Taiwan posted more muted returns. The segmented frontier equity market (4.7% in USD, 3.2% in EUR, 7.2% in GBP) outperformed both developed and emerging markets as index heavyweight Kuwait delivered double-digit performance and is set to be promoted to emerging markets status by MSCI in 2020.
Real assets performance was mixed in second quarter. Commodity futures (-1.2% for the Bloomberg Commodity TR Index and -1.4% for the energy-heavy S&P GSCI™ Index) declined due to industrial metals and energy, but were supported by precious metals. Copper, widely viewed as an indicator of global economic health, was among the worst-performing commodities, down 8%. Oil prices ($66.55 for Brent and $58.47 for WTI) shed nearly 3% amid the ongoing trade uncertainty, which likely contributed to OPEC and the International Energy Agency cutting their forward outlook for world oil demand. These dynamics outweighed a sharp decline in US inventories, heightened tensions in the Middle East, and expectations for further OPEC production cuts, all of which pressured the supply side of the market. Global natural resources equities (-0.7% for the MSCI World Natural Resources Index in USD terms) underperformed broader equities on weak underlying commodity prices, while MLPs (0.1% for the Alerian MLP Index) posted marginal gains. Global REITs performance varied by region despite falling yields globally. US REITs (1.8%) and developed Asia REITs (0.8% in USD) gained, whereas Europe ex UK REITs (-3.2%) and UK REITs (-1.9%) declined. Gold prices (9.0%) surged to $1,412.30/troy ounce as a weaker dollar, falling yields, and heightened geopolitical tensions—particularly the mounting situation between the United States and Iran—all contributed to investor interest in the safe-haven metal.
Fixed income assets gained broadly as yields reached multi-year lows amid global growth concerns and falling inflation expectations. US investment-grade corporate bonds (4.5%) gained the most among US bond categories, outperforming Treasuries (3.0%) and high-yield corporate bonds (2.5%). Five- and ten-year Treasury yields fell 47 and 41 basis points (bps) to 1.76% and 2.00%, respectively. Ten-year Treasury yields declined the most since first quarter 2016 and ended the quarter at the lowest month-end levels since October 2016. UK gilts (1.3%) advanced, but underperformed most other UK fixed income assets, as five- and ten-year gilt yields declined 10 and 14 bps to 0.61% and 0.89%, respectively. EMU government bonds (3.4%) outperformed US Treasuries and UK gilts as the German ten-year yield fell to the most negative levels on record, ending the month at -0.33%. US TIPS (2.9%) and tax-exempt municipal bonds (2.1%) also gained, but underperformed nominal Treasuries. UK linkers (1.9%) outgained nominal gilts, but underperformed sterling-denominated credits.
Among major currencies, the US dollar mostly depreciated, the euro was mixed, and UK sterling broadly weakened. Safe-haven currencies such as the Japanese yen and Swiss franc, along with the Canadian dollar, appreciated in second quarter. The greenback declined the most vis-à-vis the Japanese yen, Canadian dollar, and Swiss franc, but appreciated relative to UK sterling and the Australian dollar. US dollar performance was similarly mixed over the past year. The euro gained relative to UK sterling and the Australian and US dollars, but declined against the Japanese yen, Canadian dollar, and Swiss franc. The common currency was mostly weaker over the past year, falling the most against the Japanese yen and Swiss franc. UK sterling was broadly weaker in second quarter, depreciating most significantly versus the Japanese yen, Canadian dollar, and Swiss franc. Sterling generally weakened over the past 12 months, gaining only against the Australian dollar.
Market Exhibits
Escalated US-China trade tensions weighed on private sector activity. While manufacturing outside the United States remains in contractionary territory, more robust services sector data has buoyed overall composite PMIs. US strength abated in recent months as both manufacturing and services sectors slowed.
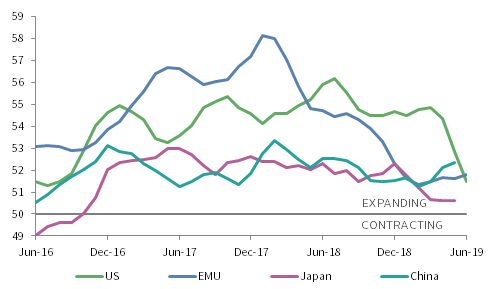
ROLLING 3-MONTH GLOBAL COMPOSITE PMIS
June 30, 2016 – June 30, 2019 • Percent (%)
Sources: Markit Economics and Thomson Reuters Datastream.
Notes: A PMI reading above 50 indicates an expanding economy. Composite PMI data for June 30, 2019 are flash estimates; data for Japan and China are through May 31, 2019.
Equity and bond markets sent conflicting signals regarding the economic growth outlook. Yields plunged on trade-related growth concerns, a dovish central bank pivot, and historically low inflation expectations, whereas equities continued to march higher despite the uncertain environment and signs of growth moderation.
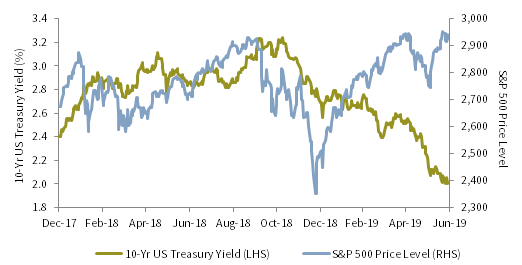
10-US TREASURY YIELDS VS S&P 500 PRICE LEVELS
December 30, 2017 –June 30, 2019
Note: Data are daily.
The level of negative yielding sovereign debt climbed, while negative yielding debt securities in aggregate reached record high levels. Japanese government bonds, German bunds, and French government bonds—which turned negative at the ten-year maturity for the first time—accounted for the majority of negative yielders.
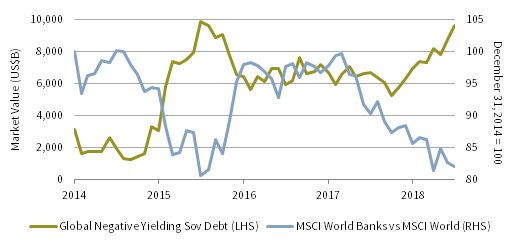
GLOBAL NEGATIVE YIELDING SOVEREIGN DEBT & RELATIVE CUMULATIVE WEALTH OF MSCI WORLD BANKS VS MSCI WORLD
December 31, 2014 – June 30, 2019 • US Dollar
Notes: Data are monthly. Global negative yielding sovereign debt represented by the Bloomberg Barclays Global Aggregate Treasuries Negative Yielding Debt Index. Total return data for all MSCI indexes are net of dividend taxes.
Gold prices rallied to six-year highs as falling yields reduced the opportunity cost of holding gold. Furthermore, heightened tensions between the United States and Iran spurred increased demand in the safe-haven yellow metal. Despite gold’s recent ascent, prices remain below nominal and inflation-adjusted peaks.
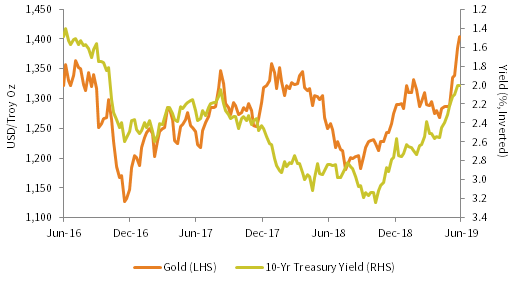
PRICE OF GOLD AND 10-YR TREASURY YIELD
June 30, 2016 – June 30, 2019
Notes: Data are weekly.
Currency Performance as of June 30, 2019
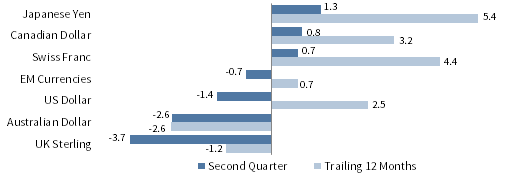
The US dollar generally depreciated, weakening the most versus the Japanese yen, Canadian dollar, and Swiss franc, but strengthening relative to UK sterling and the Australian dollar. The greenback’s performance was mixed over the past year, gaining against the Aussie dollar, UK sterling, and euro, but falling versus safe havens.
VERSUS THE US DOLLAR
Total Return (%)
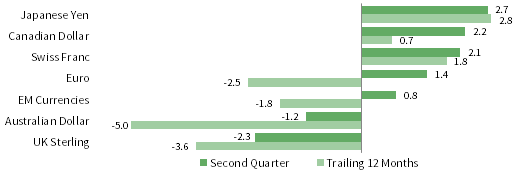
The euro appreciated the most vis-à-vis UK sterling and the Australian and US dollars, but depreciated against the Japanese yen, Canadian dollar, and Swiss franc. The common currency was mostly weaker over the past year, gaining in value relative only to the UK sterling and Australian dollar.
VERSUS THE EURO
Total Return (%)
UK sterling was broadly weaker in second quarter, declining the most relative to the Japanese yen, Canadian dollar, and Swiss franc. Only the Australian dollar declined versus sterling over the past year.
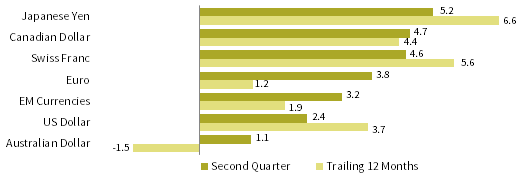
VERSUS THE POUND STERLING
Total Return (%)
Note: EM currencies is an equal-weighted basket of 20 currencies.
USD Market Performance as of June 30, 2019
Gold outperformed as trade tensions clouded the growth outlook. Investment-grade corporates bested all equities and delivered top US fixed income returns. Lower yields pushed investors up the risk spectrum, bidding up EM debt. Small caps and EM stocks underperformed among equities, while commodities posted the only decline.
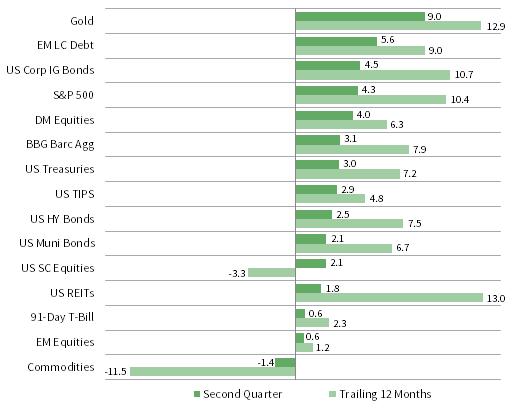
INDEX PERFORMANCE (US$)
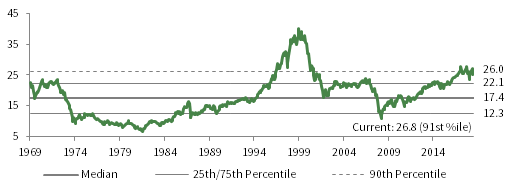
COMPOSITE NORMALIZED P/E: MSCI US
December 31, 1969 – June 30, 2019
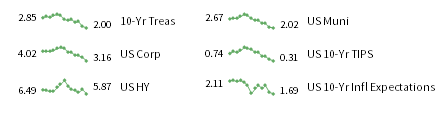
FIXED INCOME YIELDS
June 2018 – June 2019
Sources: Bloomberg Index Services Limited, Bloomberg L.P., BofA Merill Lynch, FTSE International Limited, Frank Russell Company, J.P. Morgan Securities, Inc., MSCI Inc., National Association of Real Estate Investment Trusts, Standard & Poor’s, and Thomson Reuters Datastream. MSCI data provided “as is” without any express or implied warranties.
Euro Market Performance as of June 30, 2019
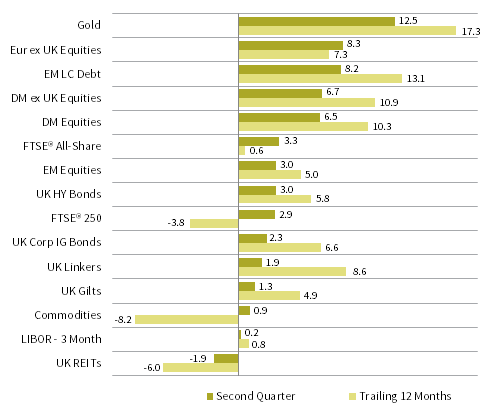
Gold prices rallied, but other real assets, such as commodities and REITs, declined. Large caps and DM equities outperformed their small-cap and EM equivalents, respectively, while UK stocks dragged down returns for Europe. EMU sovereign bonds outperformed investment-grade and high-yield corporate counterparts.
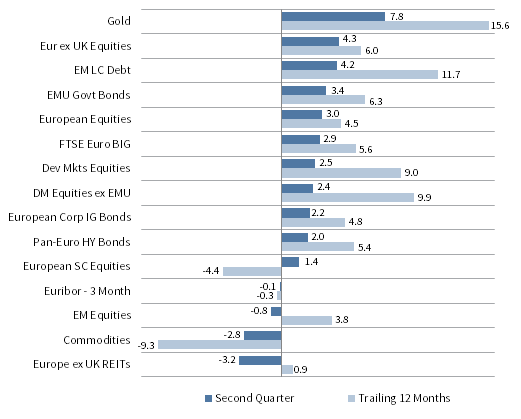
INDEX PERFORMANCE (€)
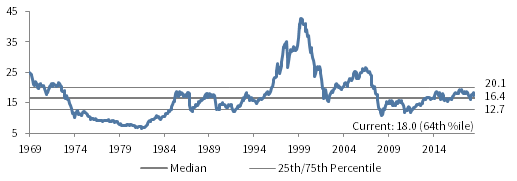
COMPOSITE NORMALIZED P/E: MSCI EUROPE EX UK
December 31, 1969 – June 30, 2019
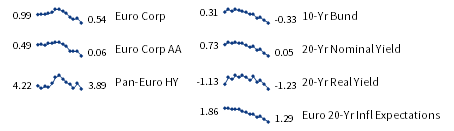
FIXED INCOME YIELDS
June 2018 – June 2019
Sources: Bloomberg Index Services Limited, Bloomberg L.P., Citigroup Global Markets, EPRA, FTSE International Limited, J.P. Morgan Securities, Inc., MSCI Inc., National Association of Real Estate Investment Trusts, Standard & Poor’s, and Thomson Reuters Datastream. MSCI data provided “as is” without any express or implied warranties.
GBP Market Performance as of June 30, 2019
UK equities underperformed European and DM peers as domestic large caps outperformed midcaps. High-yield bonds delivered top performance among UK bonds, besting investment-grade corporates and nominal gilts. Gold trounced other assets with double-digit performance for the quarter and over the past year.
INDEX PERFORMANCE (₤)
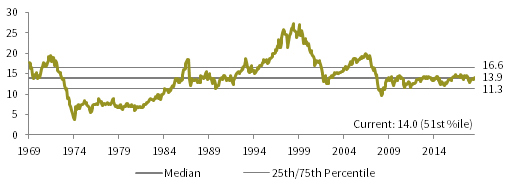
COMPOSITE NORMALIZED P/E: MSCI UK
December 31, 1969 – June 30, 2019
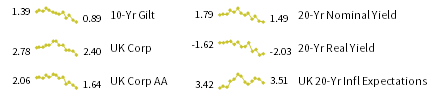
FIXED INCOME YIELDS
June 2018 – June 2019
Sources: Bloomberg Index Services Limited, Bloomberg L.P., BofA Merill Lynch, EPRA, FTSE International Limited, J.P. Morgan Securities, Inc., MSCI Inc., National Association of Real Estate Investment Trusts, Standard & Poor’s, and Thomson Reuters Datastream. MSCI data provided “as is” without any express or implied warranties.
Exhibit Notes
Performance Exhibits
Total return data for all MSCI indexes are net of dividend taxes.
US dollar index performance chart includes performance for the Bloomberg Barclays Aggregate Bond, Bloomberg Barclays Corporate Investment Grade, Bloomberg Barclays High-Yield Bond, Bloomberg Barclays Municipal Bond, Bloomberg Barclays US TIPS, Bloomberg Barclays US Treasuries, BofA Merrill Lynch 91-Day Treasury Bills, FTSE® NAREIT All Equity REITs, J.P. Morgan ELMI+, J.P. Morgan GBI-EM Global Diversified, MSCI Emerging Markets, MSCI World, Russell 2000®, S&P 500, and S&P GSCI™ indexes.
Euro index performance chart includes performance for the Bloomberg Barclays Euro-Aggregate: Corporate, Bloomberg Barclays Pan-Euro High Yield, Citigroup EMU Govt Bonds, Citigroup Euro Broad Investment-Grade Bonds, Euribor 3-month, FTSE® EPRA/NAREIT Europe ex UK, J.P. Morgan ELMI+, J.P. Morgan GBI-EM Global Diversified, MSCI Emerging Markets, MSCI Europe, MSCI Europe ex UK, MSCI Europe Small-Cap, MSCI World ex EMU, MSCI World, and S&P GSCI™ indexes.
UK sterling index performance chart includes performance for the Bloomberg Barclays Sterling Aggregate: Corporate Bond, BofA Merrill Lynch Sterling High Yield, FTSE® 250, FTSE® All-Share, FTSE® British Government All Stocks, FTSE® British Government Index-Linked All Stocks, FTSE® EPRA/NAREIT UK RE, J.P. Morgan ELMI+, J.P. Morgan GBI-EM Global Diversified, LIBOR 3M GBP, MSCI Emerging Markets, MSCI Europe ex UK, MSCI World, MSCI World ex UK, and S&P GSCI™ indexes.
Valuation Exhibits
The composite normalized P/E ratio is calculated by dividing the inflation-adjusted index price by the simple average of three normalized earnings metrics: ten-year average real earnings (i.e., Shiller earnings), trend-line earnings, and return on equity–adjusted earnings. We have removed the bubble years 1998–2000 from our mean and standard deviation calculations. All data are monthly.
Fixed Income Yields
US fixed income yields reflect Bloomberg Barclays Municipal Bond Index, Bloomberg Barclays US Corporate High Yield Bond Index, Bloomberg Barclays US Corporate Investment-Grade Bond Index, and the ten-year Treasury.
European fixed income yields reflect the BofA Merrill Lynch Euro Corporate AA Bond Index, BofA Merrill Lynch Euro Corporate Bond Index, Bloomberg Barclays Pan-European Aggregate High Yield Bond Index, Bloomberg Twenty-Year European Government Bond Index (nominal), ten-year German bund, 20-year European Inflation Swaps (inflation expectations), and the real yield calculated as the difference between the inflation expectation and nominal yield.
UK sterling fixed income yields reflect the Bank of England 20-year nominal yields, Bloomberg Generic UK 20-year inflation-linked (real) yields, ICE BofAML Sterling Corporate AA Bond Index, ICE BofAML Sterling Corporate Bond Index, and UK ten-year gilts.