Global risk asset performance was mixed in November, following a tumultuous October. Global equities enjoyed modest gains, led by emerging markets and US stocks, while developed ex US equivalents treaded water. Global large-cap stocks outgained small caps for the third month in a row, widening large caps’ year-to-date outperformance. Value stocks also outperformed for a third straight month, narrowing their wide performance gap relative to growth counterparts since January 2017. Defensive equity sectors also continued their recent outperformance relative to cyclicals. In a continuation from the previous month, global fixed income returns were mixed; sovereign bonds generally gained while riskier credits fell amid spread widening. Natural resources equities and energy MLPs declined, but their losses were relatively contained compared to the dramatic sell-off in crude oil. Developed markets REITs were among the top-performing asset classes for the month, though regional REIT performance varied considerably. Major currencies were mixed, with the US dollar, UK sterling, and the euro trading nearly flat relative to one another.
Global equities would not have finished November in the black had US equities not staged a late rally following Federal Reserve Chairman Jerome Powell’s public comments that the federal funds rate is now “just below” the range of projected levels considered neutral by Fed policymakers. The market’s positive reaction salvaged what had otherwise been a shaky month for risk assets, given heightened macroeconomic and geopolitical uncertainty. Earlier in the month, the so-called “FAANG” stocks, and a number of their popular internet and semiconductor brethren, saw sharp declines on myriad concerns including disappointing sales and profit guidance, greater regulatory scrutiny, and potential tariff impacts on global supply chains. Oil prices plunged into bear market territory, driven by disappointing economic growth outside the US, record US oil production and inventories, and news that the US had granted temporary relief to several oil importing countries from recently re-imposed US sanctions against Iran. In the United States, the midterm elections resulted in a split Congress, with Democrats regaining control of the US House of Representatives, as widely projected. In Europe, negotiators for the United Kingdom and EU struck a Brexit deal, but it is unclear whether the UK Parliament will approve the deal in a vote scheduled for December 11. Elsewhere on the Continent, the Italian government offered minor concessions to the European Commission (EC), but the budget standoff continues. Just after month end, the United States and China announced a tentative cease-fire regarding additional tariff increases but disagreed on details; whether further talks can yield a long-term resolution remains to be seen.

TOTAL RETURN FOR MSCI INDEXES (%)
US equities (2.0% for the S&P 500 Index) failed to sustain an early-month rally off the October lows but managed to outperform developed markets peers, due in part to comments near month end from Fed Chair Powell, which investors interpreted as dovish for interest rates going forward. Despite rising sharply late in the month, growth stocks underperformed value counterparts, although growth has still outperformed value by a wide margin year-to-date. Healthcare outperformed all other sectors, while information technology and energy fell the most. Third quarter earnings grew an estimated 27% year-over-year, representing the strongest growth rate since 2010 and coming in significantly above earlier estimates. In addition, non-farm payroll data came in well above consensus expectations, and average hourly earnings increased 3.1% year-over-year, the highest growth rate since 2009. Against such a strong economic backdrop, the Fed is expected to hike rates another 25 basis points (bps) at its December meeting, but Chairman Powell’s recent comments have created more uncertainty about the pace of rate hikes in 2019.
European equities (-0.9% in USD, -0.9% in EUR, and -0.8% in GBP) declined for the second month in a row, underperforming broader developed markets as political uncertainty continued to weigh on sentiment. After months of Brexit negotiations, the EU and the United Kingdom came to terms on a draft text of a withdrawal agreement and political declaration on the future relationship, but it was widely criticized by members of the UK Parliament across the political spectrum and quickly written off as inadequate by the more euro-skeptic politicians. As Prime Minister Theresa May’s leadership looks increasingly fragile amid a fractious political climate in the United Kingdom, the chances of a no-deal Brexit, a snap election, or even a new Brexit referendum—all outcomes seen as highly unlikely just a few months ago—have risen. Meanwhile, Italy’s Conte administration made minor concessions to the EC in its dispute over Italy’s planned budget deficit, including lowering the target to 2.2% of GDP from 2.4% previously, but the EC claimed these measures would not be enough to avoid sanctions, keeping the stand-off in flux. European earnings overall grew 10% year-over-year in third quarter but only 5% excluding the energy sector, and economic data continued to disappoint. Germany’s GDP shrank 0.2% in third quarter, its first drop since 2015. The Eurozone’s purchasing managers’ index (PMI) for manufacturing fell to a 30-month low, and its composite PMI (which includes services) hit a 47-month low, though both remain in expansion territory. Despite recent economic weakness, European Central Bank (ECB) Chairman Mario Draghi confirmed that the ECB still intends to wind-down new asset purchases by year end, however there appear to be no plans to begin shrinking its balance sheet or raising the policy rate in the near term.
Japanese equities (0.4% in USD, 0.5% in EUR, and 0.5% in GBP) eked out a positive return, slightly outperforming broader developed ex US markets in major currency terms, while local currency returns were slightly higher given modest yen weakness. Third quarter earnings came in at an underwhelming 5% year-over-year growth rate with less than half of companies beating EPS estimates. Third quarter GDP fell at a 1.2% annualized rate, below expectations and marking Japan’s second contraction in its last three quarters, although the weakness was due, in part, to multiple natural disasters suffered during the quarter. Other recent data points were more positive, including a robust 2.9% monthly increase in factory output, as well as a 3.5% yearly increase in retail sales, potentially signaling that the recent weakness in GDP is, in fact, temporary. Bank of Japan Governor Kuroda insisted that its stimulus program will continue indefinitely, emphasizing significant risks to the economy emanating from a slowdown in the Chinese economy and global trade tensions.
Emerging markets equities (4.1% in USD, 4.2% in EUR, and 4.3% in GBP) outperformed other risk assets, finding solid footing following a lengthy run of underperformance relative to developed markets. Outperformance was driven in part by lower interest rates, a softer US dollar, a rebound in metals prices, and a precipitous drop in oil prices that provided a boost to import-dependent countries such as India, China, South Africa, and Turkey. Additionally, relatively inexpensive valuations, particularly in the wake of the recent sell-off, likely led many investors to go bargain hunting, as evidenced by meaningful estimated non-resident portfolio flows into emerging markets during November. Among EM regions, emerging Asia and emerging Europe, the Middle East & Africa outperformed the broader index, while Latin America lagged in major currency terms—just one month after it led regional performance in the wake of Jair Bolsonaro’s landmark victory in the Brazilian presidential elections. Index heavyweight China’s official manufacturing PMI ticked down to exactly 50 in November, a level indicating the sector is neither expanding nor contracting and the latest in a series of recent data points signaling ongoing economic weakness. Frontier markets equites (2.2% in USD, 2.2% in EUR, and 2.3% in GBP) didn’t fare as well as EM counterparts but posted solid gains, led by strong returns in index heavyweight Argentina.
Real assets were mixed for the month. Commodity futures (-0.6% for the Bloomberg Commodity TR Index and -11.3% for the energy-heavy S&P GSCI™ Index) was the worst-performing asset class due to a drawdown of more than 20% in crude oil prices (ending November at $58.71 for Brent and $50.93 for WTI). Slightly more than 40% of the S&P GSCI™ Index is composed of crude oil-linked contracts, versus roughly 15% for the Bloomberg Commodity TR Index—a factor in the wide performance disparity. In an effort to keep oil prices low, the Trump administration granted temporary waivers to eight major buyers of Iranian oil, despite the re-imposition of US economic sanctions against Iran. A weakening global growth outlook and buoyant US inventory numbers also weighed heavily on oil markets. Energy MLPs (-0.8%) and natural resources equities (-3.7% for the MSCI World Natural Resources Index in USD terms) faltered, but losses were limited as natural gas prices surged and metals prices stabilized, in contrast with the sharp downward moves in oil prices. Developed markets REITs (3.8% in USD terms) had a strong month, but performance wasn’t distributed evenly; US REITs (5.1%) led regional performance, while Europe ex UK REITs (0.5%) were more muted and UK REITs (-4.5%) were bogged down by Brexit concerns.
Global fixed income returns varied as sovereign bonds managed slight gains (except for UK gilts), while riskier credits generally fell as spreads widened. US Treasuries (0.9%) rose as ten-year yields fell over 20 bps from intra-month highs and the benchmark ten-year versus two-year spread narrowed, ending the month just over 20 bps. Both five- and ten-year Treasury yields closed the month lower by 14 bps, at 2.84% and 3.01%, respectively. UK gilts (-1.2%) fell as heightened Brexit uncertainty appears to be causing gilt market distortions, as evidenced by an 18 bp spike in 20-year yields, even as five-and ten-year yields declined. EMU government bonds (0.6%) ended the month higher due, in part, to lower yields on German bunds and Italian BTPs, the latter despite heightened risks from the political showdown over Italy’s proposed budget. US credit spreads deteriorated for the second straight month as Treasuries outperformed both high-yield (-0.9%) and investment-grade (-0.2%) corporate bonds. Nominal Treasuries also outperformed US TIPS (0.5%), while slightly underperforming US tax-exempt municipal bonds (1.1%). Outside the United States, UK linkers (-3.3%) materially underperformed nominal gilts.
Among major currencies, the US dollar, UK sterling, and the euro traded nearly flat relative to one another, while the Canadian dollar and Japanese yen fell against all three. The Australian dollar and an equal-weighted basket of EM currencies strengthened the most during the month, as both benefited from the Fed’s cautious language about the pace of future rate hikes. The Swiss franc also appreciated relative to the greenback, pound, and euro
Currency Performance as of November 30, 2018
The US dollar was mixed in November, weakening versus the Australian dollar, an equal-weighted EM currency basket, and the Swiss franc, and barely appreciating vis-à-vis the euro and UK sterling, while strengthening relative to the Canadian dollar and Japanese yen. The US dollar has broadly appreciated over the trailing 12 months.
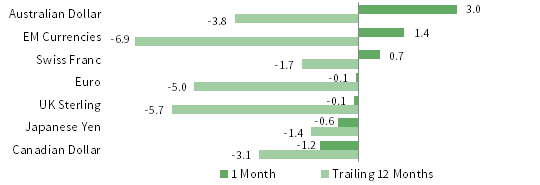
VERSUS THE US DOLLAR
Total Return (%)
The euro ceded ground last month to the Australian dollar, our EM currency basket, and the Swiss franc and treaded water versus the US dollar and UK sterling but gained relative to the Canadian dollar and Japanese yen. Over the past year, the euro mostly weakened; exceptions were UK sterling and EM currencies.
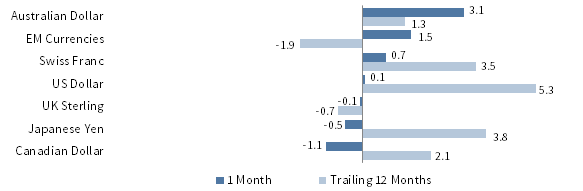
VERSUS THE EURO
Total Return (%)
UK sterling performed roughly in line with the US dollar and euro in November, strengthened versus the Canadian dollar and Japanese yen, and weakened vis-à-vis the Australian dollar, EM currencies, and the Swiss franc. Sterling is broadly weaker over the trailing 12 months, managing gains only relative to EM currencies.
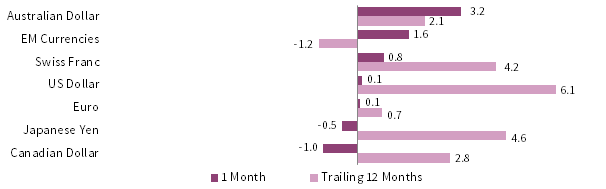
VERSUS THE POUND STERLING
Total Return (%)
Note: EM currencies is an equal-weighted basket of 20 currencies.
USD Market Performance as of November 30, 2018
US REITs rallied during November, as did EM assets, although the latter remain down over the past year. US equities also led DM stocks higher. Credit spreads widened further as Treasuries gained and US corporates retreated. Commodities suffered a major correction as oil prices plunged.
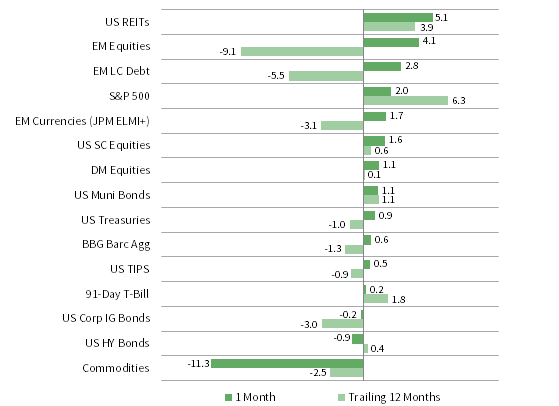
INDEX PERFORMANCE (US$)
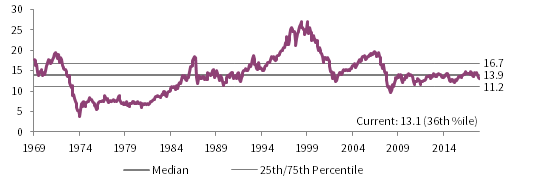
COMPOSITE NORMALIZED P/E: MSCI US
December 31, 1969 – November 30, 2018

FIXED INCOME YIELDS
November 2017 – November 2018
Sources: Bloomberg Index Services Limited, Bloomberg L.P., FTSE International Limited, Frank Russell Company, Intercontinental Exchange, Inc., J.P. Morgan Securities, Inc., MSCI Inc., National Association of Real Estate Investment Trusts, Standard & Poor’s, and Thomson Reuters Datastream. MSCI data provided “as is” without any express or implied warranties.
EUR Market Performance as of November 30, 2018
EM equities and debt posted the strongest gains last month but remain down over the trailing 12 months. DM stocks and EMU sovereigns also finished November higher; in contrast, European equities and corporate bonds posted losses as political uncertainty remains heightened. Commodities tumbled as crude futures sold off.
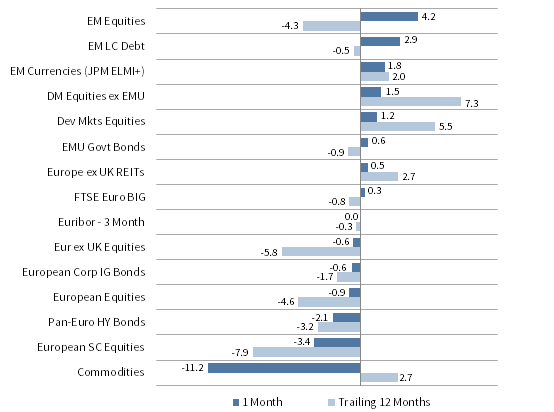
INDEX PERFORMANCE (€)
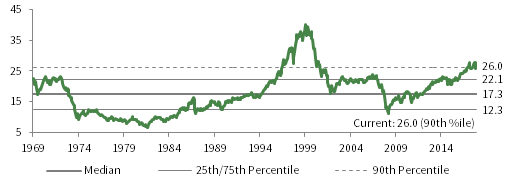
COMPOSITE NORMALIZED P/E: MSCI EUROPE EX UK
December 31, 1969 – November 30, 2018
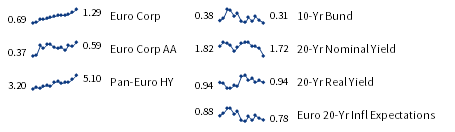
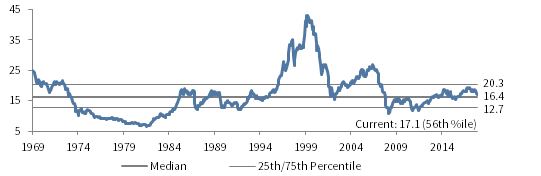
FIXED INCOME YIELDS
November 2017 – November 2018
Sources: Bloomberg Index Services Limited, Bloomberg L.P., EPRA, FTSE International Limited, J.P. Morgan Securities, Inc., MSCI Inc., National Association of Real Estate Investment Trusts, Standard & Poor’s, and Thomson Reuters Datastream. MSCI data provided “as is” without any express or implied warranties.
GBP Market Performance as of November 30, 2018
EM assets posted the best November returns. DM equities also gained; however, UK stocks retreated amid a tense domestic political debate over Brexit terms and UK REITs notably lagged other risk assets. UK gilts also declined but outperformed domestic corporate bonds and UK linkers, while commodities fell the most.

INDEX PERFORMANCE (₤)
COMPOSITE NORMALIZED P/E: MSCI UK
December 31, 1969 – November 30, 2018

FIXED INCOME YIELDS
November 2017 – November 2018
Sources: Bloomberg Index Services Limited, Bloomberg L.P., EPRA, FTSE International Limited, Intercontinental Exchange, Inc., J.P. Morgan Securities, Inc., MSCI Inc., National Association of Real Estate Investment Trusts, Standard & Poor’s, and Thomson Reuters Datastream. MSCI data provided “as is” without any express or implied warranties.
Exhibit Notes
Performance Exhibits
Total return data for all MSCI indexes are net of dividend taxes.
US dollar index performance chart includes performance for the Bloomberg Barclays Aggregate Bond, Bloomberg Barclays Corporate Investment Grade, Bloomberg Barclays High Yield Bond, Bloomberg Barclays Municipal Bond, Bloomberg Barclays US TIPS, Bloomberg Barclays US Treasuries, ICE BofAML 91-Day Treasury Bills, FTSE® NAREIT All Equity REITs, J.P. Morgan ELMI+, J.P. Morgan GBI-EM Global Diversified, MSCI Emerging Markets, MSCI World, Russell 2000® , S&P 500 and S&P GSCI™ indexes.
Euro index performance chart includes performance for the Bloomberg Barclays Euro-Aggregate: Corporate, Bloomberg Barclays Pan-Euro High Yield, FTSE EMU Govt Bonds, FTSE Euro Broad Investment-Grade Bonds, EURIBOR 3M, FTSE® EPRA/NAREIT Europe ex UK RE, J.P. Morgan ELMI+, J.P. Morgan GBI-EM Global Diversified, MSCI Emerging Markets, MSCI Europe, MSCI Europe ex UK, MSCI Europe Small-Cap, MSCI World ex EMU, MSCI World, and S&P GSCI™ indexes.
UK sterling index performance chart includes performance for the Bloomberg Barclays Sterling Aggregate: Corporate Bond, ICE BofAML Sterling High Yield, FTSE® 250, FTSE® All-Share, FTSE British Government All Stocks, FTSE British Government Index-Linked All Stocks, FTSE® EPRA/NAREIT UK RE, J.P. Morgan ELMI+, J.P. Morgan GBI-EM Global Diversified, LIBOR 3M GBP, MSCI Emerging Markets, MSCI Europe ex UK, MSCI World, MSCI World ex UK, and S&P GSCI™ indexes.
Valuation Exhibits
The composite normalized P/E ratio is calculated by dividing the inflation-adjusted index price by the simple average of three normalized earnings metrics: ten-year average real earnings (i.e., Shiller earnings), trend-line earnings, and return on equity–adjusted earnings. We have removed the bubble years 1998–2000 from our mean and standard deviation calculations. All data are monthly.
Fixed Income Yields
US fixed income yields reflect Bloomberg Barclays Municipal Bond Index, Bloomberg Barclays US Corporate High Yield Bond Index, Bloomberg Barclays US Corporate Investment-Grade Bond Index, and the ten-year Treasury.
European fixed income yields reflect the ICE BofAML Euro Corporate AA Bond Index, ICE BofAML Euro Corporate Bond Index, Bloomberg Barclays Pan-European Aggregate High Yield Bond Index, Bloomberg Twenty-Year European Government Bond Index (nominal), ten-year German bund, 20-year European Inflation Swaps (inflation expectations), and the real yield calculated as the difference between the inflation expectation and nominal yield.
UK sterling fixed income yields reflect the ICE BofAML Sterling Corporate AA Bond Index, ICE BofAML Sterling Corporate Bond Index, UK ten-year gilts, Bank of England 20-year nominal yields, and Bloomberg Generic UK 20-year inflation-linked (real) yields. Current Bank of England 20-year nominal yield data are as of November 29, 2018.