Executive Summary
- Managed futures refers to a subset of investment strategies that actively trade global fixed income, currency, commodity, and equity markets via futures and forward contracts.
- Approximately 70% of the capital deployed within managed futures programs is attributable to trend following strategies. Trend following is synonymous with momentum investing and is based on the premise that momentum is a recurrent phenomenon across virtually all tradable asset classes that can be systematically exploited through disciplined trading and risk management.
- The basic premise of trend following is to (1) systematically identify the onset of trends, (2) allow winning trades to run when sustained trends are identified, and (3) quickly exit losing trades when momentum proves to be short-lived and reverses course. Perhaps the most compelling aspect of the return profile of managed futures is their low correlation versus equities and strong performance history during severe bear markets. Our chosen proxy for managed futures, the Barclay BTOP50 Index, generated positive returns during four of the five largest peak-to-trough global equity market declines from 1990 to 2013, with a cumulative return of 82% in the 64 months making up these periods versus 29% for global bonds, -36% for hedge funds, and -87% for global equities.
- Following a period of exceptionally strong returns in conjunction with the global financial crisis, managed futures funds have experienced subpar results since early 2009. This may be attributed to several factors including (but not limited to) (1) zero interest rate policies, which virtually eliminated the interest income on collateral held by funds, (2) elevated correlations across risk assets that limited diversification opportunities, and (3) various forms of market intervention that resulted in abrupt and simultaneous trend reversals spanning multiple markets. While we cannot predict whether such conditions will persist in the future, we do know with certainty that the confluence of factors that have accompanied the underperformance of managed futures strategies in recent years is highly abnormal in a historical context.
- In an effort to improve risk-adjusted returns, many managers have sought to add strategies to CTA programs that complement trend following. Examples include counter-trend and pattern recognition strategies as well as carry trades and single security equity trading. To the extent that non-trend strategies detract from future performance during the type of market calamities that have historically favored trend followers, investors will have essentially diversified away the diversification potential of CTA strategies. The majority of managed futures funds are categorized as systematic, meaning that quantitative analysis and computing power play a prominent role in research, portfolio construction, implementation, and risk management. Notwithstanding the important role of technology, systematic investing should be viewed first and foremost as a human endeavor, where success hinges upon the creativity, expertise, analytical rigor, and ongoing commitment of talented and capable people.
- Successful CTA investors tend to (1) have a strong fundamental understanding of the sources of return within their strategy at a conceptual level, (2) be steeped in the scientific method, subjecting all investment ideas to rigorous and objective validation, (3) exhibit a healthy awareness of the limitations of quantitative and statistical analysis, (4) be extremely focused on risk management.
- Notwithstanding recent underperformance, we believe that managed futures funds, particularly trend following strategies, remain a valuable tool for portfolio diversification. The correlation properties versus equities are compelling, and the strategy’s liquidity characteristics bolster its role as a diversifier. Furthermore, given their unique sources of return and potential to generate outsized gains during stress periods, managed futures are highly complementary to other hedge fund strategies and may be viewed as a second line of defense against extreme risk scenarios.
This report provides an overview of managed futures investing, with a particular emphasis on systematic trend following strategies. Managed futures refers to a subset of investment strategies that actively trade global fixed income, currency, commodity, and equity markets via futures and forward contracts. The term “commodity trading advisor” or “CTA” is often used interchangeably with managed futures—we too will use both terms—notwithstanding the fact that many of the larger CTAs have migrated away from commodities over time in favor of foreign exchange, fixed income, and equity markets in an effort to mitigate capacity constraints and access a broader opportunity set. The term “managed futures” is also commonly associated with trend following, a momentum-based investment strategy that seeks to profit from the tendency of asset prices to exhibit trend behavior (i.e., persistence in absolute or relative returns from one period to the next).
While a significant majority of the capital invested and historical return experience of managed futures is attributable to trend following, individual managers commonly and increasingly employ complementary return drivers, such as counter-trend, mean reversion, pattern recognition, and value/carry-oriented strategies. Therefore, the creative tension between innovation and style drift and subtle evolutions in the risk/return profile of individual funds should be a focal point for investors considering an allocation to managed futures. Historically, managed futures funds have been excellent diversifiers, providing strong absolute returns during large equity market drawdowns. However, as with any diversifying asset, investors should assess their comfort level with the potential for these strategies to be a drag on performance at times, particularly during equity bull markets.
In this report we explore the investment rationale for trend following, how trend followers operate, the incorporation of non-trend strategies, the historical performance and potential role of managed futures within a portfolio, and how to evaluate managers.
Investment Rationale for Trend Following
Approximately 70% of the capital deployed within managed futures programs is attributable to trend following strategies. Trend following is synonymous with momentum investing and is based on the premise that momentum is a recurrent phenomenon across virtually all tradable asset classes that can be systematically exploited through disciplined trading and risk management. The prevalence of momentum in financial markets, and the resulting ability to generate excess returns by “buying winners and selling losers,” has been well chronicled over the years in academic and industry research. While much of this research has centered on equity returns,[1]See, for example, Narasimhan Jegadeesh and Sheridan Titman, “Returns to Buying Winners and Selling Losers: Implications for Stock Market Efficiency,” The Journal of Finance 48, no. 1 (March … Continue reading trend behavior among other assets such as currencies, commodities, and government bonds has also been demonstrated.[2]Clifford S. Asness, Tobias J. Moskowitz, and Lasse Heje Pedersen, “Value and Momentum Everywhere,” The Journal of Finance 68, no. 3 (June 2013): 929–985.
Notwithstanding the empirical arguments in favor of momentum investing, skeptics of trend following have pointed to the lack of a concise, straightforward, and widely accepted explanation of why the strategy should make money, particularly given its outright defiance of well-established investment paradigms such as the efficient market hypothesis and simple axioms such as “buy low and sell high.” In response to such criticism, proponents of trend following cite the excess returns generated by the strategy over time and offer arguments than can be broadly distilled into two categories: (1) those which contemplate the impact of investor psychology on asset prices and (2) those which reference other factors such as the structure of futures markets.
With respect to investor psychology, momentum may be viewed as a manifestation of slow and/or uneven reactions to new information, as market participants gather, assimilate, and act on information with varying degrees of speed and conviction. This is closely related to a phenomenon called “anchoring and adjustment,” which refers to the innate human tendency to make only incremental adjustments to forecasts and expectations when presented with new information. Such behavior is most harmful in an investment context when accompanied by large, unexpected changes in economic fundamentals (GDP growth, inflation, etc.) that bring about a broad re-pricing of risk in response to new information. In such scenarios, strategies that rely on mean reversion and a relatively stable equilibrium of prices will struggle. Meanwhile, trend following strategies, which are purely reactive in nature and therefore not captive to any particular market regime or outlook, are poised to benefit from large dislocations in asset prices that occur as markets move toward a new equilibrium.
In addition to theories rooted in behavioral finance, managed futures investors cite the structure of futures markets as a potential source of excess returns. At the broadest and highest level, futures markets are composed of hedgers and speculators. Speculators fulfill a necessary and valuable function by establishing trading positions that offset persistent mismatches in the exposures hedgers seek, thereby providing liquidity while assuming price risk. In exchange for this “service,” speculators, in aggregate, theoretically must earn a premium over time. While this premium may vary from one period to the next, its existence over time is an economic necessity. Therefore, notwithstanding the depth and liquidity of many futures markets, some amount of excess return should be available to skilled investors who are able to establish a trading edge and manage risk. The premium earned by skilled futures traders should be greatest during periods when price risk is elevated—in other words, during periods of extreme uncertainty and heightened volatility.
Whether a particular market trend is bullish or bearish in nature, the presence of large, sustained trends creates an ideal backdrop for investors that (1) allow winning trades to run while quickly cutting losers, (2) are equally comfortable being long or short, and (3) do not have a view on what is the “correct” price of an asset. Each of these is emblematic of trend following and, as a general matter, contrary to the common practices of long-biased, value-oriented investors. For this reason, trend following strategies may be expected to exhibit a unique return pattern when compared with value-focused long-only and hedge fund managers, and therefore play a complementary role in a portfolio when paired with such strategies. Indeed, this view is strongly supported by historical performance, as discussed later in this paper.
How Trend Followers Operate
The concept of trend following can be traced back as far as the 1930s, when quantitatively minded market observers began to experiment with the notion of creating trading systems that exploit recurrent patterns in price behavior. By some accounts, the intuition of trend following was a byproduct of the then-common practice of drawing time series charts by hand—a task that naturally lends itself to observing the intricacies of price behavior. While some of the first professionally managed trend following programs were launched in the 1940s, systematic trend following strategies administered through managed futures programs started to gain traction in the early 1980s, facilitated by advancements in computing power and inspired by the compelling returns achieved by successful commodity traders in the 1970s, some of whom codified their trading processes into discrete rules that could be applied across a range of markets. Since the 1980s, trend following has become increasingly scientific, as many firms now employ PhD researchers from quantitative disciplines and use sophisticated diversification and risk management techniques.
The basic premise of trend following is to (1) systematically identify the onset of trends, (2) allow winning trades to run when sustained trends are identified, and (3) quickly exit losing trades when momentum proves to be short-lived and reverses course. Trends are generally defined as situations where prices have begun to deviate from short-, intermediate-, or long-term averages in a meaningful way. The trading horizon of a trend following program refers to the look-back period throughout which the program seeks to identify the onset of trend activity. While there is no universal definition, strategies that use a look-back period of less than one month tend to be classified as short-term trend followers, those with a one- to three-month horizon as intermediate term, and those beyond three months as long term. Trading horizon is closely linked to the average holding period of positions, with shorter trading horizons generally corresponding with higher levels of portfolio turnover and a more dynamic and flexible asset mix. For this reason, the performance of short-, intermediate-, and long-term trend following programs may differ meaningfully over time, with certain market conditions favoring faster trading systems, others favoring slower systems. This leads many managers to run “blended” systems—which may include, for example, three- and twelve-month trading signals—in an effort to identify and capture a broader range of trading opportunities.
In addition to trading horizon, trend following programs may be differentiated on the basis of their risk level. One of the distinctions of well-managed CTAs is the ability to achieve a target level of volatility over time, plus or minus a modest margin of error. This is a function of the flexibility afforded by liquid and cost-effective trading instruments as well as the quantitative skills of the managers, who often scale individual positions up or down as capital market conditions evolve and their expected contributions to total portfolio volatility change. Indeed, some suggest that portfolio construction and risk management, rather than trend identification, are the primary sources of value added for skilled CTAs. However, a manager’s ability to achieve a targeted level of risk should not be equated with the outright avoidance of drawdowns. As a rough rule of thumb, investors should be prepared to tolerate a drawdown equivalent to a fund’s annualized standard deviation within a 12-month span, and a cumulative peak-to-trough drawdown approximately equivalent to two times the fund’s target annualized standard deviation. This is true across virtually all investment strategies, not just CTAs.
A third key differentiator among trend following programs is the mix of markets traded, sometimes referred to as the contract mix (referencing the usage of futures contracts). Many trend followers regard themselves as asset class generalists and seek to apply trend following methodologies to a broad range of asset classes. The resulting diversification enhances risk-adjusted returns by mitigating losses within individual markets. Trend followers cite their ability to take long or short positions across an array of asset classes—many are active in 100+ markets—as a key benefit of their strategy, and many purport to be short as often as they are long. For this reason, a given manager’s propensity to be long or short equities and bonds should be well understood prior to investing, along with the potential consequences for portfolio-wide diversification and risk control. For instance, a fund that aggressively shorts Treasury futures may be negatively exposed to a short-term flight to safety. Similarly, a fund with significant long-biased equity exposure will likely not function as a diversifier during abrupt, short-term declines in equity prices. Accordingly, notwithstanding the diversification potential implied by their long-term returns, trend following strategies should not be viewed as a first line of defense against short-term market declines.
Incorporation of Non-Trend Strategies
The practice of letting winning trades run while quickly cutting losers is indicative of the payoff structure of trend following. Programs tend to have a low-to-moderate success rate for winning trades (30% to 40%, depending on the system) but average gains on winning trades that are disproportionately large compared to average losses on unsuccessful trades. Poor performance is often attributable to the absence of sustained trends that lead to winning trades and/or the prevalence of trend reversals, which result in losses on previously established positions. In many cases, drawdowns are caused by a series of trend reversals, which inflict numerous small losses that have a sizeable collective impact on fund performance. Reversals also increase transaction costs, adding insult to injury as managers adjust positions to limit losses and re-orient their portfolios.
In an effort to mitigate drawdowns and improve risk-adjusted returns, many managers have added strategies to CTA programs that complement trend following. These include counter-trend and pattern recognition strategies, carry trades, and single security equity trading.
Counter-trend strategies seek to capture short-term mean reversion effects—for instance, establishing short positions in assets that appear to be temporarily overbought and long positions in assets that appear to be oversold. The payoff structure of counter-trend strategies is a mirror image of trend following; they tend to perform well in volatile, trendless markets and have a higher proportion of winning trades than trend following strategies, but with the caveat of smaller average gains per winning trade. Some CTAs also employ pattern recognition strategies, which use probabilistic forecasts based on factors such as cross-asset lead-lag relationships. While trend following is viewed as a reactive strategy given its responsiveness to near-term price action, pattern recognition is inherently predictive and may incorporate various forms of price and non-price data. For these reasons, pattern recognition is viewed as complementary to trend following.
Carry trades are another strategy employed by some CTAs seeking to diversify their sources of return. This entails, for instance, taking a short position in a low interest rate currency and a long position in a relatively high interest rate currency, thereby capturing the yield differential plus or minus any trading gains. While the FX carry trade is the most prevalent example, this principle can also be extended to fixed income and equity markets. The inherent risk of carry trades is their dependence on leverage and their vulnerability to sudden reversals.
Some CTAs also employ single security equity trading, investing a portion of the fund’s unencumbered cash in a market-neutral combination of long and short positions. Portfolios are typically highly diversified, actively traded, and informed by mathematical models that identify trading opportunities based on momentum, value, or fundamental factors.
Given the poor performance of trend following strategies since early 2009 (discussed in the next section), the development and incorporation of non-trend strategies will likely be an ongoing theme. While combining non-trend systems with trend following programs may reduce volatility and improve the risk-adjusted returns of an individual fund, investors should bear in mind that adding these strategies also increases complexity, and may introduce risks that undermine the portfolio-wide diversification benefits historically attained through trend following. To the extent that non-trend strategies detract from future performance during the type of market calamities that have historically favored trend followers, investors will have essentially diversified away the diversification potential of managed futures strategies.
Performance and Role in the Portfolio
Our analysis of the performance of managed futures programs begins in 1990, when the total assets managed by CTAs first exceeded $10 billion and several commonly cited measures of industry-wide performance were incepted. Our chosen proxy for CTA returns is the Barclay BTOP50 (Net) Index, an equally weighted index of managed futures programs designed to represent no less than 50% of the investable universe. From 1990 through 2013, managed futures generated approximately 90% of the returns of global equities (Figure 1) with less than 60% of the volatility.[3]Please see the appendix for detailed charts on historical returns, risk, and correlation. Perhaps the most compelling aspect of the return profile of managed futures is their low correlation versus equities (slightly negative throughout the full period) and strong performance history during severe bear markets. As shown in Figure 2, managed futures generated positive returns during four of the five largest peak-to-trough global equity market declines from 1990 to 2013, with a cumulative return of 82% in the 64 months making up these periods compared to 29% for global bonds, -36% for hedge funds, and -87% for global equities.

Figure 1. Cumulative Wealth of Managed Futures, Global Equities, and Global Bonds
January 1, 1990 – December 31, 2013
Sources: Barclays, Barclay Trading Group, MSCI Inc., and Thomson Reuters Datastream. MSCI data provided “as is” without any express or implied warranties.

Figure 2. Largest Drawdowns: Global Equities
January 1, 1990 – December 31, 2013
Sources: Barclays, Barclay Trading Group, Hedge Fund Research, Inc., MSCI Inc., and Thomson Reuters Datastream. MSCI data provided “as is” without any express or implied warranties.
Trend following strategies, in particular, appear poised to profit from any number of “tail risk events” given their ability to achieve broad exposure—many are simultaneously active in currency, fixed income, metal, energy, soft commodity, and equity markets globally—and to quickly re-orient portfolios in response to the emergence of price dislocations. As evidenced by the 2008 global financial crisis, sustained directional trends, which fuel outsized gains for trend followers, often occur during episodes of financial turmoil, when investor panic and institutional risk controls result in massive selling, reduced market liquidity, and the instigation of feedback loops (margin calls, drawdown limits, etc.) that reinforce selling pressure. Such episodes, which are often later characterized as “events” by market observers and historians, are typically composed of numerous interrelated, smaller events that occur in succession and bring about sustained directional trends in markets (the proverbial slow-moving train wreck). Whereas most strategies experience their greatest difficulty during such periods, trend following has, with a limited number of exceptions, generated strong absolute returns during periods of financial turmoil.
Many regard trend following as a “long volatility” strategy given its strong historical performance during periods of heightened volatility and because the payoff structure created by quickly cutting losing trades and letting winners run is analogous to a portfolio of long call and put options—frequent small losses in exchange for infrequent but outsized gains. As shown in Figure 3, the historical returns of CTAs are indeed positively correlated with implied volatility. While these data certainly support the case for managed futures as a diversifier when combined with assets that perform poorly when volatility is high and/or rising, we would stop short of categorically referring to the strategy as “long volatility.” The ability of trend followers to capture price movements is dependent on repositioning their portfolios in response to the emergence of a trend, which suggests that only sustained price movements beyond a certain threshold will translate to profits. Moreover, while trend following strategies benefit from volatility that is accompanied by sustained trends, they may suffer greatly during volatile, trendless periods in which large price movements are followed by sudden reversals. This is unlike long positions in options, which benefit directly from the price movements of a reference asset as well as changes in option pricing (implied volatility). Furthermore, unlike option contracts, which reference a specific asset, trend following programs are active in a broad range of markets, which may result in other trading positions fully or partially negating a manager’s ability to reap profits in any specific area. For this reason, trend following should not be viewed as a form of protection against any specific outcome. Investors should instead view the strategy as a second line of defense—behind macroeconomic hedges such as high-quality sovereign bonds—that is most likely to be additive to portfolios during large, sustained dislocations that span multiple asset classes. Of course, the impact of non-trend strategies must also be considered when evaluating the role of a particular managed futures fund within a portfolio.

Figure 3. Investment Returns and Volatility
January 1, 1990 – December 31, 2013
Sources: Barclays, Barclay Trading Group, CBOE, Hedge Fund Research, Inc., MSCI Inc., Standard & Poor’s, and Thomson Reuters Datastream. MSCI data provided “as is” without any express or implied warranties.
In many respects, managed futures are highly complementary to other hedge fund strategies. For instance, trend following programs, which seek to harness momentum across markets, are inherently complementary to bottom-up focused strategies, which seek to identify and exploit valuation anomalies within markets. Furthermore, equity- and credit-oriented hedge fund strategies that employ fundamental, value-driven investment methodologies focused on inefficient segments of markets may entail illiquidity risks that only become apparent during periods of extreme market stress. Managed futures funds do not entail this same type of illiquidity premium, and, accordingly, provide investors with favorable liquidity terms (typically monthly or quarterly) and a high likelihood of honoring those terms irrespective of market conditions.
While hedge funds are broadly known to be flexible and opportunistic, trend following programs are further distinguished within the hedge fund community by their responsiveness to market conditions and propensity to reverse their orientation from net long to aggressively net short as changes in market conditions warrant. CTAs can also be differentiated from other hedge fund strategies by the virtual absence of counterparty risk given their use of futures contracts, which are exchange-traded, collateralized, marked-to-market, and settled daily. As evidenced by the experience of investors throughout the 2000–02 US recession and the 2007–08 global financial crisis, managed futures have the potential to deliver a rare combination of strong returns and reliable liquidity during stress periods, providing a critical source of cash for spending and portfolio-wide rebalancing.
Given that managed futures funds have generated equity-like returns over time with strong performance during extended equity market declines, it follows that the strategy has, on average, underperformed outside of stress periods. As shown in Figure 4, annualized returns in the months corresponding to the five largest peak-to-trough equity market declines were 680 bps higher than in the remaining periods (11.9% versus 5.1%). Furthermore, as shown in Figure 5, the cumulative returns of managed futures from January 1990 through December 2013 are reduced by approximately 60% when excluding the 22% of monthly periods corresponding to the five largest global equity market drawdowns.

Figure 4. Managed Futures Annualized Returns: Stress vs Non-Stress Periods
January 1, 1990 – December 31, 2013
Sources: Barclay Trading Group, BofA Merrill Lynch, Federal Reserve, MSCI Inc., and Thomson Reuters Datastream. MSCI data provided “as is” without any express or implied warranties.
Notes: Stress periods used are five largest drawdown periods for global equities, as determined by MSCI All Country World Index, referenced in Figure 2. Excess return is over 91-day T-bill.

Figure 5. Cumulative Returns: Full Period vs. Non-Stress Periods
January 1, 1990 – December 31, 2013
Sources: Barclay Trading Group, BofA Merrill Lynch, Federal Reserve, MSCI Inc., and Thomson Reuters Datastream. MSCI data provided “as is” without any express or implied warranties.
Notes: Stress periods used are five largest drawdown periods for global equities, as determined by MSCI All Country World Index, referenced in Figure 2. Excess return is over 91-day T-bill.
Following a period of exceptionally strong returns in conjunction with the global financial crisis, managed futures funds have experienced subpar results since early 2009, prompting many to question whether the strategy is “broken” due to either capacity constraints or structural changes in markets that have somehow invalidated the trading systems of CTAs. Additional context regarding the long-term historical performance of managed futures is of some use here. While the extent of recent poor performance appears to be historically unique at first glance (Figure 6), the picture is somewhat distorted by the industry standard practice of including interest income in reported returns. Figure 7 shows the excess returns of managed futures over the risk-free rate, an approximation of trading gains exclusive of the yield earned on collateral and unencumbered cash, and reveals that neither the duration nor the severity of the recent underperformance of CTAs is unprecedented. Therefore, while asset growth and model obsolescence have likely impacted the performance of some managers, it’s difficult to conclude that broken models and/or excessive assets under management (AUM) fully explain the underperformance of managed futures in recent years.

Figure 6. Rolling Three-Year AACR: Barclay BTOP50 (Net)
December 31, 1992 – December 31, 2013
Sources: Barclay Trading Group, Barclays, BofA Merrill Lynch, Federal Reserve, Hedge Fund Research, Inc., MSCI Inc., and Thomson Reuters Datastream. MSCI data “as is” without any express or implied warranties.
Note: Excess return is over 91-day T-bill.

Figure 7. Rolling Three-Year AACR: Barclay BTOP50 (Net) Excess Return
December 31, 1992 – December 31, 2013
Sources: Barclay Trading Group, Barclays, BofA Merrill Lynch, Federal Reserve, Hedge Fund Research, Inc., MSCI Inc., and Thomson Reuters Datastream. MSCI data “as is” without any express or implied warranties.
Note: Excess return is over 91-day T-bill.
Turning our attention to trading conditions, the magnitude of market intervention throughout the 2009–13 timeframe is historically unique and had direct and profound implications for trend following strategies. The major themes impacting markets during this period were aptly summarized in our 2013 Global Market Commentary The Tug of War Continues, which discussed the opposing influences of deflationary forces and aggressive monetary easing, the net result of which was sharply elevated correlations among risk assets (Figure 8) and a recurring pattern of risk-on/risk-off behavior. These factors collectively represented a type of “perfect storm” for trend followers, as a series of counter-trend events in the form of market-moving policy surprises and interventions caused abrupt, severe, and simultaneous trend reversals spanning multiple asset classes. While reversals resulted in trading losses and increased transaction costs, elevated correlations also reduced the number of independent trends over time, impairing diversification and inherently reducing risk-adjusted returns. In addition, zero interest rate policies pursued by central banks virtually eliminated the interest income on collateral held by funds—a meaningful tailwind during prior periods.
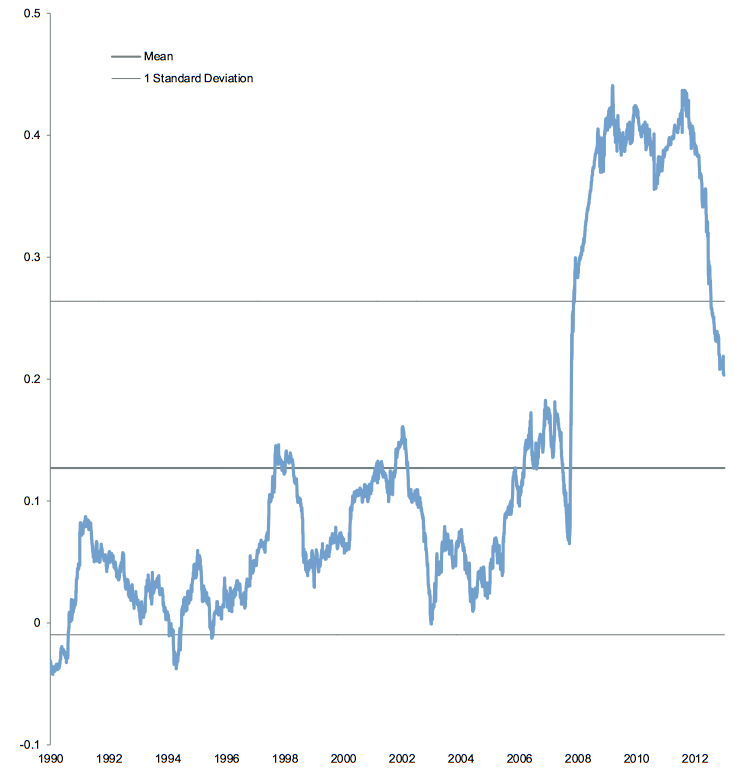
Figure 8. Rolling Average 250-Day Correlation of Commonly Traded Equity, Commodity, and FX Futures vs S&P 500
January 1, 1990 – December 31, 2013
Sources: Bloomberg L.P. and Standard & Poor’s.
Note: Exhibit references the average rolling 250-day correlation of the following front month futures contracts vs. the S&P 500 Index: Australian dollar, Canadian dollar, copper, corn, FTSE® 100, heating oil, live cattle, Nikkei 225, soybeans, wheat, and WTI crude.
The recent returns of managed futures strategies should be viewed in the context of their role as diversifiers within portfolios. While most CTAs struggled from early 2009 through late 2013, investors with large allocations to public equities experienced a windfall of strong performance throughout this period. Indeed, one could argue that many of the macroeconomic and policy-driven factors that have hurt the returns of managed futures have enhanced those of virtually any other risk asset that might be considered for a portfolio. While these factors have exacerbated the recent underperformance of managed futures, they do not undermine the diversification benefits provided by the strategy over the long term.
Looking ahead, we cannot predict whether trading conditions will improve for CTAs in the near future (through August 31, the BTOP50 has returned 2.3% calendar year-to-date in 2014 compared to 7.6% for the MSCI All Country World Index and 4.6% for Barclays Global Aggregate). However, we do know with certainty that the confluence of factors that has accompanied the underperformance of managed futures strategies in recent years is highly abormal in a historical context. We also know that prolonged periods of monetary excess have historically preceded episodes of financial turmoil, and that managed futures have generally been additive to portfolios in such instances.
Manager Evaluation
While the investment philosophy and analytical techniques employed by managed futures funds may differ from those of other hedge fund strategies, the most critical aspects of manager selection are essentially the same. Investors should seek to understand the qualifications, experience level, and track record of a manager as well as fees, liquidity terms, and any ownership or organizational issues that may impact performance. The majority of managed futures funds are categorized as systematic, meaning that quantitative analysis and computing power play a prominent role in research, portfolio construction, implementation, and risk management.
Notwithstanding the important role of technology, systematic investing should be viewed first and foremost as a human endeavor, where success hinges upon the creativity, expertise, analytical rigor, and ongoing commitment of talented and capable people. Broadly speaking, successful practitioners tend to (1) have a strong fundamental understanding of the sources of return within their strategy at a conceptual level, (2) be steeped in the scientific method, subjecting all investment ideas to rigorous and objective validation, (3) exhibit a healthy awareness of the limitations of quantitative and statistical analysis, and (4) be extremely focused on risk management.
When comparing managed futures funds, investors should be cognizant of differences in their risk level and trading speeds as well as changes in their investment strategies over time.
Assessing the risk level of a fund seems rather straightforward—one should be prepared to withstand greater volatility and larger drawdowns from funds that target higher levels of risk and return. However, portfolio-wide diversification and cost effectiveness also deserve consideration. To the extent that strategies such as trend following outperform during equity bear markets as in the past, CTAs targeting higher levels of volatility may be poised to provide greater portfolio-wide diversification per unit of capital invested despite being more “risky” when viewed on a standalone basis. Comparisons of fee structures should take differences in risk level into account. Given the ability to modify the risk level of a trading program by simply increasing or decreasing the amount of capital held against trading positions, some managers offer multiple versions of the same trading program and allow investors to “self-lever” by choosing the risk level that best suits them. In doing so, and more generally, the managed futures industry’s standard practice is to charge higher fees for higher risk/return strategies. To create a level playing field when comparing two or more funds with different risk levels and fee structures, investors should think in terms of the expected total cost (management and incentive fee) per unit of target volatility.
The trading speed of a trend following program refers to the time horizon over which trends are defined and is directly related to the average holding period for investments. Short-term trend followers that use faster trading systems purport to be more tactical and responsive to market conditions. However, while faster systems may capture some opportunities that elude slower systems, they are inherently more susceptible to trend reversals and entail higher transaction costs given that they require a larger number of round trip transactions and more frequent rebalancing. While a fund’s research, portfolio construction, and risk management processes serve to identify the optimal portfolio, managers must continually maximize the cost-benefit relationship between incremental improvements in the portfolio and the associated costs of implementation. Managers that are better at this are positioned for better performance over time, regardless of whether a strategy adheres to a short-, medium-, or long-term trading horizon.
While changes in the investment strategy over time create the obvious challenge of making it more difficult to determine the precise role of a fund within a portfolio, investors should bear in mind that ongoing investments in research and the timely retirement of ineffective models are essential for long-term success. Most innovations are pursued with one or more of four goals in mind: (1) enhancing the effectiveness of trend following systems, (2) accessing sources of return other than trend following, (3) enhancing overall portfolio construction and risk management, or (4) improving implementation. Managers that have demonstrated a philosophical commitment to trend following—dedicating most of their research effort to enhancing and refining trend following systems while improving risk management and implementation—are most likely to shine during the types of market calamities that have historically favored CTAs. Meanwhile, those less committed to trend following are typically more prone to experiment with additional sources of return in an effort to increase risk-adjusted performance. In such instances, the outcomes may vary considerably depending on which strategies are employed and how effectively they are implemented, and investors must assess the degree to which non-trend strategies are desirable both when viewed in isolation and in the context of the total portfolio.
Investors should also be cognizant of how subtle changes in the investment strategy might relate to a fund’s size and capacity. All else equal, funds with lower risk levels and slower trading systems tend to have a smaller “market footprint” due to lower notional exposure and less trading activity, and are therefore able to accommodate larger sums of capital. As with any investment strategy, investors should take note when changes in the risk level occur in conjunction with a rapid increase in AUM. In addition to the risk level, the mix of assets traded may also be partly influenced by fund size. For instance, many of the larger CTAs have gradually migrated away from agricultural and industrial commodities over time in favor of more liquid foreign exchange, fixed income, and equity futures in an effort to access a broader opportunity set and mitigate capacity constraints.
Conclusion
A bias toward trend following has allowed many CTAs to generate respectable returns throughout several market cycles. However, trend following, similar to many other investing styles, is inherently volatile and prone to occasional stretches of poor performance. To the extent that individual managers have diversified beyond trend following and employ other return drivers such as counter-trend, cash equity trading, and value strategies, investors are faced with the task of discerning the viability of newer strategies and their collective impact on the return profile of the fund while also underwriting the recovery prospects for trend following.
Notwithstanding these challenges, we believe that managed futures funds, particularly trend following strategies, remain a valuable tool for portfolio diversification. The correlation properties versus equities are compelling, and the strategy’s liquidity characteristics bolster its role as a diversifier. Furthermore, given their unique sources of return and potential to generate outsized gains during stress periods, managed futures are highly complementary to other hedge fund strategies and may be viewed as a second line of defense against extreme risk scenarios.
When considering an allocation to managed futures, investors should assess their comfort level with the potential for the strategy to be a drag on performance during strong equity rallies, but weigh this against the strong diversification potential offered during stress periods and the historically unique factors that have contributed to recent underperformance. This is closely linked to the critical task of understanding the role of each asset within a portfolio, the appropriate level of diversification that should be sought for a portfolio in light of return objectives and liquidity needs, and an understanding of the level of “true” diversification achieved through a given mix of investments. For most long-term investors, the goal should be to maximize the allocation to growth-oriented assets such as equities, while employing other holdings such as high-quality sovereign bonds to mitigate macroeconomic risks and diversifiers such as low beta hedge funds to reduce portfolio volatility.
Contributors
Gene Lohmeyer, Managing Director
Lisa Miller, Assistant Manager
Appendix

Appendix Figure 1. Historical Returns of Managed Futures, Global Equities, Global Bonds, and Hedge Funds
1990–2013
Sources: Barclay Trading Group, Barclays, Hedge Fund Research, Inc., MSCI Inc., Standard & Poor’s, and Thomson Reuters Datastream. MSCI data provided “as is” without any express or implied warranties.
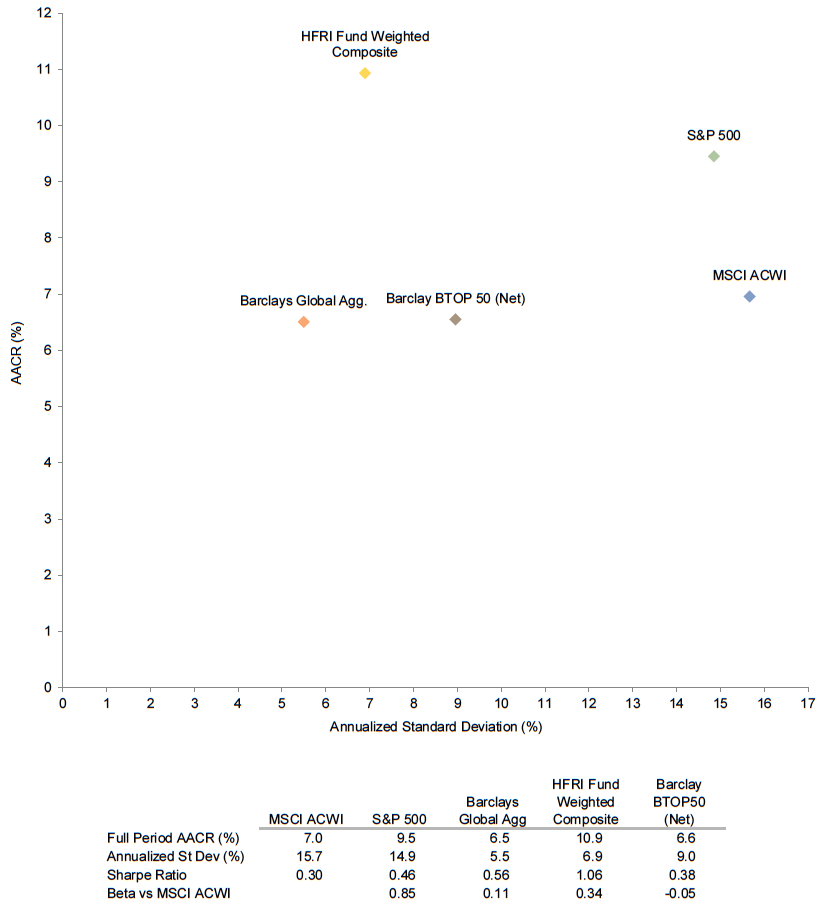
Appendix Figure 2. Risk/Return for Managed Futures, Global Equities, Global Bonds, and Hedge Funds
January 1, 1990 – December 31, 2013
Sources: Barclay Trading Group, Barclays, Hedge Fund Research, Inc., MSCI Inc., Standard & Poor’s, and Thomson Reuters Datastream. MSCI data provided “as is” without any express or implied warranties.
Note: Sharpe ratio and standard deviation based on monthly data.
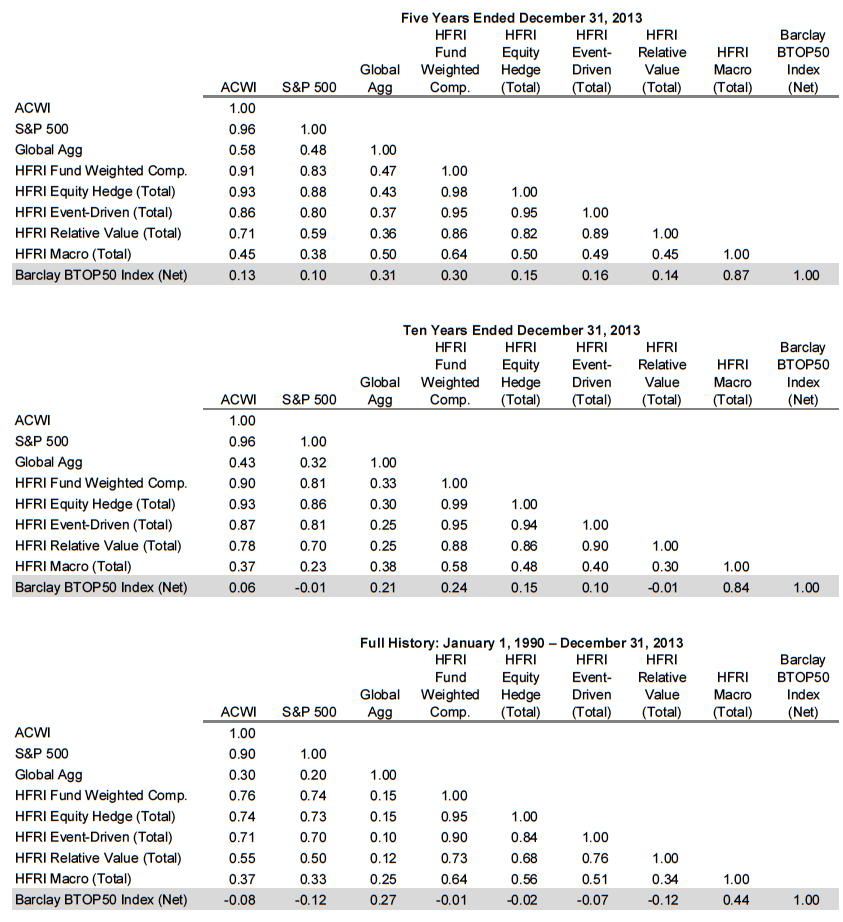
Appendix Figure 3. Historical Correlations of Managed Futures to Global Equities, Global Bonds, and Hedge Funds
As of December 31, 2013
Sources: Barclay Trading Group, Barclays, Hedge Fund Research, Inc., MSCI Inc., Standard & Poor’s, and Thomson Reuters
Datastream. MSCI data provided “as is” without any express or implied warranties.
Footnotes