This report provides a comparative overview of management fees and discretionary expenses across four hedge fund strategies in Cambridge Associates’ manager universe—long/short equity, credit opportunities, multi-strategy, and global macro—for the years 2022 through 2025. The data highlight the range, mean, and median of discretionary expenses, along with the range and median of management fees and “all-in” expense/fee metrics for each strategy.[1]“All-in” refers to the median of three-year average discretionary expenses plus management fees. These insights can assist investors in understanding typical fee structures across different hedge fund strategies.
Discretionary expenses generally include administrative fees, professional fees, legal expenses, audit fees, directors’ fees, and other expenses, and exclude investment-related expenses such as dividend, research, and interest expenses. The discretionary expense ratios (DER) are based on the fund’s total discretionary expenses divided by the fund’s average net assets in the financial statements.
Key takeaways
- Across the hedge fund industry, the DER remained broadly stable in recent years, with median levels across strategies declining modestly. This trend has taken place against a backdrop of continued investor and regulatory focus on fees and expenses.
- Credit opportunities funds continue to report the highest mean and median DER among hedge fund strategies, while global macro funds exhibit the highest “all-in” expense/fee median, consistent with trends observed in prior years.
- Fee pressure from investors has in some cases prompted managers to outsource certain functions and pass the related costs through to the fund, including items such as back-office software that were previously covered by the management company. This shifting of costs from the management company to variable fund expenses can make fee comparisons less transparent.
- The range of pass-through expenses remains broad, reflecting significant variation in fund expense policies regarding which costs are charged to the fund versus covered by the management company. In our view, appropriate expenses to charge to the fund include audit, tax, legal, administrative, and directors’ fees—essentially, items that provide a direct service to the fund. Although research costs are excluded from ratio calculations, these expenses are occasionally reported under “other expenses” in financial statements. Research costs are often viewed as more subjective pass-through items, given their potential overlap with expenses that support the manager’s broader investment platform. Passing through extensive research or travel-related expenses can significantly increase expense ratios.
- The main drivers of expense variance among funds within each strategy are differences in fund expense policies—such as the inclusion of additional pass-through items like travel, technology, and salaries—and variations in fund assets. Most expenses, including audit and administrative fees, tend to benefit from economies of scale. Accordingly, it is important to research and analyze expenses, considering both their historical economic impact and the fund’s expense policies.
Dataset
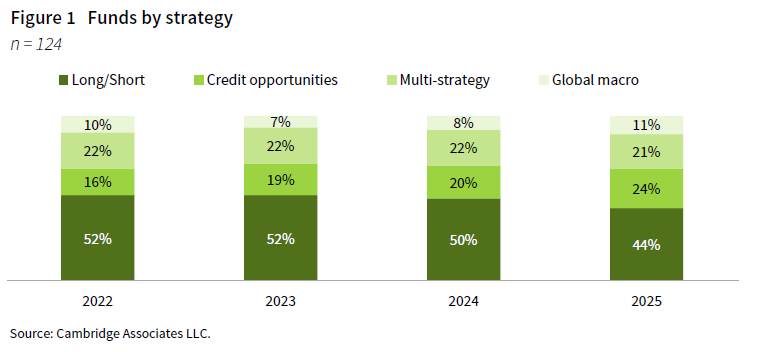
Figure 1 shows a breakdown of the funds analyzed over the past four years, categorized by strategy. The 2025 strategy composition is broadly consistent with prior years, with long/short, multi-strategy, and credit opportunities continuing to make up the majority of funds. The 2025 dataset includes audited financial statements from 124 funds managed by institutional-caliber alternative investment managers.
Summary of findings
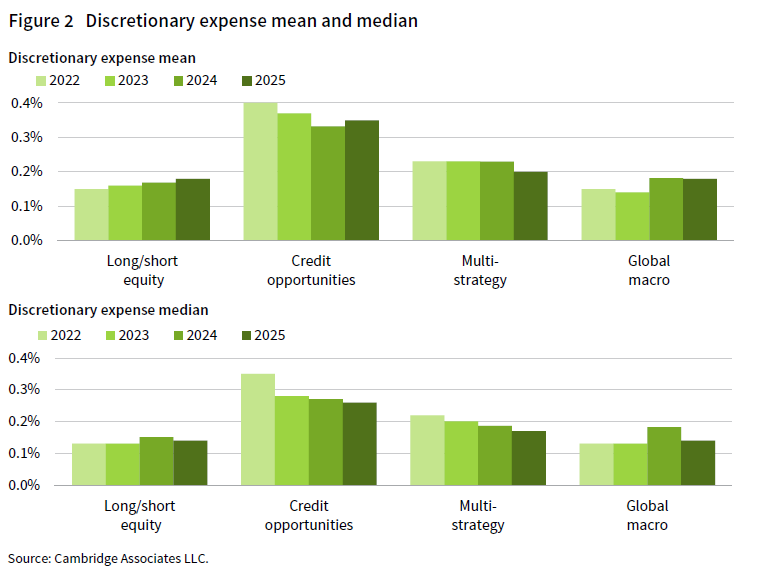
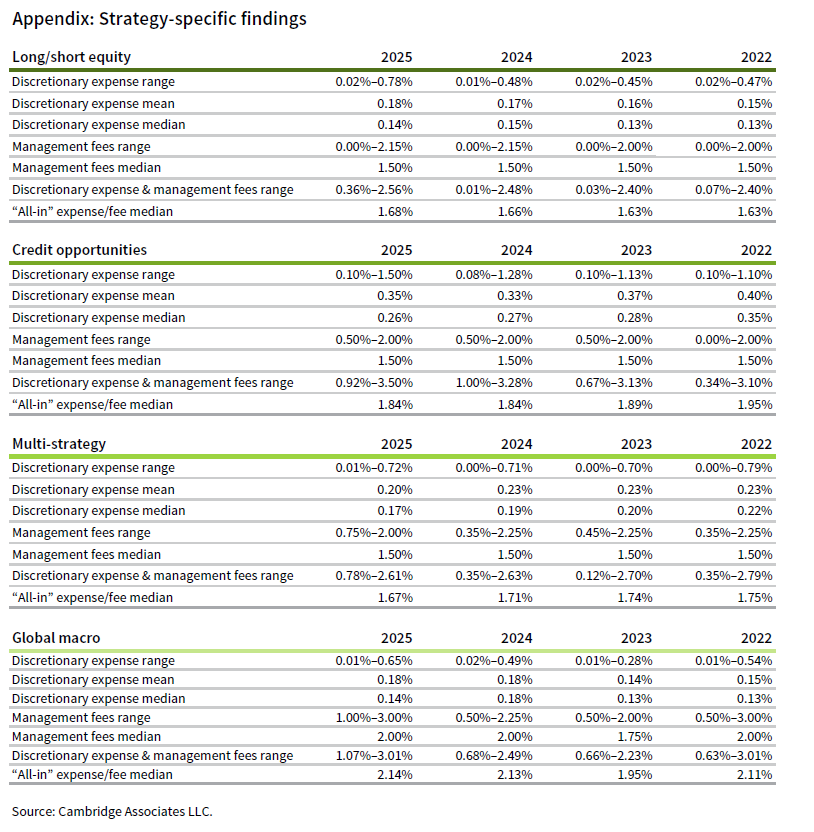
Overall, DER remained broadly stable over the 2022–25 period, with multi-strategy funds exhibiting modest declines and most other strategies showing limited year-over-year variation. Consistent with prior years, credit opportunities funds continue to report the highest mean and median DER among hedge fund strategies, reflecting the greater operational complexity inherent to their investment approach (Figure 2). Sourcing, structuring, and managing complex transactions also require frequent engagement with legal counsel and external advisors, resulting in typically higher legal and professional fees compared to other strategies.
Global macro funds continued to exhibit the highest “all-in” expense/fee median, consistent with the pattern observed in recent years (Figure 3). In 2025, the three-year average discretionary expense mean for global macro funds was 0.18%, while the median was 0.14%, closely aligned with long/short equity funds. However, the median management fee for global macro funds remained notably higher at 2.00%, resulting in a three-year average “all-in” expense/fee median of 2.14%, relatively unchanged from the prior year and remaining the highest among all strategies analyzed.
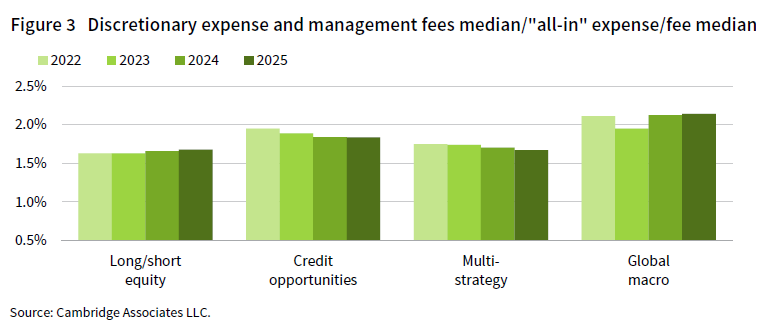
Global macro funds typically engage in active trading across global markets, often employing sophisticated macroeconomic analysis, quantitative models, and a diverse range of financial instruments. These funds typically command higher management fees, reflecting the intensive trading activity and substantial level of active management required. Consistent with this, our analysis indicates that these managers have regularly exhibited the highest management fees median[2]Management fees listed in this report are based on annual audited financial statements. Actual fees may vary depending on individual negotiations. compared to other hedge fund strategies in our dataset.
Full expense pass-through structures
In addition to traditional discretionary fees, certain multi-manager platforms employ a pass-through expenses model that extends well beyond conventional fund-level costs. While compensation-related charges remain the primary component across the multi-manager platforms reviewed in this section, the mechanisms by which these expenses are applied vary considerably. Based on our review, three broad structural approaches can be identified.
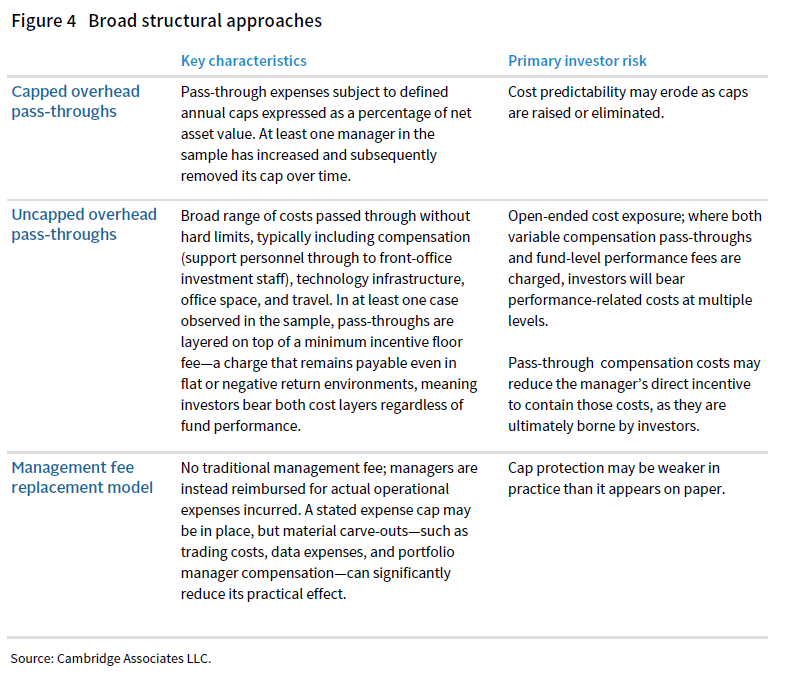
While employee compensation consistently represents the largest single component of pass-through charges across the platforms reviewed, total fee levels vary considerably—ranging from 1.25% to 12.70%, with a mean of 6.27% and a median of 5.83%.
Investor Considerations
Given the diversity of pass-through structures and the potential for significant cost variation, the following are worth examining when evaluating multi-manager platforms:
- Whether pass-through expenses are capped, whether those caps include meaningful carve-outs, and whether caps have changed or been removed over time
- Whether compensation pass-throughs include variable or performance-linked pay, and whether such charges are levied alongside a fund-level performance fee, potentially resulting in investors bearing performance-related costs at multiple levels
- Whether pass-throughs replace or layer on top of a traditional management fee, and the implications for the manager’s incentive to contain costs
- What governance and disclosure frameworks—such as defined expense approval processes, contractual caps, and itemized reporting—exist to constrain costs and give investors sufficient visibility to assess them
Footnotes