We remain cautious on UK property, but bold investors may find opportunities in the post-‘Brexit’ environment
- We expect property yields to continue to rise this year and next, as capital values moderate to reflect cooling demand. We doubt the rise will be significant, given the health of fundamentals and the compelling gap between property and gilt yields.
- Vulnerability varies by property type, quality, and location. Central London offices are most at risk, as their fortunes hinge on Whitehall’s ability to negotiate a positive framework for future relations with the European Union.
- Overall, commercial property values appear close to reflecting reasonable compensation for the level of risk; capable property fund managers could surprise with solid, single-digit total returns over the longer term.
Unsurprisingly, commercial property data released in the initial aftermath of the ‘Brexit’ vote have been weak, with one prominent benchmark indicating capital values across the United Kingdom lost ground in June, July, and August – the longest stretch of monthly declines in the last few years. With investor and occupier demand now linked to the United Kingdom’s looming divorce proceedings, property owners will face pressure to give attractive terms to would-be buyers and would-be tenants, particularly for the vulnerable central London office submarket. Like many, we expect this pressure will lead to a further moderation in capital values through 2017.
Please see Kevin Rosenbaum and Indeesh Tangeraas, ‘Is a Crisis Likely in the UK Commercial Property Sector?’, CA Answers, July 26, 2016.
Despite this view, property fund managers demanding large risk premiums could surprise with solid, single-digit total returns in the longer term. Clearly, much depends on developments in the political sphere, but with fundamentals improved relative to last cycle and with the sharp fall in the pound, we doubt large declines in capital values will be seen. Further, commercial property, as a cash-flowing hard asset, will continue to generate healthy income, particularly relative to other opportunities, to help balance near-term price weaknesses. While we reaffirm our cautious view on UK property, prices appear close to reflecting reasonable compensation for the given level of risk, particularly for the selective investor.
Shifting Sentiment
Questions mounted with the market correction immediately following the 23 June referendum on whether the United Kingdom should leave the European Union (EU). How would the country’s relationship with its biggest trading partner change? When would officials formally invoke the mechanism used to exit the union? And, what would be the impact on the British economy? But as time proceeded, the sharp downturn in sentiment that characterised the initial days post-Brexit subsided. Several major equity benchmarks have since eclipsed previous year-to-date highs and a prominent listed property index, which dropped 21.9% in the two days following the vote, is regaining lost ground (Figure 1).
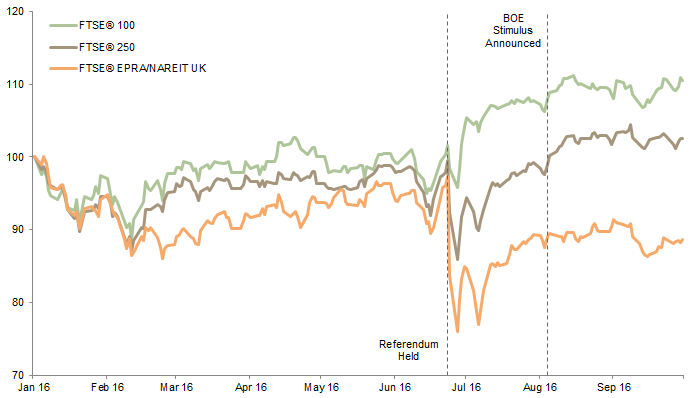
Figure 1. Equities, REITs, and the Brexit Vote
1 January 2016 – 30 September 2016 • Rebased to 100 at 1 January 2016
Sources: FTSE International Limited, National Association of Real Estate Investment Trusts, and Thomson Reuters Datastream.
Notes: Data are daily. Returns represent price changes.
Changing monetary policy expectations helped markets snap back. After widespread reports that business activity had been negatively impacted by the vote – the pace of contraction in the Markit/CIPS UK Construction Purchasing Managers’ Index’s July reading was the fastest since March 2013 – the Bank of England (BOE) announced on 4 August a comprehensive easing programme that cut its benchmark rate to the lowest level in its 322-year history. Near the same time, benefits from the pound’s drop in value began to feed into the economy (Figure 2). According to the Office of National Statistics, retail sales volumes in July and August strengthened and showed ‘little evidence of a departure from recent trends’.
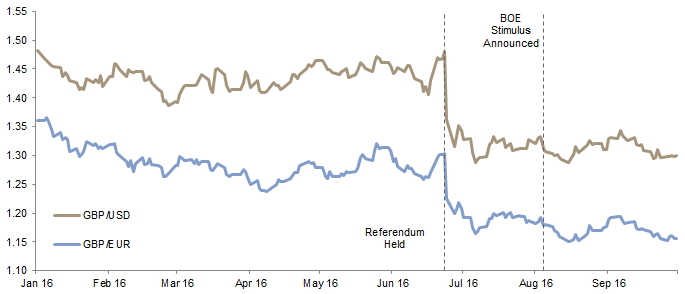
Figure 2. The British Pound and Brexit
1 January 2016 – 30 September 2016
Sources: Bank of England and Thomson Reuters Datastream.
Notes: Data are daily.
However, questions do remain about the economy’s direction. BOE Agents reported in late September that uncertainty had prompted companies’ investment and employment intentions to fall to ‘broadly flat levels’, and the idea of a more cautious environment has led many research houses, including the BOE, to moderate growth forecasts (Figure 3). But, in general, fears of a Brexit-induced recession, once pronounced among some observers, have receded. While much depends on the terms of what trade deals eventually get signed – and signings of these sorts are routinely multi-year processes – we suspect any hard Brexit scenarios that would jeopardise Britain’s economic path would be met by new incentive and easing programmes. Further, with no easy alternative to London for financial firms exposed to the Continent, the odds of a mass exodus are low.
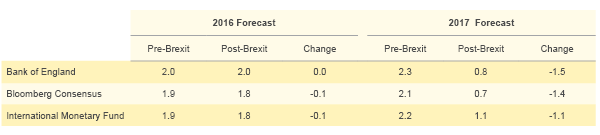
Figure 3. Brexit’s Impact on GDP Forecasts for 2016 and 2017
Percent (%)
Sources: Bank of England, Bloomberg L.P., and International Monetary Fund.
Notes: Pre-Brexit forecast from Bank of England is from May 2016; post-Brexit, August 2016. Bloomberg consensus forecasts are as of May and September, respectively. International Monetary Fund forecasts are as of April and October, respectively.
Rising Yields Ahead
We expect property yields – the ratio of net operating income to capital value – to continue to rise this year and next, as capital values moderate to reflect cooling demand. The rise will vary by type, quality, and location, with those more exposed to the Continent at greater risk, and be somewhat gradual, given the lagging nature of the illiquid asset class. However, coinciding with our general economic comments, we doubt large declines in capital values will be seen. Property fundamentals are much stronger than prior to the global financial crisis, and when considering the income generated, near-term index level total returns may be close to flat.
To date, capital values across the country have fallen by close to 4% since May, according to the unlevered IPD UK Monthly Property Index. July’s drop alone marked the largest monthly decline outside the tumultuous 2007–09 period in the index’s history (Figure 4). While it’s difficult to know how representative the price changes are of the sector, given that the index represents a subset of the universe and relies on imperfect data, the reading mirrors other measures. Several investors have already made the difficult decision to write down the value of their holdings, with Norway’s sovereign wealth fund deciding to cut the book value of its British property assets by 5%.
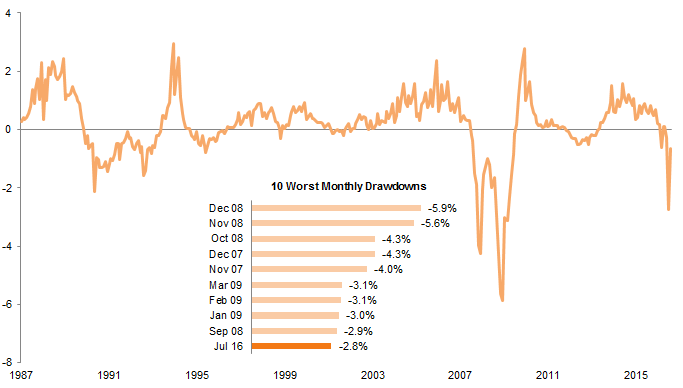
Figure 4. Monthly Change in UK Commercial Property Prices
31 January 1987 – 31 August 2016 • Percent (%)
Sources: MSCI. MSCI data provided “as is” without any express or implied warranties.
Note: The data represents the monthly change in capital values of the IPD UK Monthly Property Index.
Even prior to the ‘leave’ vote, many were concerned about elevated capital values. Since 2010, vacancy rates have halved from near 14% to less than 7%, according to MSCI Real Estate data. The improvement in occupier demand occurred alongside improvements in investor demand – by the end of 2015, investors held 55% of UK commercial property, up from 48% at the end of 2006, according to the International Property Forum. Over the same ten-year period, foreign investors’ share of investor-owned properties grew from 17% to 28%. These factors helped drive yields to a level similar to the lows reached prior to the global financial crisis and well below the long-term median of 7.9%.
However, prices appear relatively reasonable, a fact that will help limit how far yields will rise. The spread between property and ten-year gilt yields is historically compelling (Figure 5), and with healthy appetites for yield, investors will not easily overlook that gap, particularly those foreign currency investors attracted also by the pound’s weakness. Consider too that fundamentals have improved dramatically in recent years. In addition to the low vacancy rates, underwriting standards have improved, lowering the sector’s reliance on debt (Figure 6). New commercial property construction has also been marginal at best this cycle – by one estimate the volume of floor space is only 0.9% higher than in 2006 – and the construction pipeline is set to tighten, with Savills survey data revealing ‘a sharp and accelerated contraction in activity’.
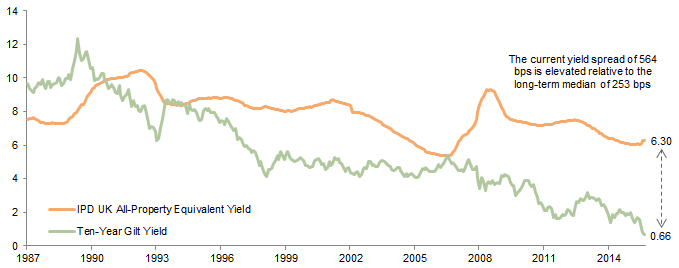
Figure 5. IPD UK All-Property Equivalent Yield and Ten-Year UK Gilt Yield
31 December 1987 – 31 August 2016 • Percent (%)
Sources: Bank of England, MSCI, and Thomson Reuters Datastream. MSCI data provided “as is” without any express or implied warranties.
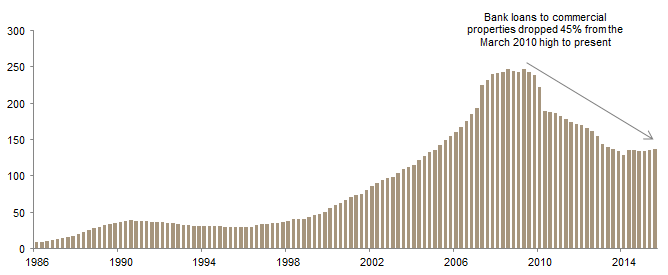
Figure 6. Outstanding Bank Loans to UK Commercial Property
Fourth Quarter 1986 – Second Quarter 2016 • British Pound (billions)
Source: Bank of England.
Note: Data are quarterly.
Still, we anticipate businesses, particularly those most dependent on the EU, and investors will remain cautious as they watch the exit negotiations unfold. This cautiousness will result in a higher share of short-term lease arrangements to provide for flexibility, and will eventually hit rents. A leading real estate advisor, Colliers International, expects this year’s rental growth for all properties to flatten to 1.2%, down from its pre-Brexit forecast of 3.8%. Although political assumptions remain central to any research house’s forecasts, the low likelihood of real clarity on the United Kingdom’s path this year and next supports the idea the capital values are likely to further moderate.
Central London Offices Vulnerable
The referendum undoubtedly left many commercial property owners uneasy about future prospects, but perhaps none more so than the owners of central London offices. Highly dependent on the nearly three-quarters of a million financial and professional services jobs, many of which provide vital functions to EU customers, London offices’ fortunes hinge on Whitehall’s ability to negotiate a positive framework for future relations. But EU leaders are already drawing lines in the sand, suggesting some functions, such as clearing operations, should not be permitted outside the union.
The uncertainty led City offices to be among the worst performers across property types and regions, selling off 5.0% since May, according to MSCI Real Estate data. While Midtown and West End offices held up better, dropping just 4.3%, they still lost more than any other three-month period since the depths of the last crisis. Part of the problem in the central London office submarket is that investors have readily accepted lower and lower yields this cycle, in part because of the dearth of cheap opportunities, driving capital values to rich levels. Over the last five years, the average capital value per square metre has almost quadrupled for City offices, outstripping the rise among all properties by a wide margin (Figure 7).
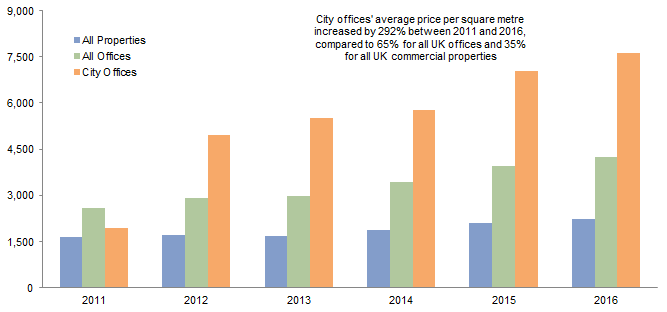
Figure 7. Growth in Capital Value per Square Metre
2011-16 • British Pound
Sources: MSCI. MSCI data provided “as is” without any express or implied warranties.
Notes: Data represent the average monthly capital value per square metre per year. For 2016, the average represents data from January through August.
The steep rise in City office prices coincided with an influx of foreign capital. According to International Property Forum data, overseas investors dominate the submarket, owning 61% of investment properties at the end of 2015 (Figure 8). Near the market’s height last cycle, overseas investors owned a significantly smaller share, just 41%. Despite the positive long-term trend, foreign inquiries into London commercial properties collapsed in the second quarter, according to survey data. A pound that stays weak will help motivate some going forward, but anecdotal evidence indicates a handful of deals have been spoiled by a wide gap in pricing between buyers and sellers. Even if any drop in foreign interest proves fleeting, it almost certainly will impact pricing.
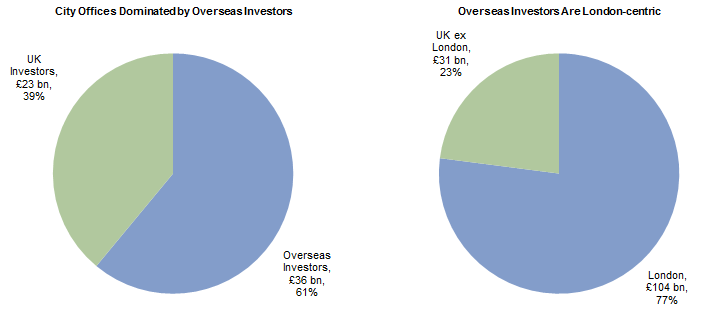
Figure 8. Overseas Investors and UK Commercial Investment Properties
As at 31 December 2015
Source: International Property Forum, ‘The Size and Structure of the UK Property Market: End-2015 Update’, July 2016.
Like investment demand, we expect occupier demand for central London offices to be sluggish. Not all news has been bad – Wells Fargo’s £300 million acquisition of a new UK headquarters was a sign of confidence – but with a host of banks musing about contingency plans in the press and mixed signs from Prime Minister Theresa May’s government about negotiation priorities, rents are unlikely to avoid losing ground. Until the uncertainty lifts, which is highly unlikely any time soon, commercial property owners will likely be compelled to offer attractive terms.
Gauging Political Risk
Please see the third quarter 2016 edition of VantagePoint (a quarterly publication from Cambridge Associates’ Chief Investment Strategist).
In recent publications, we have emphasised that when looking across the total portfolio investors today would benefit from being slightly more defensive than neutral, maintaining high-quality diversification, and ensuring liquidity needs are met. Faced with likely further near-term declines in commercial property prices, investors should carefully evaluate whether their property exposures are appropriate. For many investors – particularly those holding quality assets with long-term leases in place – we expect the most prudent move is to cautiously stay the course, waiting for more clarity on the leave vote’s impact.
Yet, bold investors may find opportunities in the post-Brexit environment. This bet is not without risk, but the backup in prices in recent months likely reflects not just downward revisions to growth forecasts but also the pricing in of elevated political risk. Given our view on the health of fundamentals and the attractiveness of property yields relative to gilts, in addition to our belief that downside risk is likely capped, prices appear close to incorporating reasonable compensation for the given level of risk. This is particularly true for the selective investor that demands large risk premiums and carefully evaluates exposures to the Continent.
That this hinges on the long-term impact of the leave vote is clear. And we are concerned about the little clarity from PM May’s government regarding how it intends to balance access to the single market with control of European immigration. But consider that even after the formal mechanism for leaving the EU is triggered, which appears set to occur next year, the United Kingdom would have a two-year period to work out the terms of the exit. During these years, when fundamentals and income are much more likely to drive performance than sentiment, Britain retains all rights and privileges associated with membership. Even if London firms move activities elsewhere, Moody’s has argued the process would take several years and the annual impact may be benign.
We agree. It’s foolish to believe Britain, and more specifically London, will lose its place as a leading destination for international capital. It is among the most transparent and mature markets globally, and has entrenched itself as one of the largest exporters of financial services, a fact that will not be wrested away easily. Given the apprehension in the market and an equivalent yield north of 6%, which stands in sharp contrast to a host of opportunities in the rock-bottom rate environment, capable property fund managers could surprise with solid, single-digit total returns in the longer term.
Index Disclosures
Broad-based securities indices are unmanaged and are not subject to fees and expenses typically associated with managed accounts or investment funds. Investments cannot be made directly in an index. Past performance is no guarantee of future results.
FTSE 100® Index
The FTSE 100® Index is a capitalisation-weighted index of the 100 most highly capitalised companies traded on the London Stock Exchange. The equities use an investability weighting in the index calculation.
FTSE 250® Index
The FTSE 250® is a market capitalisation–weighted index consisting of the 101st to the 350th largest companies listed on the London Stock Exchange. The equities use an investability weighting in the index calculation.
FTSE EPRA/NAREIT UK Index
The FTSE EPRA/NAREIT UK Index is a subset of the FTSE EPRA/NAREIT Developed Index and is designed to track the performance of real estate companies and REITs listed on the London Stock Exchange. It is free-float adjusted and screened for liquidity, size, and revenue considerations.
IPD UK Monthly Property Index
MSCI’s IPD UK Monthly Property Index measures unlevered total returns of directly held standing property investments from one valuation to the next. The index tracks performance of 3,307 property investments, with a total capital value of £46.4 billion as at August 2016.
Kevin Rosenbaum, Investment Director
Daniel Day, Investment Associate