News of the recent surge in corporate activity has made headlines, from new peaks in mergers & acquisitions to large quantities of share buybacks and records in spin-offs. Yet, event-driven strategies—funds that invest in catalyst-driven[1]Such as arbitrage (merger arbitrage, share-class arbitrage, capital-structure arbitrage, etc.); distressed credit (bankruptcy, liquidations, nonperforming debt, etc.); and event equities/special … Continue reading situations across the capital structure—have struggled since mid-2014, frustrating many investors that expected such an environment to provide ripe opportunities. In this brief, we review some meaningful headwinds that have plagued the space over the last 18 months and assess the likelihood that they will continue.
A Favorable Backdrop Didn’t Favor Returns
Following 2014, when merger & acquisition (M&A) activity posted its largest deal value since the 2007 peak, 2015 saw a record-shattering $5.04 trillion worth of global M&A,[2]According to data provided by Dealogic. which easily surpassed the $4.61 trillion in 2007. M&A activity was robust around the world in 2015; while the United States represented roughly half of announced activity, its peak to date, the Asia Pacific region also exceeded $1.0 trillion for the first time in history. A key factor in the surging activity was the record number of mega-deals—mergers of $10 billion or more—which totaled 69 and represented $1.9 trillion in value. Deals of this size allow even those managers with the largest asset bases to invest: the deals are typically liquid due to the large market capitalizations, and have more attractive spreads given their increased complexity and tendency to cross borders. Non-M&A corporate activity also spiked: companies executed massive share buybacks, activism continued to surge, and spin-offs reached record numbers.
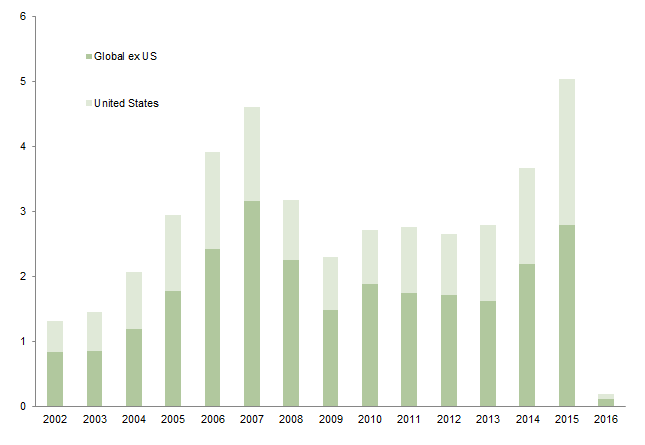
Announced Global Merger & Acquisition Activity
2002–16 (Jan 31) • Deal Value (US$ trillions)
Source: Dealogic.
See the third quarter 2014 edition of our quarterly “Hedge Fund Update” publication for more on these deals.
Yet, as noted, event-driven managers were largely unable to capitalize on this environment. After a decent start to 2014, returns were weak in July and August, and losses began to mount going into fourth quarter 2014 due principally to three clearly identifiable situations: (1) an adverse court ruling that drove down the value of preferred securities in Fannie Mae and Freddie Mac, which many managers had held in size; (2) the breaking of a widely held merger deal (AbbVie/Shire); and (3) the nose dive in energy. Despite a more modest but still positive first half of 2015, headwinds to the strategy returned in force in the second half. The Hedge Fund Research Event Driven (Total) Index returned an estimated -6.8% from July 2014 through December 2015, compared to the S&P 500 Index, which returned 7.6%. While the events in 2014 were definable and somewhat more contained, the headwinds in 2015 were broad based.
Headwinds in 2015 Were Broad Based and Substantial
Compared with the S&P 500 Index’s gain of 1.4%, the HFRI Event Driven (Total) Index’s preliminary return of -3.7% for the year seems even more disappointing. The S&P 500’s gains were driven by just a handful of mainly growth-oriented, momentum-driven stocks unlikely to be held in any meaningful size, if at all, in most value-biased, event-driven portfolios. In fact, value investing, a key component of event-driven investing, has been heavily out of favor relative to growth and momentum stocks. Growth stocks across all market capitalizations, as represented by the Russell 3000® Growth Index, outperformed their counterparts in the Russell 3000® Value Index by more than 900 bps in 2015 and more than 1,000 bps over the past two years. Adding insult to injury, the S&P 500’s already skewed performance cost many managers in a less obvious way—hedging. The index serves as one of the most common, liquid, low-cost tools for managers looking to implement broader portfolio-level hedges, often by using put spreads or outright puts, or shorting the exchange-traded fund directly. These positions turned out to be not only ineffective, but costly for the year.
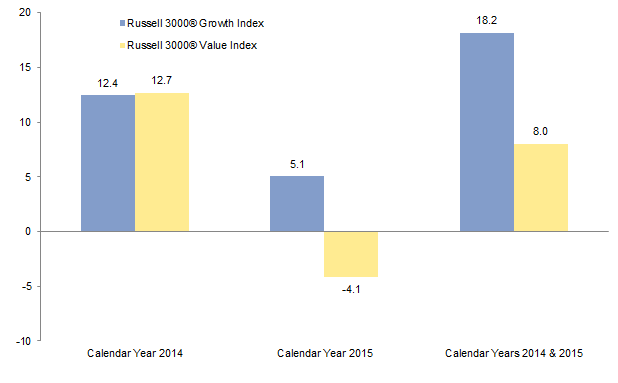
Outperformance of US Growth vs Value
Percent (%)
Sources: Frank Russell Company and Thomson Reuters Datastream.
Beyond these factors, many of the specific strategies event-driven funds employ faced challenging headwinds in 2015.
Merger Arbitrage. Broadly speaking, merger arbitrage was an unattractive strategy on a risk-reward basis for years following the financial crisis; deal activity was limited, and those deals that occurred often carried narrow spreads. The lack of returns forced investors to reduce capital or abandon the strategy altogether in search of higher rates of return elsewhere. Compounding this capital flight was the fact that investment banks, once-common participants in merger arbitrage, were forced out by increased regulation. However, in early 2014, the continually accommodative credit markets began to spur an increase in the number and size of mergers. The combination of increasing supply and limited demand forced merger spreads to widen in 2014, eventually reaching more attractive levels. As a result, the few deals with reasonable yields in late 2014 and early 2015 attracted large numbers of hedge funds, which tend to search for similar merger characteristics (e.g., attractive spread, probability of successfully closing, timing, liquidity, and ability to hedge).
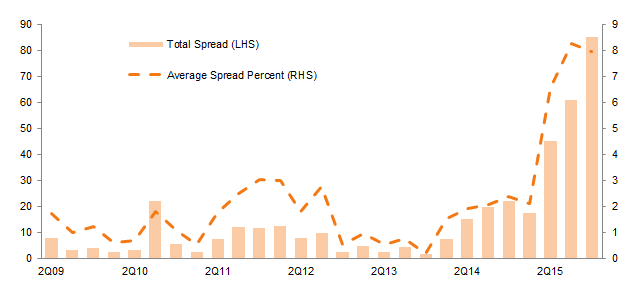
Historical Merger Arbitrage Spreads
Second Quarter 2009 – Fourth Quarter 2015 • US$ billions
Sources: Bloomberg L.P. and Jefferies LLC.
Note: Chart shows spreads for global merger & acquisition deals above $1 billion.
One of these was Applied Materials/Tokyo Electron, which broke in the spring of 2015 from regulatory issues and was one of the most costly deal breaks in recent years—the other being AbbVie/Shire. Subsequently, many managers reduced exposure to merger arbitrage or fled to higher-quality, lower-return deals. Jittery investors quick to sell after multiple capital impairments in the previous months, combined with the tidal wave of deal activity in the second half of 2015 and increased volatility across global equity markets, led merger spreads to widen significantly. Managers holding many of these spreads were consequently penalized in the second half of the year, even if only on a mark-to-market basis. Currently, many large, liquid deals are trading in the mid- to upper teens on gross spreads (not annualized, which could be higher depending on the closing date). Such levels have not been seen in decades and suggest the market is ascribing a greater likelihood to these deals’ failure due to regulatory risk, financing risk, or the possibility of one participating company walking away amid the current market volatility.
And in fact other large deals have been challenged or have failed, including Mylan/Teva, Office Depot/Staples Perrigo/Mylan, and Time Warner/Comcast. The reasons for the failures vary, but regardless, managers that invested in these deals have experienced meaningful losses—in some cases, enough to more than erase gains from multiple successfully closed deals. This has been particularly evident among managers that have either used leverage—something we generally eschew in the event-driven space—or maintained highly (perhaps overly) concentrated positions.
The regulatory environment is among the factors contributing to the dramatic repricing of merger-associated risk. Ask any arbitrageur about it and expect to receive a fairly uniform response: some colorful language not fit for printing. Dechert LLP, a law firm focused on complex corporate transactions, recently issued a report[3]The Dechert Antitrust Merger Investigation Timing Tracker—nicknamed, ironically, DAMITT. showing that the number of significant merger investigations, complaints seeking to block a merger, and complaints resolved by consent orders were all at record levels. Mergers that attract elevated regulator interest take longer to complete or may be blocked—in the case of Applied Materials’ attempted acquisition of Tokyo Electron, the deal was blocked 15 months after announcement. Such a time lag lowers a trade’s internal rate of return (IRR) while increasing the volatility significantly.
Finally, traditional merger arbitrage—owning shares of the targeted company while shorting shares of the acquirer—has not been effective in many recent deals. The acquirer’s shares typically trade downward on the news of a deal, but in numerous recent instances, the acquirer’s stock has traded upward following the announcements. Although this trend has been fading more recently, such unusual behavior is contributing to repricing of risk.
Event Equities. Event equities—a broad category that managers may use to classify a variety of exposures—did not provide much relief for those seeking equity exposure outside of the merger space. These types of positions often have softer catalysts associated with them, meaning that there is no hard date set for the completion of a transaction at a certain price. As a result, these positions have a significant value component to them and depend on the market to recognize that the assets are undervalued and purchase them. Given that value investing has performed poorly relative to growth, this has compounded problems for managers, with some commonly held event equity stocks down 20% to 70% for 2015.
Distressed. The turmoil and freezing of credit markets in 2008 and 2009 was followed by a robust opportunity set for distressed credit investing. As these opportunities began to work themselves out in subsequent years, an exceedingly accommodative high-yield credit market caused bankruptcies to plummet and the default rate to remain benign. This resulted in an increasingly unattractive distressed landscape in recent years, particularly in the United States. Managers that remained in the space watched their opportunity set deteriorate. They were generally left with a handful of options: reach for riskier positions to meet their return hurdles; avoid the lower-quality, higher-risk situations and therefore accept lower returns; or increase allocations to merger arbitrage and event equities.
Those that maintained exposure to distressed credit more than likely faced some headwinds over the last 18 months. As the price of oil began to plunge in the summer of 2014, high-yield credit spreads began widening—particularly among energy companies, the most dominant issuer of high-yield credits in recent years—and this trend then began to ripple throughout the distressed space. Even some positions thought to be among the safest, such as the Lehman Brothers structure (where much of the remaining liquidation is cash awaiting distribution), traded downward in the fourth quarter of 2015 as the pain spread and non-economic sellers were forced to unload their most liquid credits to meet redemption requests. The Market Vectors® Altman North American Distressed Bond Index lost more than 50% from its peak in June 2014 to the end of 2015, and losses have continued into 2016.
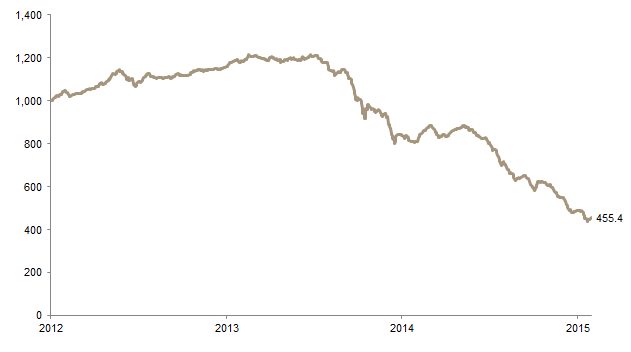
Market Vectors® Altman North America Distressed Bond Index Total Return
December 31, 2012 – January 31, 2016
Sources: Bloomberg L.P. and Market Vectors®.
Energy. The commodity space continues to be extremely challenging, particularly with respect to oil & gas and, to a somewhat lesser extent, metals & mining. Generally speaking, exposure to energy-related names has been smaller and therefore less impactful than some other types, such as health care and technology; however, any energy exposure whatsoever was particularly painful in 2015. Those that held positions in late 2014 suffered material markdowns as oil began its initial sell-off, and they generally exited the sector. Likewise, any managers that looked to take advantage of what they thought were meaningful discounts in 2015 were similarly, if not more severely, punished as the rout in oil became widespread. The violence in price action has been astonishing; in some cases, high-yield credits issued in the first half of 2015 traded downward by more than 50% in a few months. As a result, funds with even modest exposure (e.g., less than 10% net) may have easily suffered losses in the mid–single digits.
Crowding. Crowding––having many similar investors with similar theses in the same position—is nothing new in the world of hedge funds, but the risk of it appears to be increasing in the event space. If event-driven managers’ research indicates that an event combines a high enough probability of success with an attractive enough spread, then they will be more likely to initiate a position and hold it through the transaction. This makes most event-driven managers renters of securities rather than owners—they buy the position in advance of a transaction and then sell it as the date nears or arrives. When only a handful of opportunities meet their criteria, the likelihood sharply increases that many event managers will enter the same positions with the same theses. When catalyst events occur as expected and managers move on to the next trade, investors hardly notice the crowding. However, when deals collapse or value-based positions do not perform as expected, many investors with the same thesis may head for the exits simultaneously, as they are less focused on the company’s longer-term story. This can exacerbate the volatility greatly in the near term, but it can also create an opportunity for other managers to buy the stock from the forced sellers.
Even as some capital is redeemed from the strategy, the risks of crowding and increased volatility remain. More recently, given the continued widening of gross deal spreads, sell-side desks have been pushing increased allocations to nontraditional players, such as long/short and long-only equity managers. This represents a risk worth watching. If inexperienced arbitrageurs pump large amounts of capital into the space, spreads could narrow and volatility could increase should deals collapse or other unexpected events take place. However, in light of the volatility occurring across global markets at the start of 2016, managers may be less likely to consider drifting into a complex strategy not among their core competencies.
The Few (Relative) Bright Spots for Performance
While many funds in the event-driven space have struggled, not all have suffered equally. Broadly speaking, two areas within the strategy that have avoided much of the pain are (1) lower-beta event-driven funds, which tended to have tightly hedged portfolios and/or hold lower-risk deals and top-of-the-capital-structure credits; and (2) funds that focus on value-as-catalyst and tend to apply more of an equity long/short model. Funds in the second category largely focus on those sectors or industries that are fundamentally likely to experience merger activity, and hold their positions through the completion of the corresponding transactions, rather than owning securities for the spread.
Many managers of these two types escaped 2014 with either limited losses or modestly positive performance and flat to modestly down performance in 2015, outperforming those with a harder-event or deeper-value focus. Additionally, managers willing or able to create their own catalysts outperformed in many cases.
What to Watch For
Organizational pressure is the biggest current risk for many managers. Those likely to be at the greatest disadvantage are firms with weak or vulnerable capital bases—such as those that have asset/liability mismatches, those that have raised assets from lower-quality investors that are quick to redeem, or even those with a large number of investors experiencing capital pressures themselves. Likewise, funds that have posted two consecutive years of negative returns face the risk of staff departures, whether voluntarily or involuntarily.[4]This judgment is based on a handful of conversations with headhunters specializing in placing hedge fund analysts; they report a marked increase in inquiries from those in the event-driven space. Turnover typically occurs as managers receive redemptions and proactively decide to right-size their business to better reflect a smaller asset base, or when analysts feel inadequately compensated by funds that have not earned the all-important incentive fee. Until funds have regained their high-water marks, organizational pressures are likely to remain elevated.
The increased market volatility at the start of 2016 may have shaken investors, but it may also serve as a changing of the guard in terms of the investing environment; as of early February our conversations with fund managers show that many in the event-driven space have captured only 10% to 50% of the market’s sharp drawdown. Likewise, the current opportunity set appears as attractive as at any other point since the financial crisis; the supply of opportunities has overwhelmed the demand as banks have been regulated out of the investor pool and most of the weaker players have already fled the space, thus increasing potential IRRs. Managers have begun to express some optimism—a rare commodity in the event-driven world over the last 18 months—about the longer-term opportunity set. Many experienced managers have viewed the disruption in credit markets as a sign that markets are entering a new credit cycle, typically a period when these managers perform their best, taking advantage of those less equipped to deal with such complex situations. Managers that have well-constructed businesses—those supported by properly incentivized teams and stable capital bases that allow them to play offense while others are playing defense—will be the best suited to pursue the next wave of opportunities. While this does not mean that it will be clear sailing for managers or the strategy more broadly, it does signal that the headwinds recently plaguing the strategy could become less forceful in the months ahead.
The Bottom Line
This challenging 18-month stretch for event-driven strategies has generally wiped out gains from the previous two to four years or, in some cases, longer. Many losses—particularly those in 2014 and early 2015—are permanent impairments. However, some late-2015 losses appear to have resulted from negative marks to market, and many of the events in question may still reach completion, and therefore value realization, in the coming months. Investors in the space that are tempted to exit should carefully consider their reasons for doing so. Barring heightened concerns about a particular organization’s stability, transferring an existing allocation to a similar manager performing modestly better is a less attractive proposition given the financial implications of taking on a new high-water mark.
Industries and companies alike will continue to evolve, grow, and eventually decline. As a result, companies will continue to merge and acquire one another, spin off noncore businesses, and undergo other complex transactions that create uncertainty—and companies will most certainly continue to declare bankruptcy. These events will create new price dislocations as uneconomic sellers overreact, providing fresh opportunities for talented managers specializing in such trades. Event-driven strategies, though challenged, should still have some life left.
Brett Snidtker, Investment Director
Joseph Comras, Investment Associate
Footnotes