Executive Summary
- Cambridge Associates and the Global Impact Investing Network have collaborated to launch the Impact Investing Benchmark, the first comprehensive analysis of the financial performance of market rate private equity and venture capital impact investing funds. While the impact investing industry is in an early stage of development, it is poised for growth. One of the chief barriers to industry advancement remains a paucity of robust research on financial performance. Credible data on risk and return can help both existing and future impact investors better identify strategies that best suit their desired social, environmental, and financial criteria.
- At launch, the Impact Investing Benchmark comprises 51 private investment (PI) funds. Impact investments are investments made into companies, organizations, and funds with the intention to generate social and environmental impact alongside a financial return. Funds in the benchmark pursue a range of social impact objectives, operate across geographies and sectors, and were launched in vintage years 1998 to 2010.
- Despite a perception among some investors that impact investing necessitates a concessionary return, the Impact Investing Benchmark has exhibited strong performance in several of the vintage years studied as of June 30, 2014. In aggregate, impact investment funds launched between 1998 and 2004—those that are largely realized—have outperformed funds in a comparative universe of conventional PI funds. Over the full period analyzed, the benchmark has returned 6.9% to investors versus 8.1% for the comparative universe, but much of the performance in more recent years remains unrealized.
- Impact investment funds that raised under $100 million returned a net IRR of 9.5% to investors. These funds handily outperformed similar-sized funds in the comparative universe (4.5%), impact investment funds over $100 million (6.2%), and funds over $100 million in the comparative universe (8.3%). Emerging markets impact investment funds have returned 9.1% to investors versus 4.8% for developed markets impact investment funds. Those focused on Africa have performed particularly well, returning 9.7%.
- In all private investing, manager selection and due diligence are critical steps in the investment process and are important factors in obtaining superior returns and in risk management; impact investing funds are no exception. There are funds within the Impact Investing Benchmark that have performed in line with top quartile funds in the comparative universe, showing that market rates of return for impact investments are possible and also reinforcing that manager skill is paramount.
- Creating and analyzing benchmarks for private investments, especially for a younger, emerging portion of the market such as impact investing, poses a number of challenges. Difficulty acquiring private fund performance data and strict inclusion criteria limited our ability to amass a large dataset, which presented data analysis limitations that are unavoidable at this stage. Cambridge Associates will produce an ongoing quarterly Impact Investing Benchmark report to track the industry over time.
This report was produced by Cambridge Associates, a global investment firm and one of the world’s leading developers of financial performance benchmarks, in partnership with the Global Impact Investing Network, an organization dedicated to increasing the scale and effectiveness of impact investing worldwide. It presents findings from the first comprehensive analysis of financial performance in impact investing. To maintain a manageable scope, this report specifically evaluates the performance of market rate private investment funds in the impact investing space. This report also marks the launch of the first ever financial performance benchmark of private impact investing funds, which Cambridge Associates will maintain and update on a quarterly basis going forward.
The decision to focus this report on PI funds was motivated by several factors. Investing via funds is a common strategy for impact investors of all types and sizes, including development finance institutions, foundations, commercial banks, pension funds, insurance companies, and family offices. Nearly 75% of investors that responded to the J.P. Morgan and GIIN global impact investor survey, Eyes on the Horizon: The Impact Investor Survey, published in May 2015, indicated that they invest via intermediaries (regardless of whether they also invest directly in companies). Additionally, within fund investments, private equity and venture capital are particularly common vehicles. Out of 310 impact investing funds profiled in the ImpactBase Snapshot, published in April 2015, 153 are private equity or venture capital vehicles. Cambridge Associates’ Mission-Related Investing (MRI) database is further evidence of private equity’s prevalence in impact investing: of the 579 private MRI funds Cambridge Associates’ tracks, 392 are private equity or venture capital funds (the remainder are private real assets funds).
For the sake of brevity, the phrases “private investments” and “Impact Investing Benchmark” are used throughout this report. However, as explained in detail in the Methodology section, the benchmark only includes data from private equity and venture capital funds that target risk-adjusted market rate returns and social impact objectives. Accordingly, the benchmark does not include private debt funds, funds targeting environmental impact objectives, or funds seeking below market returns, all of which are also prevalent strategies in the impact investing landscape. Our use of these simplifying phrases, therefore, is not to imply that impact investing is restricted only to private equity and venture capital; rather it is to enable simple narrative flow.
Methodology
Fund selection
Impact investments are defined by their intent to generate a social and/or environmental return in addition to a financial return. The focus of this report is PI funds[1]Private investment funds include unlisted, fixed term limited partnerships that invest equity and subordinated debt into private companies. The three sub-asset classes in focus for this report are … Continue reading with a social impact objective to allow for a clear aggregation of similarly motivated funds. Future research may look at other vehicles and/or funds with an environmental impact objective.
The research team identified a list of relevant impact investing funds through existing databases maintained by various credible networks worldwide, including the GIIN’s ImpactBase, CA’s Mission-Related Investing (MRI) database, the Community Development Venture Capital Alliance (CDVCA), the European Venture Philanthropy Association (EVPA), ImpactAssets 50, and Opportunity Finance Network (OFN).[2]Further information regarding the impact screening processes of these organizations can be found in the Appendix. This process enabled the research team to identify those funds likely to have the intention to create positive social impact, as indicated by their membership in these impact-oriented networks. The fund list was further refined based on the inclusion criteria in Table 1. If the impact intent of a fund was unclear, the research team conducted additional detailed review to determine whether the fund could be included.[3]Note that while this study screened for impact intention of funds, it does not include data on impact achieved.
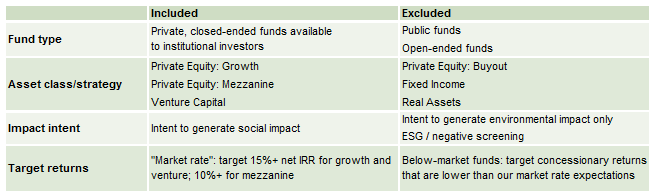
Table 1. Inclusion Criteria
A unique feature of impact investments is that not all investment opportunities aim for market rates of risk-adjusted return. While the pursuit of a financial return is central to impact investing, some investors—by virtue of their strategy—seek to achieve concessionary returns. Again, in the interest of focusing on a relatively uniform set of data, this research restricts itself to those funds that target risk-adjusted market-rate returns. Specifically, this means private equity and venture capital funds with a target net internal rate of return (IRR)[4]See the “Definitions of Calculation Metrics” sidebar. of 15% or higher, and mezzanine funds with a target net IRR of 10% or higher. These cut-offs are consistent with most conventional PI funds. Fortunately, there were no “close calls” when determining the universe of funds to be included—funds were either clearly above the cut-offs or significantly below (e.g., concessionary funds).
Impact Themes
This report does not measure the social impact achieved by funds within the Impact Investing Benchmark. However, managers therein do track and report on a variety of impact metrics. Frequently used metrics from the IRIS catalogue, managed by the GIIN, include “jobs created at directly supported enterprises” and “number of clients” in a target demographic such as women or low-income populations.[5]IRIS is the catalog of generally accepted social, environmental, and financial performance metrics: www.iris.thegiin.org.
To provide some indication of the impact these funds are targeting, the various impact themes they pursue are reported below:
- Financial inclusion. The provision of financial services to populations that otherwise lack access. This includes investments in microfinance, small and medium enterprise (SME) finance, and community banking.
- Employment. Strategies that focus on job creation in areas of need, job quality improvement, and workforce development.
- Economic development. Investing in sectors that promote the improvement of economic conditions and standards of living. This includes companies contributing to basic infrastructure, such as transportation or telecommunications.
- Sustainable living. Improving access to healthy and environmentally friendly products and services. This includes organic health products and locally sourced foods.
- Agriculture. Investments along the food and agricultural value chain that are oriented towards efficient and sustainable practices and yield improvements that help feed more people at a lower cost and improve livelihoods of smallholder farmers.
- Education. Investing in innovations or business models that improve education outcomes or expand access to education.
Of the 51 funds in the Impact Investing Benchmark, 36 are focused on more than one of the above themes, while 15 pursue a single impact theme. Financial inclusion is the most commonly pursued theme, as it encompasses funds that invest exclusively in financial services companies in addition to funds that invest in SMEs across economic sectors.
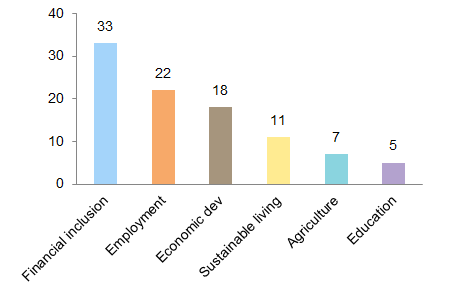
Themes Pursued by Number of Funds
Data
In all, 138 eligible funds were identified that met the set criteria. Of these, the research team was able to gather sufficient data from 68 funds. To be included in the benchmark, fund managers were required to submit both annual audited financial statements as well as quarterly or semiannual cash flow statements. Cambridge Associates then standardized data received from funds in multiple jurisdictions to prepare the data for analysis.
Several funds were able to submit part but not all of the required data, and Cambridge Associates will work with these fund managers to complete data collection for the next quarterly update of the benchmark.
Sample Characteristics
Although data was gathered from 68 funds, this report will present analysis from 51. Seventeen of the funds are of vintage year[6]A fund’s vintage year is its legal inception date, as noted in its financial statements. 2011 or later, and thus do not have a sufficient track record to enable meaningful analysis of performance; these funds will be included in future updates of the benchmark as they mature. Tables 2 and 3 present characteristics of the 51 funds as well as characteristics of a comparative universe from Cambridge Associates’ database representing PI funds of the same industries, vintage years, geographies, and asset classes that compose the Impact Investing Benchmark.[7]The comparative universe also excludes all funds present in the Impact Investing Benchmark.
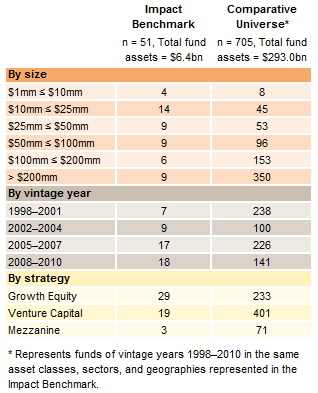
Table 2. Fund Size, Vintage Year, and Strategy As of June 30, 2014
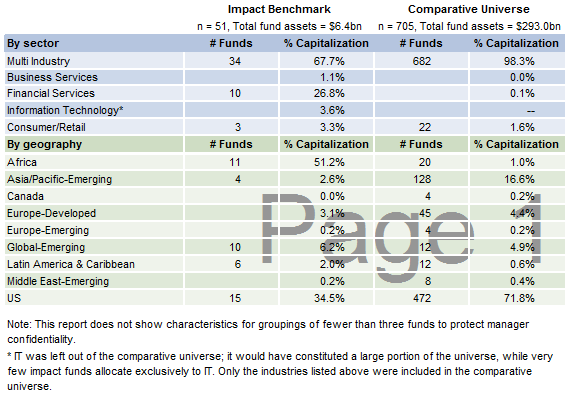
Table 3. Sector and Geographic Focus
As of June 30, 2014
Several features of funds in the Impact Investing Benchmark stand out. The funds tend to be small—27 of the 51 funds analyzed raised less than $50 million—and new—over two-thirds of the funds analyzed have a vintage year of 2005 or later. In comparison, most funds in the comparative universe are larger (71% are above $100 million) and older (nearly half were launched before 2005).
Consistent with funds in the comparative universe, most impact fund managers invest in companies across multiple economic sectors (Table 3). The main difference between the two datasets, from a sector standpoint, is the representation of financial services funds. Over one-quarter of impact fund capital is focused specifically on this sector, which reflects the historically strong appetite for microfinance funds among impact investors. Since very few impact investing funds allocate exclusively to information technology (IT) companies (3.6% of Impact Investing Benchmark capital), it should be noted that IT-focused funds are not included in the comparative universe in the interest of creating a similar dataset.[8]IT funds would constitute a significant share of capital in the comparative universe (approximately 30%).
Geographically, while only 11 funds in the impact investing sample have an exclusive focus on Africa, these constitute over 50% of the total capital being analyzed. Several large development financial institution (DFI)–backed[9]Development finance institutions are government-backed institutions that provide finance to the private sector for investments that promote development. impact investing funds operating in Africa had previously contributed their data to CA. Consequently, the capital share of impact investing funds focused on other regions is lower than that in the comparative universe.
The various sample biases described above—fund size, vintage year, and geographic focus—are addressed when relevant in the analysis that follows. Despite this sample’s inherent limitations, several important findings nonetheless emerge from this research. Over time, as the sample grows, deeper and more robust analysis will become feasible.
Challenges and Caveats
Data Compilation Challenges
Private investment benchmarking can be a challenging exercise even in established private market segments. Creating and analyzing benchmarks for a younger, emerging portion of the market such as impact investing presents an additional layer of complications. Difficulty acquiring private fund performance data and strict inclusion criteria limited our ability to amass a large dataset.
- Difficulty Acquiring Data. To be included in this study, fund managers were required to submit unaudited quarterly and audited annual financial statements since inception for each relevant fund. This information is typically readily available for limited partners (LPs), but for some smaller managers, gathering and distributing the data can be too cumbersome. Further, some fund managers were unable to share data with any third party aggregator, given LP-enforced data restrictions. This problem was more prevalent among emerging markets funds, many of which are backed by DFIs, government-backed entities that often must adhere to more complex regulations than other types of LPs.
- Strict Selection Criteria. To maintain the integrity of this benchmark from both financial and impact perspectives, Cambridge Associates and the GIIN worked collaboratively throughout the data collection phase. Inclusion criteria were refined over time to ensure that all included funds were dedicated to creating positive social impact alongside competitive financial returns.
The definition of impact investing guiding this research was simple and straightforward—investments made with the intention to generate measurable social impact alongside a financial return—but it was strictly enforced and resulted in the exclusion of a number of willing contributors. This benchmark does not include funds that some may consider to be inherently impactful based solely on their investment portfolio; rather the intent of the fund manager was a key determinant. For example, being an investor in the health care sector is not enough independently to merit classification as an impact investor; fund managers must also demonstrate intent to create positive impacts as part of their core strategy. In addition, funds that only sought to encourage environmental, social, and governance (ESG) policies within their portfolio companies were also excluded. Such policies may certainly generate societal benefits, but they alone are not enough to indicate intent to create social impact.
In the end, rigidly enforced selection criteria made this benchmark dataset—and the acceptable universe of funds—markedly smaller. The initial outreach list comprised over 350 funds; 138 of these funds met the inclusion criteria, and 68 were willing and able to submit their data by the end of 2014. While this approach preserved the integrity of the data from an impact perspective, it renders the task of splicing the data, controlling key variables, and deriving conclusions more difficult.
Data Analysis Caveats
This analysis is subject to many of the same caveats as any performance study, including survivorship and self-selection bias, a younger performance record, and typical limitations that plague small datasets. These caveats are unavoidable at this stage, and while they indicate that certain portions of the data must be interpreted cautiously, the data presented still contain insight and value for impact investing practitioners.
- Survivorship Bias. Survivorship bias is based on the notion that poor-performing funds will eventually drop out of the benchmark and cease data submissions, which, over time, biases performance upward as only the strongest performers remain in the dataset. However, we have no reason to believe that survivorship bias will skew the Impact Investing Benchmark any differently than it would skew the comparative universe or, for that matter, any of Cambridge Associates’ other PI benchmarks.
- Self-Selection Bias. Typically, this bias is manifested through managers of poor-performing funds declining to submit their data to Cambridge Associates’ database. As a result, any benchmark may represent a better-performing sample of funds than the actual universe. However, it is possible that poor-performing funds—impact or not—are more likely to submit their data to Cambridge Associates, as poor performers may have a stronger motivation to build a presence on Cambridge Associates’ database and gain free visibility to Cambridge Associates’ clients and investment directors. Self-selection bias could push performance in either direction; our assumption is that a random sample of funds submitted data for this benchmark. A normal returns distribution (Figure 10) similar to that of the comparative universe supports this assumption and implies that this bias would be equally applicable to conventional funds.
Jill Shaw et al. “A Framework for Benchmarking Private Investments,” Cambridge Associates Research Report, 2014.
- Evolving Performance Record. The performance of private investment funds is dynamic. Unlike public stock portfolios that often have significant overlap with both market indexes and peer strategies, private funds often have unique performance drivers relative to peers. Furthermore, performance cycles for private funds are long and constrained by a defined end-point. According to Cambridge Associates research, private equity and venture capital funds generally do not settle into a final performance quartile within their peer universes until six to eight years after inception. In fact, over 85% of private equity and venture capital funds launched between 1995 and 2005 were in at least three different quartiles before settling into their ultimate quartile. Even between the eighth and ninth years of a fund’s life, a full 19% of PE funds (and 26% of VC funds) shifted from one quartile to another.
The dataset of impact investing funds analyzed in this paper is nascent relative to the comparative universe; two-thirds of the 51 funds being analyzed incepted in 2005 or later versus just over half of funds in the comparative universe. As noted, this issue should be somewhat mitigated going forward, as the impact investing space, and therefore this benchmark dataset, matures over time. - Limits of a Small Dataset. One side effect of a small sample size is that the larger constituent funds have a disproportionate influence on pooled performance calculations. As the industry and this dataset grow, the outsized performance influence—either positive or negative—of individual funds will begin to wane and the ability to draw more meaningful conclusions from more segmented data will increase. The size of the dataset also inhibits the ability to control for more than two variables at once. For example, data can be analyzed by vintage year and geographic grouping or vintage year and fund size, but not all three variables concurrently.
Impact Investing Benchmark Performance Analysis
Flow of Capital
Private impact investing has come of age during a volatile period for the economy. The past 15 years have seen two major economic downturns. The bursting of the tech bubble dramatically curtailed the pace and valuations of private investment in the early 2000s. A few years later, the 2008 global downturn decimated investment portfolios across asset classes and effectively reduced investor liquidity. This led to a particularly steep drop off in the pace of investment for conventional PI funds, as some fund managers struggled to call capital in this environment. The funds in the Impact Investing Benchmark, however, exhibited a relatively steady pace of investment throughout the downturn (Figure 1). This is primarily due to rapid growth in the number of funds raised during that period: 18 funds in the Impact Investing Benchmark raised nearly $3.5 billion between 2008 and 2010, representing over 50% of total capital raised from 1998 to 2010.
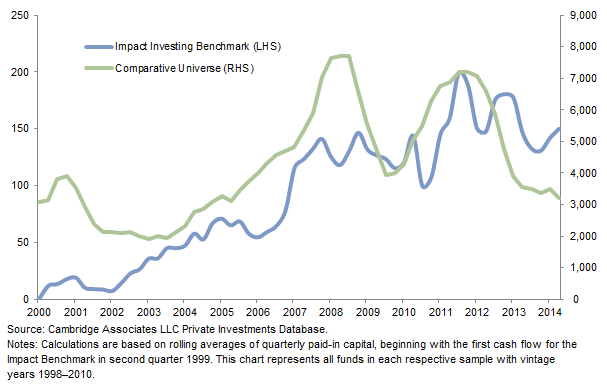
Figure 1. Capital Invested: Four-Quarter Rolling Average
As of June 30, 2014 • Paid-in Capital (US$ millions)
Summary Performance
Definitions of Calculation Metrics
Internal Rate of Return (IRR): The IRR is the since inception return metric most commonly used in the private equity industry. It represents the discount rate that makes the net present value of an investment equal to zero. The IRR calculations in this research are net of management fees and carried interest, representing actual returns to limited partners in US$ terms.
Pooled IRR: The pooled IRR aggregates all cash flows and ending net asset values in a sample of funds to calculate a dollar-weighted IRR across the sample.
Total Value to Paid-In (TVPI) Multiple: The TVPI multiple is calculated by dividing the total value of the fund (residual value plus value of capital distributed to LPs) by total LP contributions.
Distribution to Paid-In (DPI) Multiple: The DPI multiple is calculated by dividing cumulative fund distributions to LPs by total LP contributions.
.
Across all vintage years, the pooled IRR for the Impact Investing Benchmark is 6.9% versus 8.1% for funds in the comparative universe (Figure 2). Relative performance differs significantly by vintage year, with impact investing funds launched from 1998 to 2004 performing in line with, or better than, funds in the comparative universe, while impact investing funds launched more recently (2005–2010) have lagged. Furthermore, the funds within the Impact Investing Benchmark exhibited a tighter range of performance outcomes than funds in the comparative universe. In other words, the IRR of the average fund in the Impact Investing Benchmark is generally closer to the sample’s median IRR than is the case in the comparative universe.
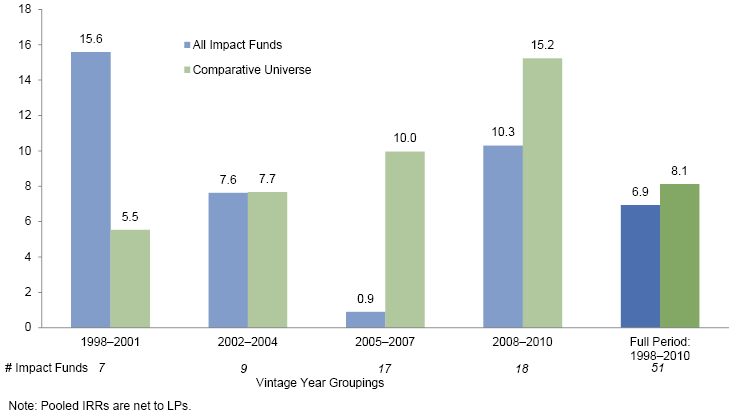
Figure 2. Performance by Vintage Year
As of June 30, 2014. Pooled IRR (%)
Performance by Vintage Year and Geography
Based on the distribution of the dataset, the benchmark is divided into three geographic groupings: Emerging Markets (EM), Emerging Markets excluding Africa (EM ex Africa), and Developed Markets (DM).[10]To be clear, EM funds include Africa funds. EM ex Africa is also shown because of the prominent weighting of Africa-focused funds in the Impact Investing Benchmark sample (see Table 3).
Emerging Markets. Emerging markets are the most represented geographic grouping in the Impact Investing Benchmark, and funds in these geographies launched from 1998 to 2010 performed in line with EM funds in the comparative universe (Figure 3). EM impact investing funds raised from 1998 to 2004, which have largely realized returns, have a pooled net IRR of 15.5% versus 7.6% for EM funds in the comparative universe. More recent periods show poorer relative performance for EM funds. Over 2005–2007, for example, EM impact investing funds meaningfully lag the EM comparative universe. Unlike performance in earlier years, 2005–2010 vintage year funds are largely unrealized (Figure 6) and performance will not be conclusive for another several years.
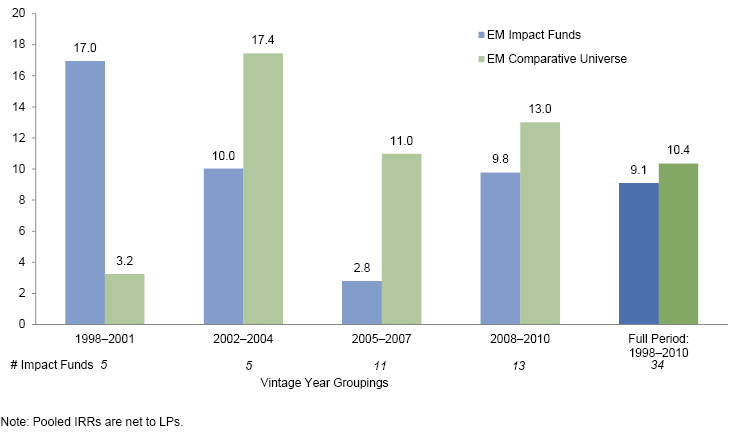
Figure 3. Performance by Vintage Year and Geography: EM Funds
As of June 30, 2014. Pooled IRR (%)
Emerging Markets Excluding Africa. EM ex Africa impact investment funds launched from 2005 to 2007 have performed relatively well, returning 8.4%, while those launched from 2008 to 2010 have not performed as well (Figure 4). Several EM and EM ex Africa impact investment funds are invested in frontier countries—the world’s riskiest markets with the least developed financial systems—while the comparative universe is dominated by emerging countries with more sophisticated private markets. For example, of the $49 billion (17% of total capitalization) in the comparative universe invested in Asia/Pacific EM funds, 41% was in funds dedicated exclusively to China. However, of the $163 million (3%) of Impact Investing Benchmark capital in Asia/Pacific EM funds, only 14% was dedicated to China.
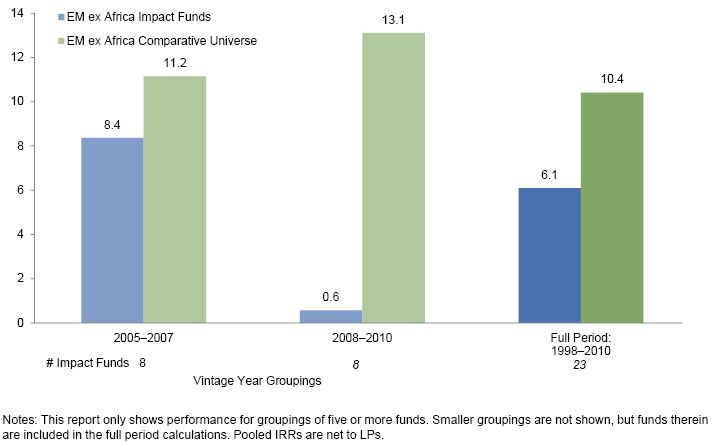
Figure 4. Performance by Vintage Year and Geography: EM ex Africa Funds
As of June 30, 2014. Pooled IRR (%)
Developed Markets. As with EM ex Africa funds, developed markets impact investment funds are relatively sparse and difficult to analyze across vintage years. The pooled IRR of the 17 DM funds in the Impact Investing Benchmark is modest at 4.8% (Figure 5). A few of the larger DM funds launched from 2005 to 2007 have had lackluster performance, and stronger performance from DM impact investing funds launched from 2008 to 2010 has not been enough to help the sample recover. An additional contributing factor is the youth of the DM impact investing funds. Just six of the 17 funds were launched before 2005, representing 21% of DM impact fund capital. However, in the comparative universe, funds representing 41% of overall DM capital were launched before 2005. Given this skew toward younger funds, DM funds unsurprisingly represent the biggest disconnect between realized and unrealized performance among the geographic groupings in the Impact Investing Benchmark as measured by the DPI (Figure 6).
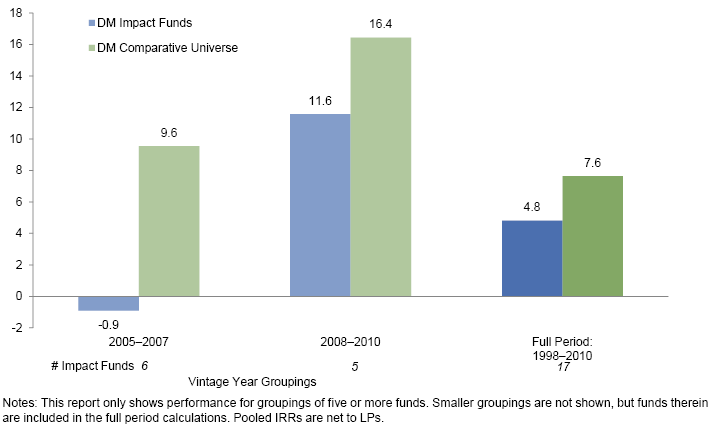
Figure 5. Performance by Vintage Year and Geography: DM Funds
As of June 30, 2014. Pooled IRR (%)
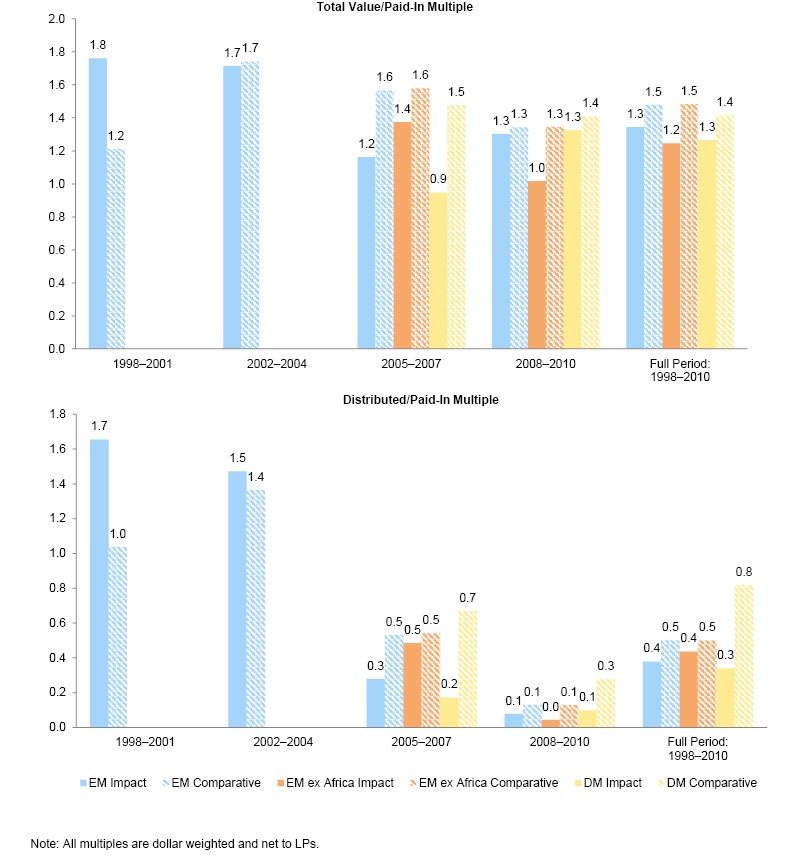
Figure 6. Multiples by Geography
As of June 30, 2014
Performance by Vintage Year and Fund Size
Due to the size of the Impact Investing Benchmark sample, performance metrics for certain vintage year groupings are disproportionately swayed by a few large funds. To neutralize the effects of the largest funds, we split the data into two groups: funds that raised less than or equal to $100 million and funds that raised greater than $100 million. This serves the additional purpose of testing the common perception that larger funds are run by the most skilled managers.
Overall, impact investing funds under $100 million launched from 1998 to 2010 posted a 9.5% IRR. These funds handily outperformed similar-sized funds in the comparative universe (4.5%), impact investing funds over $100 million (6.2%), and larger funds in the comparative universe (8.3%) (see Figures 7 and 8). More specifically, smaller impact investing funds launched from 1998 to 2001, 2002 to 2004, and 2005 to 2007 have outperformed smaller funds in the comparative universe by 5.6%, 5.6%, and 1.9%, respectively (Figure 7). Accordingly, smaller impact investing funds from those vintage years also have higher TVPI and DPI multiples than similar funds in the comparative universe (Figure 9). Smaller funds in the most recent vintage year grouping (2008 to 2010), however, have lagged both similar-sized comparative funds and larger impact investing funds.
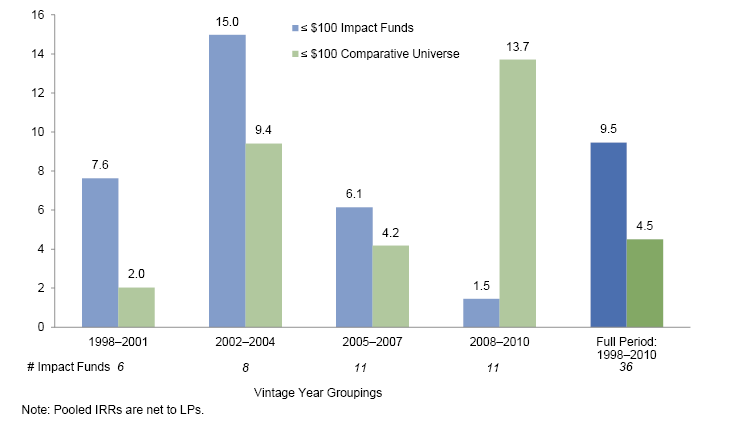
Figure 7. Performance by Vintage Year and Fund Size: ≤ $100 Million
As of June 30, 2014. Pooled IRR (%)
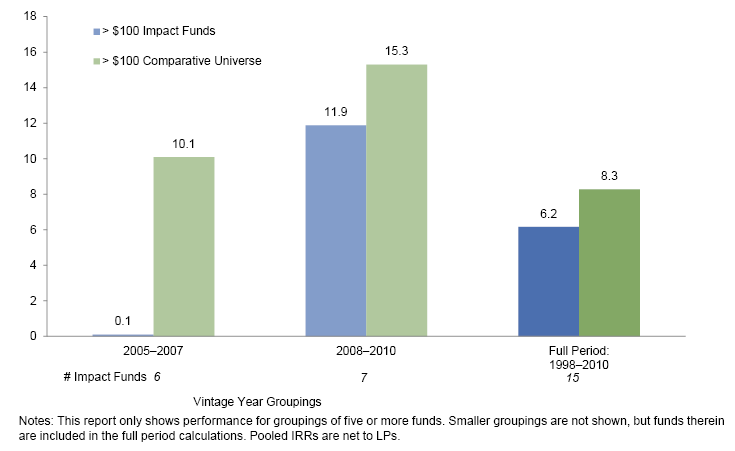
Figure 8. Performance by Vintage Year and Fund Size: > $100 Million
As of June 30, 2014. Pooled IRR (%)
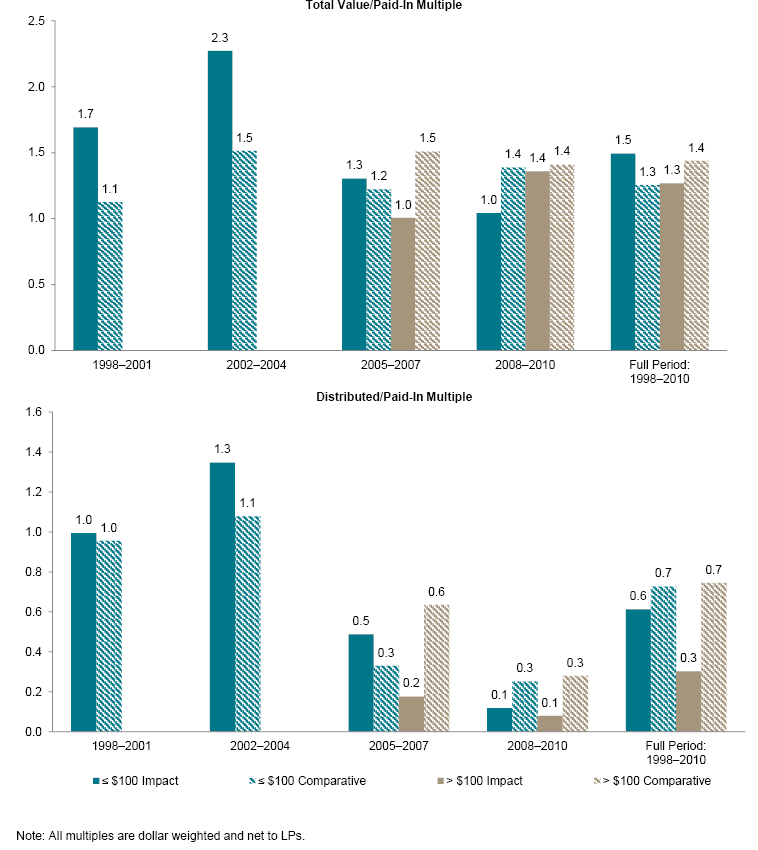
Figure 9. Multiples by Fund Size
As of June 30, 2014
US-Focused Funds Under $100 Million. The Impact Investing Benchmark contains ten US-focused funds under $100 million, spread evenly across vintage years. These funds have returned a 13.1% pooled net IRR versus 3.6% for comparative US funds under $100 million and 7.8% for comparative funds over $100 million launched during the same period.
First-Time Funds. A fund’s size is closely linked with its manager’s experience. Of the 17 Impact Investing Benchmark funds that are their managers’ first, 13 are under $100 million. Among the 13 are seven EM funds and six DM funds, spread relatively evenly across vintage years. These 13 funds returned a 12.9% pooled IRR—the EM funds returned 10.7% and the DM funds returned 14.1%.
Impact Investing Funds Below $50 Million. Of the 36 funds in the Impact Investing Benchmark that are under $100 million, 27 are under $50 million. These funds returned a pooled 8.2% net IRR and outperformed similar sized funds in the comparative universe in each vintage year grouping except 2008–2010.
Distribution of IRRs Relative to Comparative Universe
In future quarters, the Impact Investing Benchmark will be presented on a standalone basis, without the context of peer fund comparisons. For this exercise, however, the research team thought it important to include this comparative data primarily because there is a meaningful disconnect between targeted and achieved returns among private investment funds. Most market-rate private equity and venture capital funds target net returns of at least 20%, but among the funds in this study’s comparative universe, only 11% returned over 20% to LPs.
The distribution of Impact Investing Benchmark returns is similar to that within the comparative universe (Figure 10), albeit with a tighter distribution around the median in most vintage years (Figure 11). A lower percentage of impact investing funds has achieved greater than a 15% net IRR, but a lower percentage has reported an IRR of less than -5%. Overall, about two-thirds of funds in both the Impact Investing Benchmark and the comparative universe have provided positive net returns to LPs.
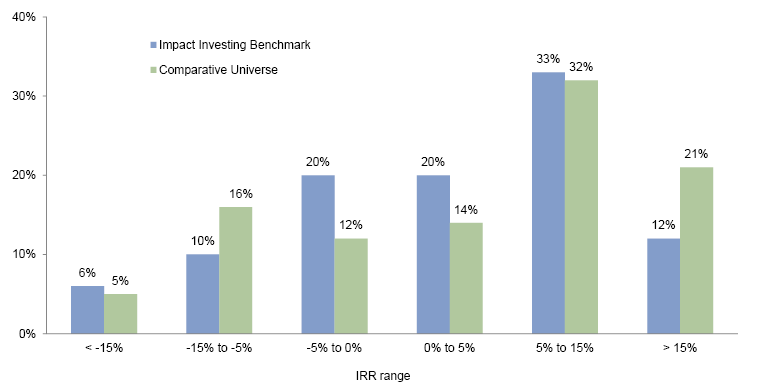
Figure 10. Distribution of Fund IRRs Net to LPs
As of June 30, 2014. Percent of Funds by Fund Count (%)
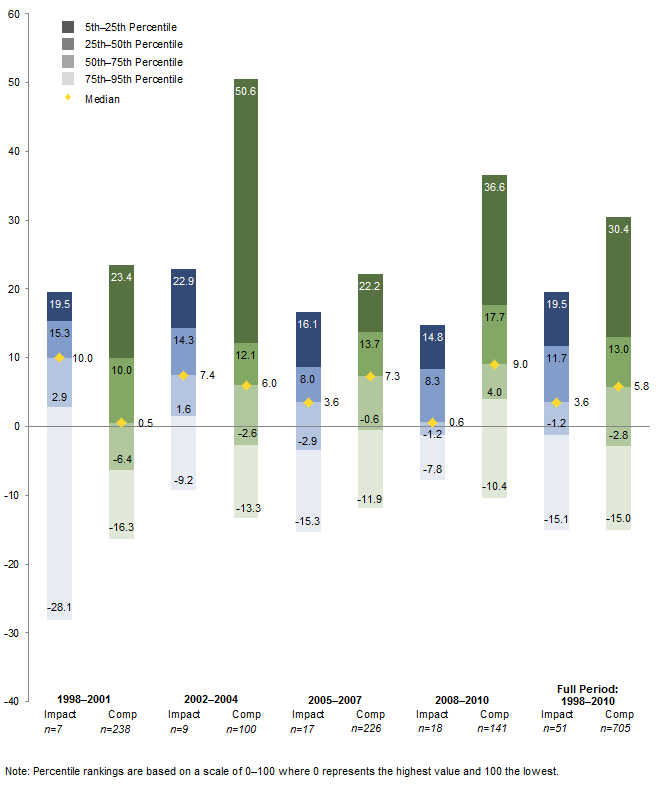
Figure 11. Distribution of Fund IRRs Net to LPs by Quartile
As of June 30, 2014 • Performance (%)
Conclusion
Like the impact investing industry, the Impact Investing Benchmark dataset is young and dynamic—its performance will evolve from quarter to quarter, as with any benchmark, with the addition of new funds and the maturation of existing ones. The data will become increasingly robust as the sample size grows, and the conclusions derived from this data will become more substantiated when multiple quarters can be analyzed.
At this stage, this research serves the important role of framing initial discussions about the performance of private equity and venture capital impact investments, and we believe this is the most robust dataset available to equip investors for this conversation. Given the limited size of the sample and the overall youth of the funds within the Impact Investing Benchmark, it is difficult to draw definitive conclusions on the performance of impact investing funds; however, the data do allow for several early observations:
- Market-rate returns are attainable in impact investing. Despite a perception among some investors that impact investing necessitates a concessionary return, the Impact Investing Benchmark has exhibited strong performance in several of the vintage years studied. In aggregate, funds launched between 1998 and 2004—those that are largely realized—have outperformed funds in the comparative universe. Over the full period analyzed (1998–2010), the benchmark returned 6.9% to investors versus 8.1% for the comparative universe, but much of the performance in more recent years remains unrealized.
- Smaller funds and EM funds have been the strongest performers. Impact investment funds that raised under $100 million returned a net IRR of 9.5% to investors. These funds handily outperformed similar-sized funds in the comparative universe (4.5%), impact investment funds over $100 million (6.2%), and funds over $100 million in the comparative universe (8.3%). EM impact investment funds have returned 9.1% to investors versus 4.8% for DM impact investment funds. Those focused on Africa have performed particularly well, returning 9.7%.
- Manager selection is key. In all private investing, manager selection and due diligence are critical steps in the investment process and are important factors in obtaining superior returns and in risk management; impact investing funds are no exception. There are funds within the Impact Investing Benchmark that have performed in line with top quartile funds in the comparative universe, showing that market rates of return for impact investments are possible and also reinforcing that manager skill is paramount.
This report marks an important first step in advancing investors’ ability to measure and evaluate impact investment fund performance, which will alleviate a key barrier to the industry’s growth. The usefulness and applicability of this data will continually increase as the sample size grows and its track record develops.
Appendix: Screening Process for Fund Impact Intent
Impact investments are defined by their intent to generate a social and/or environmental return in addition to a financial return. The focus of this initial report is private investment funds with a social impact objective. The process for ensuring that all funds included in the study have a clear intention to create social impact included the following steps:
- We identified a short list of relevant impact investing funds through existing databases maintained by various credible networks worldwide, including the GIIN’s ImpactBase, CA’s proprietary Mission-Related Investing (MRI) database, ImpactAssets 50, the Community Development Venture Capital Alliance (CDVCA), the European Venture Philanthropy Association (EVPA), and Opportunity Finance Network (OFN). This process identified funds that are likely to have the intention to create positive social impact, by nature of their participation in these impact-oriented networks.
- This short list was further refined to ensure that all funds met the structural and impact criteria for the study. If the impact intent of a fund was unclear, we conducted additional detailed review to determine if the fund could be included.
Organizations and Networks
Cambridge Associates MRI Database. CA’s MRI database sits within its broader investment manager database and includes funds in both public and private asset classes that align with various social or environmental mission objectives. MRI funds are assigned to the appropriate MRI category by the MRI investment manager research team, and tagged funds appear in conventional searches in addition to MRI searches. CA’s MRI database consists entirely of funds targeting a market-rate risk-adjusted return. It is only available to clients of the firm.
ImpactBase. ImpactBase is the searchable, online database of impact investment vehicles. Managed by the Global Impact Investing Network, ImpactBase enables fund managers to publish profiles describing various product features and parameters and increase visibility throughout the investor community. Accredited investors can subscribe to ImpactBase to search or browse product listings and contact managers. To list a profile on ImpactBase, the fund must have a clear intention to create positive social or environmental impact as a core purpose of its investment activity. The fund must also provide evidence of intention to measure and report impact. This can be demonstrated through impact reports, use of an impact measurement methodology, offering memoranda, and other investment or impact-related materials.
ImpactAssets 50. ImpactAssets 50 (IA50) is an annually updated list of experienced impact investment firms. The purposes of the list are to illustrate the breadth of active impact investment fund managers and offer investors and their advisors a portal to find new investment opportunities. The criteria for inclusion in the IA50 are:
- At least three years of firm experience in impact investing;
- At least $10 million in assets under management;
- Operating in more than one country, a country with a significant population, and/or a sizeable region of the United States;
- Managing recoverable assets;
- Demonstrated financial capacity;
- Demonstrated commitment to social impact and tracking clear measures of social and/or environmental impact.
Community Development Venture Capital Alliance. The CDVCA is a network of funds that provide equity capital to businesses in underinvested markets. These investors seek market-rate financial returns as well as social impact through job creation and the development of entrepreneurial capacity.
European Venture Philanthropy Association. The EVPA is a membership association of organizations practicing venture philanthropy, defined as “an approach to build stronger investee organizations with a societal purpose by providing them with both financial and nonfinancial support to increase their societal impact.” The membership of 180 organizations includes investment funds, banks, investment advisors, and foundations or other philanthropic organizations.
Opportunity Finance Network. OFN is a national network of community development finance institutions (CDFIs) that invest in low-income, low-wealth, and other disadvantaged communities. CDFIs are specialized institutions that operate in underserved markets, providing a range of financial products and services in economically distressed areas. These institutions are certified by the US Department of the Treasury and include regulated institutions such as community development banks and credit unions as well as non-regulated institutions such as loan funds and venture capital funds.
Jessica Matthews, Cambridge Associates
David Sternlicht, Cambridge Associates
Amit Bouri, Global Impact Investing Network
Abhilash Mudaliar, Global Impact Investing Network
Hannah Schiff, Global Impact Investing Network
Footnotes