As summer gives way to autumn each year, hundreds of American college campuses become the stage for one of the more popular sporting traditions in the country. Saturdays in the fall bring millions of students and alumni to campuses to watch their schools compete on the college football gridiron. While the football games play out on the field, this time of year tends to bring out another kind of competition: a “horse race” to see who has performed the “best” in investing the endowment.
Most colleges and universities release their fiscal year financial results during the fall, and the media inevitably issue stories comparing investment returns and judging “winners” and “losers” for the fiscal year. Colleges and universities themselves are not immune to interest in this information, with many eager to see how they have performed against peers. While scrutiny of peer performance results is most common among colleges and universities, interest in this information spans all types of endowed institutions.
There is a legitimate rationale for having an interest in the investment results of peers. In an industry such as higher education where institutions compete with each other for students, faculty, and other resources, a large endowment confers a competitive advantage. That advantage can widen or narrow over time on the basis of relative endowment performance. From a strategic planning perspective, an institution would want to know how its endowment compares to the competition.
Peer information also provides insights into the investment experiences of a diverse group of nonprofit institutions and can be a valuable research tool for understanding best practices and trends in the industry. For the past three decades Cambridge Associates has maintained a database of peer data that covers investment portfolio characteristics, organization design and governance, and strategic financial indicators. In this report, we explore the ways in which examining peer data can be informative and helpful to those digesting this information. We also remind readers of the pitfalls to avoid when using this information and why we believe an overemphasis on peer comparisons can lead to poor decision making.
Learning from Peer Data
To use peer data effectively, institutions must define their objective for conducting such analysis. Is it to understand how an institution stacks up against competitors? To research what distinguishes top-performing endowments from others? To review how other institutions with similar enterprise characteristics approach portfolio construction? To learn about industry best practices for certain issues? Defining the objective not only helps pinpoint the type of information that will be most useful for the analysis, but also can inform the method used to select an appropriate group of peers.
In our experience, comparison of investment returns is the most common type of peer analysis conducted. While institutions understandably want to know how they compare to competitors, simple total return comparisons do not provide the full context to explain how and why returns vary across institutions. Performance data are most informative when used in tandem with asset allocation data and other organizational and enterprise characteristics.
Performance Drivers
Peer performance statistics should be viewed through lenses other than simply who had a higher or lower return based on a simple total return comparison. Asset allocation, a key driver of the total return a portfolio earns, can be particularly enlightening in understanding the variation of returns among institutions. For an example of how performance and asset allocation data can be employed together, Figure 1 breaks the Cambridge Associates Endowment and Foundation peer group into four quartiles based on the trailing ten-year return as of June 30, 2016. In this analysis, each institution’s asset allocation was averaged across the eleven June 30 periods that fell from 2006 to 2016. The four quartiles in the “heat map” table represent the average of the institutions that fall within each quartile, with each data point shaded a color that represents its divergence from the overall universe mean. The chart of index returns in the top right provides the context of the market environment for the period. This format, which is included each quarter in our Endowments Quarterly report, helps illustrate the general differences in asset allocation structures across the peer group and how that links to the variation in overall returns.
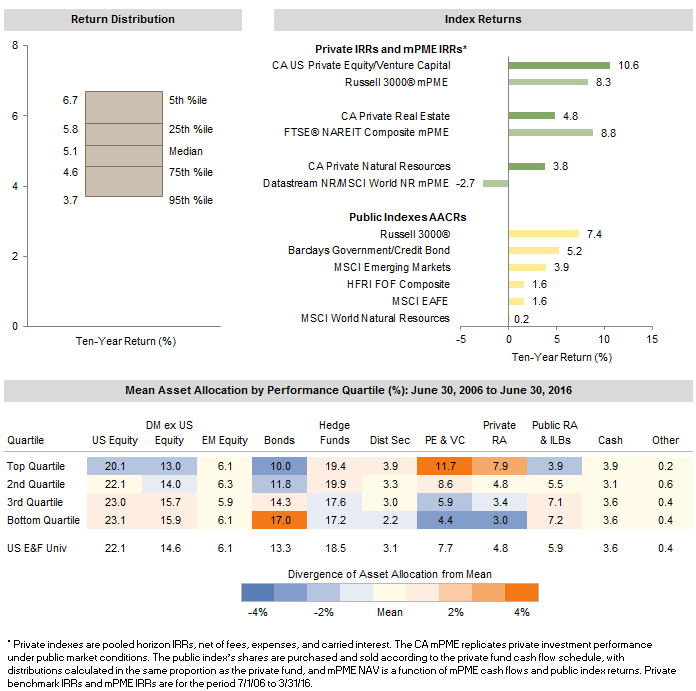
Figure 1. Analysis of Top and Bottom Performers: Ten-Year Asset Allocation
As of June 30, 2016 • n = 225
Sources: Endowment and foundation data as reported to Cambridge Associates LLC. Index data are provided by Barclays, Cambridge Associates LLC, Frank Russell Company, FTSE International Limited, Hedge Fund Research, Inc., MSCI Inc., the National Association of Real Estate Investment Trusts, and Thomson Reuters Datastream. MSCI data provided “as is” without any express or implied warranties.
Notes: CA US Endowment and Foundation Universe performance quartiles are based on the trailing ten-year return as of June 30, 2016. Mean allocations are for the eleven June 30 periods from 2006 and 2016.
While asset allocation is a key driver of investment performance, it does not fully explain the variation of returns reported across a peer group. The execution or implementation of an asset allocation strategy also contributes to the total return a portfolio earns. An attribution-type analysis that combines performance statistics and asset allocation can lend further insight into relative performance among different institutions.
Figure 2 displays the results of an estimated attribution analysis over the same ten-year period, with the peer group again broken down into the four performance quartiles. Within each quartile, the lighter shading of the bar represents the portion of the mean return that can be attributed to asset allocation. This portion is calculated using a blended return of asset class benchmarks weighted according to each institution’s asset allocation, with the weightings fluctuating each year as the portfolio’s asset allocation changes. The darker shading of the bar is calculated by subtracting the mean asset allocation return from the mean total return and is the portion of investment performance that cannot be explained by asset allocation. This “other” portion of returns is principally driven by implementation or execution decisions, which can include active management and manager selection.[1]This analysis assumes that flows to and from investment managers occur only on the last day of each year. In addition, the analysis uses a controlled set of asset class benchmarks that may be more or … Continue reading
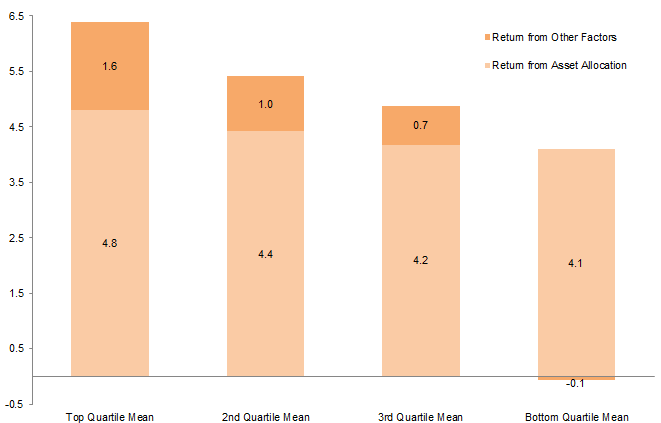
Figure 2. Attribution Analysis by Performance Quartile: Trailing Ten-Year Return
As of June 30, 2016 • Percent (%) • n = 225
Source: Endowment and foundation data as reported to Cambridge Associates LLC.
Both figures show a relationship between differences in asset allocation structures to the distribution of returns across the broad peer group. The latter analysis also shows how factors not explained by asset allocation have a significant impact on relative peer performance. The main point of both examples is to provide a deeper level of insight into relative return statistics that cannot be gathered through simple return comparisons.
Insights into Portfolio Construction and Implementation
A review of asset allocation is instructive, but insufficient to provide insight into the factors that contribute to the variation in performance drivers across institutions. Why do peer institutions employ different asset allocation structures? What issues impact the implementation and management decisions of the portfolio?
An institution’s investment policy is based on its unique blend of objectives, constraints, and risk tolerances. The overall financial and operating characteristics of an institution’s enterprise play a major role in determining the investment objective and constraints, which in turn impacts the portfolio’s asset allocation structure. A key factor that can vary widely across institutions is the level of dependence on the investment portfolio to support the operating budget. Other issues that could impact the risk profile of the portfolio include, but are not limited to, the overall net flow rate of the portfolio, the amount of liquidity available to the institution outside the portfolio, and the amount and overall structure of outstanding debt for the institution.
In addition to these enterprise factors, other characteristics such as asset size can impact an institution’s investment policy setting and implementation. The trend toward diversifying portfolios was pioneered by the largest endowments decades ago, and meaningful differences between the average asset allocation of large and small portfolios still remain today, particularly in illiquid private investments. The asset size of an institution’s portfolio also provides some indication of the amount of resources the institution can dedicate to management and oversight of the portfolio.
Each of these factors has some impact on an institution’s investment policy and how that policy is carried out. One or more of these factors can be useful in helping an institution narrow a broad universe down into a smaller group of peers that have similar constraints and objectives for the portfolio. This can help institutions understand how others with similar considerations approach portfolio construction. Narrowing down to a focused group of similar institutions can also lead to more appropriate peer groups for studying best practices on other endowment management issues.
Selecting a Peer Group
Peer groups, such as the Cambridge Associates Endowment and Foundation universe, track a diverse set of institutions. Included are institutions that can have quite different investment objectives depending on their business models, operating constraints, and resources. A broad peer group can be helpful in understanding the wide range of investment experiences of endowed institutions in the nonprofit industry, but may not always be useful for conducting specific analysis of the type we suggest here. A variety of criteria can be used to create a group of peers depending on what one is ultimately seeking to learn. Common factors that institutions consider when selecting peer groupings include institution type, asset size, asset allocation, and enterprise factors.
Institution type. Peer groups defined by the type of institution look at peers based on the type of charitable mission they pursue, creating a set of peers that may have similar considerations for their endowment based on their “industry.” For example, the government-mandated 5% annual distribution that a private nonoperating foundation must fulfill may lead it to consider as peers a group of other foundations that must abide by the same regulation. In other cases, institution type may be a dimension that is not narrow enough, as even within one grouping institutions may pursue a wide array of objectives with diverse asset allocations as a result. Some common institution types in our universe are colleges and universities, cultural and environmental institutions, foundations, hospitals, and independent schools.
Asset size. Peer groupings based on portfolio asset size consider institutions that likely have a similar scale and resources for portfolio management and oversight. However, asset size alone may still result in a group of institutions with quite varied asset allocations.
Asset allocation structure. Asset allocation is a key contributor to the total returns that institutions earn. Portfolios that have had higher levels of diversification over time have generally produced the best long-term investment returns. In particular, reviewing allocations to illiquid private investments can be a helpful additional filter, serving as an indicator of relative liquidity constraints, risk aversion, opportunity, and skill sets. For institutions without an allocation to private investments, comparing themselves to institutions with such an allocation may be a poor choice given the likelihood of different objectives for the portfolios.
Enterprise factors. Institutions set their investment policies based on their own objectives, constraints, and risk tolerances. Much of what determines an institution’s investment objectives and constraints is influenced by the financial profile and operating characteristics of the overall enterprise. Peer groups based on these enterprise factors can lend insight into how other institutions with similar considerations approach portfolio construction. Data that can be used for defining peer groups include endowment dependence, liquidity measures, net flow rate, and debt structures.
Multiple criteria. Many factors ultimately influence an institution’s investment policy and its management of that policy. Using just one of the aforementioned factors may not be sufficient for homing in on a group of similar institutions. Filtering a peer group based on multiple criteria can help an institution narrow its dataset to a group of institutions with which it has the most in common. Conversely, using too many criteria may result in a peer group of inappropriate universe size. The process of settling on the most appropriate peer group is more art than science.
The Pitfalls of Peer Data Comparisons
Peer performance comparisons are among the most common uses of peer statistics and we have described examples of analyses that can provide more insight into this data. While studying peer data can provide a wealth of information, institutions should avoid common pitfalls:
- use of peer data as a primary benchmark for the performance of investment portfolios;
- use of peer data as a benchmark in staff incentive compensation; and
- behavioral biases that lead to pursuit of strategies counter to the appropriate policy for their own portfolio objectives and enterprise.
Peer Performance as Benchmarks
Benchmarks help investors measure their investment performance on a relative basis so they can determine whether their portfolio decisions have added value. Institutions often seek to answer two questions with a total portfolio benchmark: (1) did our decision to diversify away from a “simpler” portfolio add value? and (2) did our choice of active managers add value versus simply investing in passive alternatives that seek to replicate an index?
The first question can be answered using a simple blended benchmark, which typically consists of a broad equity market benchmark and a broad bond market benchmark (e.g., 70% equity/30% bonds). To answer the second question, most institutions use a policy benchmark, which should represent the desired portfolio risk exposures without any expression of more active alternatives. The policy benchmark essentially serves as the portfolio’s alternative return had the institution selected a passively invested portfolio in proportion to the desired risk exposures,[2]Most institutions continue to use a policy benchmark geared more toward passively representing the portfolio’s target asset allocation, with a weighted blend of market indexes and other benchmarks. … Continue reading shedding light on whether active management and implementation decisions have added value to or detracted from overall performance.
Unlike policy benchmarks, peer universes do not reflect an alternative passive portfolio representative of an institution’s overall investment policy. Even disregarding the consideration that a policy benchmark should be investable, a peer universe benchmark is not appropriate given huge variations in asset allocation policies. Taking just the middle 50% of allocations to six major asset categories for the Cambridge Associates Endowment and Foundation peer group, dispersion from the high (25th percentile) to the low (75th) ranges from 4 to 14 percentage points (Figure 3). This wide range of allocations incorporates some contrasting approaches to portfolio construction. In fact, looking at the overall asset allocation structure for all institutions in this analysis, only 6% had an overall structure that would place them within these middle ranges for each strategy. If the intent is evaluate the portfolio’s active management and implementation decisions, comparison to a broad peer universe will not provide this information.
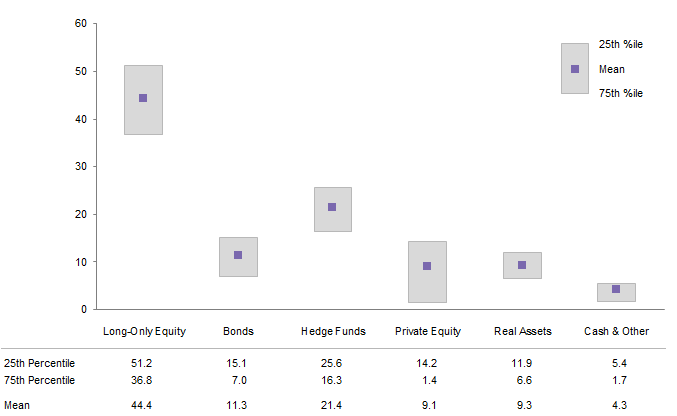
Figure 3. Asset Allocation Distribution
As of June 30, 2016 • Percent (%) • n = 424
Source: Endowment and foundation data as reported to Cambridge Associates LLC.
But what about a smaller grouping? Institutions with portfolio sizes greater than $1 billion are often considered to be closer knit peers. The portfolios at these institutions tend to be managed by a CIO-led investment office and the larger asset sizes historically presented certain investment opportunities that were not always practical for smaller portfolios. Yet even within this particular peer group, asset allocation differs widely. Looking at the distribution of asset allocation to the six major asset categories, just 4% of institutions had an overall asset allocation structure that fell within the 25th percentile to the 75th percentile of allocations for each strategy.
Conclusions drawn from peer performance comparisons can be quite different than those elicited from evaluating returns against the policy portfolio benchmark. It is not uncommon for an institution to underperform a peer group median, while still outperforming its own policy portfolio benchmark, and vice versa. Differences observed in returns across endowed institutions are a result of both investment policy decisions (asset allocation and risk exposures) as well as investment management decisions (active vs. passive, choice of fund). Because of the many diverse investment practices of institutions, the mean or median returns of broad peer groups do not meet the criteria of an appropriate benchmark. The policy portfolio benchmark and any asset class–specific benchmarks should be the primary tools for evaluating an institution’s investment performance.
Peer Performance to Measure Staff Performance
Part of effective governance is ensuring that an organization’s compensation program is designed to attract and retain talent while avoiding conflicts and misaligned interests. Performance-based compensation programs are one way to achieve this objective and have become common among endowments and foundations. Performance-based incentive plans are most appropriate where responsibility—and accountability—for managing endowment assets clearly resides with the CIO and investment staff, and may not be appropriate for every institution or every investment office position.
A large component of incentive compensation typically hinges on the portfolio’s performance relative to a benchmark. Benchmarks for incentive compensation should be selected to match the areas over which the investment staff has control. Therefore, the choice of metrics needs to reflect not only the objective of the investment portfolio, but also the realities of each institution’s investment process. Most often the benchmark used for calibrating incentive compensation is some form of the policy portfolio benchmark, measured over three to five years.
Some trustees have been inclined to include a peer-based component in their incentive compensation plans. An institution may desire to know how its endowment has performed compared to those with similar characteristics, but caution should be taken when considering adding these comparisons to an incentive compensation plan. Typically, policy setting is the domain of the investment committee while execution of the policy is the domain of the investment staff. Since peer universes consist of institutions with varying asset allocation policies, comparisons of total returns across a group of institutions do not effectively evaluate how an investment staff may have executed the institution’s asset allocation policy.
Even putting these philosophical issues aside (which we would not advise!), we also urge trustees to consider differences that exist in reported returns for other institutions. The devil is in the details. Is performance net of just manager fees, or oversight fees too? What about methodologies for the performance of private partnerships? Are valuations lagged by one quarter or do they reflect more current information? After years of analyzing our universe statistics we can say with certainty that no single standard exists, as institutions report in ways that work best for them. While the differences that result from the varying calculation methodologies are not consequential over the long term, the impact can be more meaningful over shorter time periods.
Past Cambridge Associates surveys have shown that the majority of endowments and foundations with performance-based incentive plans do not incorporate peer-based benchmarks into their plan calculations. Of those that do, some have recently discontinued the use of peer-based benchmarks altogether or lowered the weighting of this component in their overall calculation. Still, in our most recent survey of 47 leading endowment and foundations, 34% of the CIOs with performance-based incentive plans indicated a portion of their compensation was tied to peer comparisons. Of these, the average weighting to this component accounted for 25% of the overall incentive compensation calculation.
While it may be valuable and instructive to know what others are doing, and how successfully they are doing it, paying the CIO on the basis of “beating” those other institutions can create a misalignment of interest between investment staff and the institution. It is also fair to consider whether compensation based on beat-the-peers schemes tends to discourage the sharing of investment ideas and conceptual approaches that might benefit all institutions.
Behavioral Biases
Peer data can lend insight into the variety of investment practices employed across nonprofit institutions. Institutions often seek out best practices of peers when establishing or re-evaluating their own policies. Where an institution falls outside of the norm relative to other peers, examining policies to ensure decisions have conviction behind them is healthy. While peer information can be useful and informative in this process, institutions should avoid a herding mentality and becoming overly influenced by the experiences of others. Decisions should always reflect what is most appropriate for an institution’s own objectives, constraints, and resources.
Similarly, it can be enlightening for an institution to observe top performers to determine whether it can learn anything constructive as it navigates its own investment journey. However, institutions should avoid attempting to mimic the portfolio construction and management practices of other institutions simply because those institutions had the highest returns. Doing so can lead to poor decisions that do not match an institution’s own objectives. Endowment management should always be reflective of an institution’s own unique circumstances.
Conclusion
Institutions understandably have an interest in the investment results of peers. Since the endowment is an important financial resource in an institution’s business model, trustees or staff should not stick their heads in the sand and ignore how their endowment compares to the competition. Analyses such as those proposed in this paper can lend deeper insights into the range of investment results reported by peers. In addition, monitoring industry trends and best practices can be an important part of an institution’s research process.
That said, institutions should avoid certain pitfalls when consuming peer data. We understand the need for trustees to demonstrate value to their stakeholders, donors, and potential donors, but peer comparisons are not necessarily the most effective way to do so. A portfolio’s track record should be reviewed and evaluated relative to the objectives and benchmarks captured in the investment policy statement. Institutions should also steer clear of certain behaviors that could divert them from pursuing their own portfolio objectives. When analyzing peer data, we recommend keeping the following points in mind:
- Too much focus on other institutions can be detrimental to one’s own investment process. “How can our portfolio be like that of Institution X?” is not a question that institutions should be seeking to answer.
- Adding language to the investment policy statement that outlines peer data’s proper use can be helpful at those institutions where peer comparisons have become a distraction.
- Peer return universes lack several properties that define a valid benchmark. Most notably, endowed institutions within a peer group employ a wide range of investment policies.
- Investment performance relative to peers should not play a large role, if any, when determining incentive compensation for investment staff.
- Calculation methodologies for reporting returns can differ between institutions, leading to apples to oranges comparisons. Methodology differences can have a meaningful impact on short-term returns, particularly when private investment markets are volatile.
- Endowments are uniquely positioned to make long-term investments. While it is prudent for institutions to monitor annual performance results, the greatest focus should always be concentrated on a long-term perspective.
Access to a robust peer data universe has benefits, but a hyper-focus on peer comparisons can be distracting, if not destructive, to effective governance. If any sports analogy should be adopted by fiduciaries, we would suggest “keep your eye on the ball,” the ball being an institution’s own unique blend of objectives and constraints.
William Prout, Investment Director
Grant Steele, Senior Investment Director
Footnotes